
The financial world has a strange obsession with transforming complex macro-engineering into passive retail folklore.
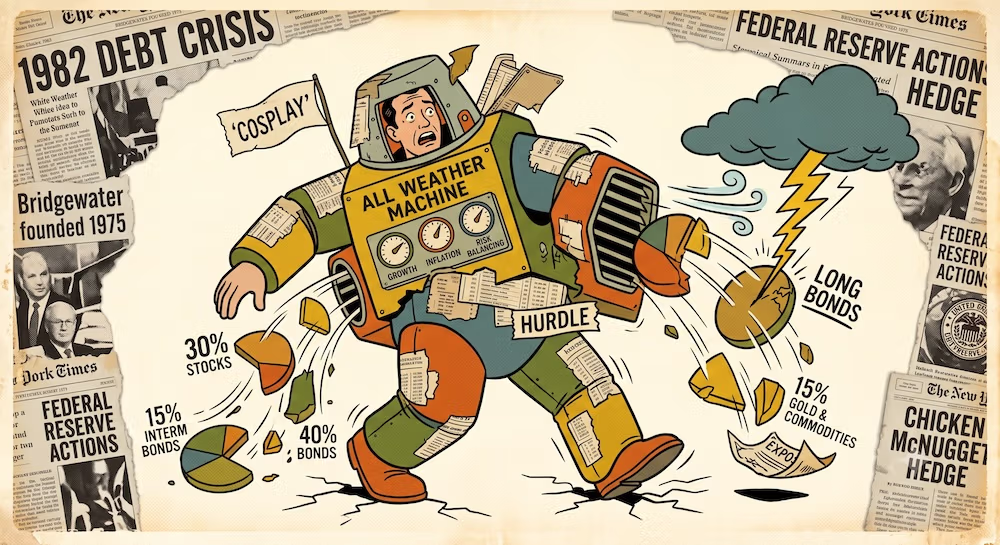
If you spend ten minutes in any online personal finance circle, you will inevitably run into a tidy, static pie chart labeled the “All Weather Portfolio.” It usually commands a fixed allocation: 30% stocks, 40% long-term bonds, 15% intermediate bonds, and a neat 15% split between gold and commodities. The internet treats this arrangement like a holy relic—a set-and-forget recipe handed down from Ray Dalio that will protect your wealth through any market cycle without requiring you to think.
I look at that pie chart, and I see a massive structural disconnect.
The public version flattens a highly sophisticated, dynamic institutional framework into a lazy retail asset split. Personally, I don’t see any evidence that Ray Dalio built Bridgewater Associates into a macro powerhouse by discovering a magic combination of fixed percentages. He built it by designing a system meant to handle shifting economic environments without trying to predict which one comes next. When you strip away the institutional machinery and run that raw static allocation inside a standard brokerage account, you aren’t running Dalio’s strategy. You are holding a bond-heavy defensive portfolio that capitalizes on specific historical tailwinds while leaving yourself exposed when the underlying macro weather shifts.
If we want to extract anything useful from the All Weather framework, we have to look past the retail brochure and understand how the machine actually maps economic regimes.
The Hedging Origin: Mapping Exposure, Not Market Timing
To understand why this strategy operates the way it does, I find it useful to look at where Bridgewater actually came from. Long before it became a giant macro investment manager, the firm started in 1975 as a corporate risk advisory shop. It didn’t begin as a speculative vehicle designed to guess direction; it began as a tool to solve real-world logistical headaches.
The intellectual pivot that birthed the framework didn’t happen during a period of calm; it was forged in the fire of a devastating structural mistake. In the late 1970s and early 1980s, Dalio was operating as a classic discretionary global macro trader. Relying on qualitative analysis and economic intuition, he made a massive, public, highly confident bet in 1981 and 1982 that the global economy was heading into an absolute debt depression.
He was wrong. Instead of a deflationary collapse, the Federal Reserve’s aggressive monetary policy actions broke the back of inflation, sparked a massive bull market in equities, and initiated a multi-decade economic expansion. Dalio has often described this period as a humbling failure that nearly bankrupted Bridgewater, forcing him to lay off his staff and borrow money from his family just to pay basic living expenses.
I find this brutal historical snapshot far more instructive than any corporate biography. It was this specific operational rock-bottom that forced Dalio to abandon the hubris of discretionary market timing. He realized that trying to predict the future was a mathematical game of ruin. The lesson was stark: if your survival depends on being right about the next macroeconomic turn, you are structurally fragile. The firm’s entire operational DNA shifted from prediction to engineering balance.
Shortly before this pivot, a widely reported anecdote from the firm’s early history highlights how this engineering mindset applied to corporate consulting: Dalio’s work advising McDonald’s ahead of the launch of the Chicken McNugget. McDonald’s wanted to introduce the new menu item but faced a major corporate risk—the volatile price of chicken. Chicken producers were exposed to massive swings in their primary input costs, namely corn and soy meal feed. Because they couldn’t predict their own expenses, they refused to offer McDonald’s a fixed purchase price.
The solution wasn’t to forecast grain prices. Instead, Bridgewater engineered a synthetic hedge that combined corn and soy futures to neutralize the underlying feed volatility for the producers. This allowed the suppliers to lock in their costs and grant McDonald’s a stable, predictable contract price.
I like this story because it reframes the entire philosophy of the firm. The DNA of the strategy was never about being a mystical market oracle; it was about liability matching. It was about identifying a structural risk exposure, dissecting the forces behind it, and finding an asset that naturally offsets that vulnerability.
When the formal institutional All Weather strategy was established in 1996, it applied this exact same liability-hedging logic to the global economy. The strategy assumes that asset classes do not move in isolation. They are driven by macroeconomic fundamentals, specifically surprises in two key forces: growth and inflation.
By mapping these forces, the framework divides the economic landscape into four distinct environments.

The Four Regimes: Growth and Inflation Are the Map
The core thesis of the framework is that every asset class has a structural relationship to the macroeconomic environment. An asset doesn’t just go up or down based on market mood; it performs or suffers based on how economic growth and inflation print relative to what the market already expected.
The market is a discounting mechanism. Current asset prices already reflect the collective consensus of all market participants regarding future economic growth and future inflation. Therefore, realized investment returns are not driven by the absolute level of growth or inflation, but by the deviation from the consensus—what the framework terms macro “surprises.”
                  THE REGIME RISK AXIS

                     INFLATION SURPRISE (+)
                               │
                               │  • Commodities
       • Commodities           │  • Gold
       • Gold                  │  • Inflation-Linked Bonds
       • Emerging Equities     │    (TIPS)
                               │
GROWTH SURPRISE (─) ───────────┼─────────── GROWTH SURPRISE (+)
                               │
       • Nominal Sovereign     │  • Equities
         Bonds                 │  • Corporate Credit
       • Cash-Like Reserves    │  • Commodities
                               │
                               │
                     INFLATION SURPRISE (─)
When you look at portfolio construction through this lens, you stop viewing assets by their arbitrary labels and start looking at what weather they are designed to survive. Let’s break down the underlying mechanics of each quadrant to see how these environmental dynamics operate under the hood.
1. Rising Growth (Growth Surprise +)
When corporate earnings, credit demand, and industrial production outpace expectations, the environment favors productive capital. Traditional equities, emerging market equities, and corporate credit possess a structural tailwind here because expanding economic activity directly drives corporate cash flows and improves corporate solvency metrics.
In this regime, consumer confidence rises, leading to increased velocity of money and higher corporate profit margins. Companies can pass on input costs to consumers, making equity ownership the ultimate vehicle for capital appreciation. The main risk to this regime is valuation excess—where asset prices outrun economic reality—or a sudden transition into unexpected inflation, which can prompt central banks to aggressively tighten financial conditions and raise the discount rate applied to those future cash flows.
2. Falling Growth (Growth Surprise -)
When economic activity contracts, consumer demand drops, and default risks rise, equity cash flows dry up. In this climate, high-quality nominal sovereign bonds and cash-like reserves may offer a critical shock absorber. They tend to appreciate or hold their value because capital flees toward safety, and falling interest rates boost the capital value of fixed, guaranteed coupons.
During a standard deflationary recession, the central bank’s primary lever is to cut the short-term interest rate. When short rates fall, the yields on intermediate and long-term sovereign bonds are dragged downward as well. Because bond prices move inversely to yields, these fixed-income assets experience capital gains precisely when the equity sleeve of a portfolio is experiencing capital destruction. However, if a growth collapse is accompanied by a massive inflation shock, this bond protection can break down entirely.
3. Rising Inflation (Growth Surprise – / Inflation Surprise +)
This is the traditional graveyard for conventional portfolios. When the real value of fixed cash flows falls, both stocks and nominal bonds get hit simultaneously. The assets that may have a structural tailwind in this quadrant are those tied to tangible, real-world value—commodities, gold, and inflation-linked sovereign bonds (TIPS).
In a rising inflation regime, nominal bonds suffer because their fixed coupon payments are worth less in real purchasing power terms. Equities suffer because rising input costs compress profit margins, and central banks raise discount rates, lowering the present value of future earnings. The assets that may hold up better are those that act as direct economic inputs (like oil, agriculture, and industrial metals) or monetary alternatives (like gold). However, I always look at this sleeve with a healthy dose of skepticism: inflation-linked assets like TIPS can still fall in nominal terms if real interest rates rise fast enough, and raw commodities often generate little to no yield while you wait for the inflation shock to arrive, presenting a massive structural drag during extended periods of low inflation.
4. Falling Inflation (Inflation Surprise -)
When inflation prints lower than expected, discount rates fall, economic pressures ease, and the real purchasing power of guaranteed coupons gains value. Nominal sovereign bonds and high-growth equities tend to find an exceptionally favorable environment because the cost of capital declines.
In a disinflationary expansion, corporations enjoy lower input cost growth while maintaining pricing power, leading to historic margin expansions. Simultaneously, fixed-income investors realize that their static interest payments buy more real goods than previously anticipated, driving an institutional bid for long-duration sovereign debt. The primary threat to this regime is an outright deflationary spiral tied to an absolute collapse in global economic growth, which can impair equity lines via demand destruction even as nominal bonds rally.
Why All Weather Is Not Forecasting
Most investment strategies are built on a dangerous premise: that you must accurately predict the future to make money. Wall Street wants you to believe that if you just analyze enough data, you can guess whether next year will bring a recession or an inflationary boom, and position your capital accordingly.
The All Weather framework explicitly rejects that idea. It is designed around the concept of preparation rather than prediction.
I find this structural humility to be the most compelling aspect of the design. My position has always been that the market is a discounting machine that already prices in the consensus view of growth and inflation. You only make or lose money when a surprise occurs—when reality deviates from that consensus. Because macroeconomic surprises are inherently unpredictable, I view trying to time your shifts between regimes as a structural trap.
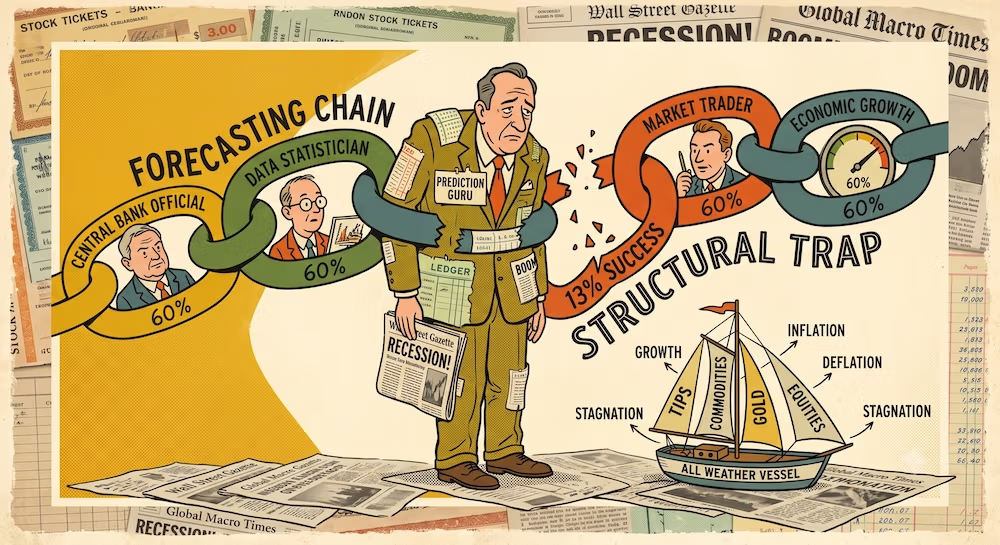
To illustrate why this matters, consider the mathematical probability of consistently getting macro forecasts correct. To win the market-timing game, you have to accurately forecast the growth print, accurately forecast the inflation print, accurately forecast how the central bank will react to those prints, and accurately forecast how market participants will price assets based on that reaction.
If you have a 60% probability of getting each of those four links right—which is an incredibly generous assumption for any discretionary macro investor—your cumulative probability of success across the entire forecasting chain is just under 13%. This is a toy illustration, not a statistical claim about actual macro forecasting, but it shows the inherent friction of relying on forecasting chains.
Probability of Success = 0.60 × 0.60 × 0.60 × 0.60 = 12.96%
Instead of betting on which regime comes next, the strategy aims to balance your structural exposures so that you own roughly equal risk across all four environments at all times. If the economy enters a period of falling growth and rising inflation, your equity line will suffer, but your commodity and inflation-linked bond exposures have a structural reason to lift the weight. You aren’t trying to avoid the storm; you are ensuring your vessel has a sail deployed for whatever direction the wind blows.

Why Risk Parity Enters the Machine
This is where the engineering aspect becomes critical, and it is also where the public retail myth completely falls apart. You cannot achieve an evenly balanced regime map by simply dividing your dollars equally among different asset classes.
Asset classes do not have equal risk profiles. Equities are inherently more volatile than high-quality nominal bonds—historically exhibiting roughly two to three times the annualized volatility. If you build a portfolio by putting 50% of your money in stocks and 50% in bonds, you might think you are balanced. But from a risk perspective, your equity exposure completely dominates the portfolio’s total variance. You aren’t balanced across economic regimes at all; you are entirely leveraged to the rising growth quadrant.
To understand the mathematics under the hood, we have to look at the portfolio variance equation for a simple two-asset mix:
σp2 = w12σ12 + w22σ22 + 2w1w2σ1,2
Where w represents the dollar weights, σ represents the individual asset volatilities, and σ1,2 represents the covariance between them. Because the equity volatility parameter (σequity) is vastly larger than the bond volatility parameter (σbond), the first term dominates the equation when dollar weights are equal (w1 = w2 = 0.50).
To achieve true balance across economic regimes, the institutional framework utilizes risk parity. It sizes allocations by the inverse of their volatility, meaning less volatile assets (like short- and intermediate-term bonds) receive a much higher dollar weight than highly volatile assets (like stocks or commodities) to ensure their total risk contributions are equal.
Risk Contributioni ≈ Risk Contributionj
But look at what this mechanical reality does to an unleveraged investor. If you heavily weight your portfolio toward low-volatility sovereign fixed income to balance out your volatile stocks, your entire blended portfolio’s expected return drops precipitously toward the baseline yield of those bonds. If 70% to 80% of your dollars are locked up in low-yielding intermediate Treasuries just to match the risk footprint of your 20% equity slice, the portfolio becomes an incredibly sluggish compounding engine.
To overcome this, institutional managers apply mandate-dependent leverage to the lower-risk asset sleeves via futures and swaps. By scaling up the risk profile of the fixed-income allocations, they align their risk footprints with equities without sacrificing the overall return target.
This is the exact point where I separate myself from the public brochure. The popular 30/40/15/7.5/7.5 split is an un-leveraged proxy. It completely flattens the institutional engine required to make those bond weights productive. If you run that mix raw, you are sacrificing massive capital efficiency during equity bull markets just to maintain a defensive posture that you might not actually need—or be able to sustain psychologically.

The Regime Break: 2022 and the Problem of Inflation
I believe every investment framework must be judged by its failure modes, and for any strategy relying on risk-balancing mechanics, the year 2022 was a violent reality check.
For nearly three decades following the mid-1990s, the All Weather approach enjoyed a historically unique macro tailwind. Inflation was quiet, and stocks and bonds maintained a reliable, negative correlation during equity market corrections. Bonds were a highly effective shock absorber because central banks routinely cut rates during growth scares, sending bond prices up precisely when stocks collapsed.
But 2022 exposed the vulnerability at the core of the regime map: the assumption of stable asset covariance.
When inflation surged globally, central banks were forced to hike interest rates aggressively. This created a dual systemic shock. Higher discount rates crushed equity valuations, while rapidly rising yields caused severe capital erosion in long-duration fixed income.
For many balanced and risk-parity-style portfolios, the old shock absorber did not just fail; it became part of the pain. When a high-inflation regime takes hold, traditional nominal diversification metrics can stall precisely when you expect them to protect you. I see this not as a temporary glitch, but as a structural reminder: when inflation rules the macro landscape, assets that often move in opposite directions can begin moving together and dropping together.
The math of positive correlation during an inflation shock means that both the equity sleeve and the heavily weighted fixed-income sleeve enter a simultaneous drawdown. Because risk parity portfolios hold amplified allocations of fixed income to ensure risk equilibrium, a positive correlation regime acts as a dual-engine penalty. The diversification benefit can shrink dramatically precisely when the total risk framework experiences maximum stress.
Furthermore, size introduces its own structural limits. When an institutional macro manager scales to over $120 billion in assets under management, they lose the ability to nimbly navigate around structural shifts. They cannot easily rotate into localized, niche inflation hedges like specialty real estate, physical agricultural land, or distinct micro-cap resource equities. They are structurally chained to the most liquid macro pipelines—primarily large-scale sovereign debt issuance and global currency lines. When those primary pipelines face a coordinated valuation correction driven by a structural change in global inflation baselines, scale becomes a distinct structural constraint.
The All Weather Regime Map
| Economic Regime | What Changes | Assets That May Have a Structural Tailwind | Main Failure Risk |
|---|---|---|---|
| Rising Growth | Corporate earnings, credit demand, and production improve relative to expectations. | Equities, corporate credit, cyclical commodities. | Valuation excess, aggressive central bank tightening, unexpected inflation pressure. |
| Falling Growth | Economic activity contracts, default risks elevate, and growth expectations drop. | High-quality nominal sovereign bonds, cash-like reserves. | Severe inflation shocks that break bond price protection. |
| Rising Inflation | Real value of fixed cash flows falls; cost of living and input costs outpace expectations. | Commodities, gold, inflation-linked bonds (TIPS). | Extreme volatility, persistent roll costs in futures, poor yield profiles at the entry point. |
| Falling Inflation | Discount rates fall, economic pressures ease, and real values of fixed coupons rise. | Nominal sovereign bonds, high-growth equities. | Severe deflationary cycles tied to an absolute collapse in global economic growth. |
What Actually Travels
Once we strip out the institutional brochure and the simplified online mythology, the underlying architecture provides several critical, conceptual lessons for independent allocators:
- Assets Are Economic Exposures, Not Labels: The core diagnostic lesson is to look past rigid definitions like “growth” versus “value” or “aggressive” versus “conservative.” The real task is analyzing how each line item responds to structural growth and inflation surprises, turning the portfolio into a map of macroeconomic exposures.
- The Public Static Split Is Not the Institutional Machine: The risk of adopting the un-leveraged retail pie chart is confusing a simplified educational baseline with true risk engineering. Choosing to hold heavy nominal bond and commodity weights without institutional leverage means accepting a lower long-term compounding ceiling in exchange for near-term volatility reduction.
- Bonds Diversify Some Regimes, Not All Regimes: The long-term failure mode is treating negative stock/bond correlation as a permanent law of nature. Fixed income can be an excellent hedge against a pure growth scare, but it routinely becomes a significant liability when a regime is driven by structural inflation shocks.
- All Weather Means Resilience, Not Invincibility: The structural reality is that no portfolio can hedge out every single permutation of macroeconomic chaos simultaneously without reducing its expected return to near zero. The framework is designed to minimize the catastrophic downside of any single macro future, but it remains fully exposed to systemic regime transitions where underlying correlations shift.
- The Framework Is a Map, Not a Recipe: Modern vehicles exist that attempt to bring multi-asset strategies to individual accounts, but the lesson is that they introduce their own structural hurdles—including tracking error, internal leverage complexities, execution costs, and substantial behavioral burdens. They are implementation choices, not the core lesson of the framework.
Ultimately, the true value of analyzing the All Weather architecture isn’t about finding a perfect asset allocation formula to copy blindly. It is about learning to ask the uncomfortable question that most traditional stock-heavy investors spend their entire lives avoiding: What economic weather is your capital actually built to survive?
What is the core difference between the retail All Weather allocation and Dalio’s institutional strategy?
Not exactly a minor detail—it is a completely different machine. The public retail split popularized in personal finance books is a static, un-leveraged arrangement of 30% stocks, 40% long bonds, 15% intermediate bonds, and 15% commodities/gold. Dalio’s institutional strategy at Bridgewater utilizes a dynamic, risk-budgeted infrastructure where low-volatility assets like sovereign debt are scaled up using institutional leverage to match the risk contribution of equities. If you hold the retail split raw inside a standard account, your capital is heavily concentrated in low-yielding assets without the structural amplification that makes the institutional beta profile productive.
What is the absolute minimum portfolio size required to execute a true risk-balanced regime map?
It depends entirely on your implementation toolset. If you are trying to construct this manually by purchasing individual futures contracts to lever your fixed-income sleeves and executing physical raw commodity contracts, you face massive capital scale boundaries—often requiring a seven-figure line to absorb contract sizing and maintenance margins. However, if you abandon manual replication and look at modern, pre-packaged institutional-lite exchange-traded vehicles that embed futures-based financing inside their internal expense structures, the minimum is simply the price of a single share.
How does the All Weather Portfolio handle high inflation regimes compared to traditional portfolios?
With a distinct structural layout. A traditional 60/40 portfolio is highly vulnerable to rising inflation because both stocks and nominal bonds get hit simultaneously as discount rates rise and fixed cash flows lose real value. The All Weather framework prepares for this environmental surprise by mapping real asset exposures—specifically physical commodities, gold, and inflation-linked sovereign bonds (TIPS)—into the rising inflation quadrant. These assets carry a structural tailwind that is explicitly designed to lift the portfolio’s total weight when nominal paper assets experience capital erosion.
Why did balanced risk parity strategies experience significant drawdowns during the 2022 market downturn?
Because the underlying assumption of stable asset covariance broke down. For nearly three decades, stocks and bonds maintained a reliable, negative correlation during equity corrections. When inflation surged in 2022 and triggered rapid central bank interest rate hikes, that relationship inverted. Stocks and bonds dropped in tandem. Because risk-balanced frameworks require heavily amplifying their bond sleeves to match equity risk contributions, this positive correlation flip meant that both primary engines turned into concurrent sources of capital destruction.
Does a modern independent allocator need to implement leverage to benefit from the economic quadrant framework?
No. The lesson is conceptual, not prescriptive. You do not need to take on high margin debt or complex derivatives to utilize the core mechanism. The real value for an independent allocator is diagnostic: treating your asset classes as economic exposures rather than arbitrary labels. By understanding which assets may provide a structural tailwind during growth scares versus inflation shocks, you can build a more resilient portfolio canvas even if you choose to remain entirely un-leveraged and accept a lower volatility baseline.
What are the primary transaction costs and tax drags associated with this multi-asset regime map?
The operational friction can be severe if mismanaged. Frequently shifting capital between volatile asset lines like gold, commodities, and equities to maintain exact risk-parity targets realization immediate capital gains liabilities within taxable brokerage accounts. Furthermore, holding broad commodity lines via traditional structures can trigger structural futures roll costs (contango drag) and unfavorable collectibles tax treatments. Independent allocators often manage this exposure by limiting rebalancing to strict tolerance bands or utilizing automated multi-asset vehicles within tax-advantaged accounts.
Why is asset volatility lookback tracking a potential risk factor in the All Weather strategy?
The failure mode is lagging a sudden macro regime shift. Risk-balanced models rely on trailing historical data to calculate an asset’s volatility and determine its position weight. If a long-dormant asset class—such as short-term interest rates or long-duration fixed income—experiences a violent, sudden spike in volatility after years of stability, the model’s structural sizing will be incorrectly configured before it can mathematically adapt, leaving the portfolio over-allocated to the exact asset experiencing capital destruction.
This article is also available in Spanish. [Leé la versión en castellano: Ray Dalio y la Cartera All Weather: Ingeniería para Regímenes Económicos]