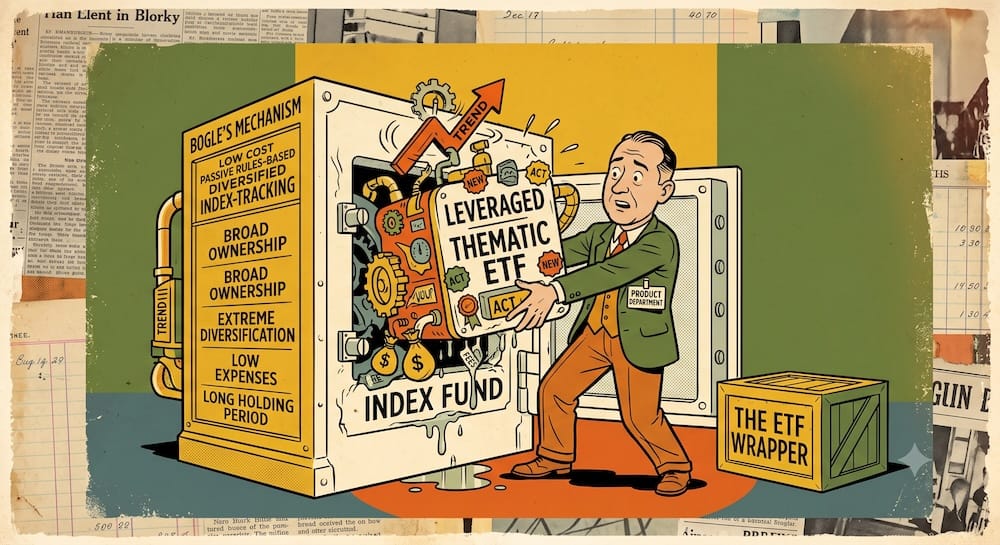
To understand the early record of Warren Buffett, you have to look past the modern corporate monument of Berkshire Hathaway and stare directly into the raw numbers of a defunct 1950s private investment vehicle. Between 1957 and 1969, Buffett Partnership Ltd. (BPL) compounded its gross assets at an astonishing 29.5% annually. For the limited partners, this translated to a 23.8% net compound annual growth rate (CAGR). Most remarkable of all, the partnership achieved this trajectory while avoiding a negative calendar year in the reported record.
The conventional financial media has smoothed this record into an elegant, simplified myth. The standard narrative claims that Buffett achieved these results by sitting quietly in Omaha, thinking deep thoughts, and purchasing high-quality consumer monopolies to hold until the end of time.
That narrative is completely ahistorical.
The early outperformance of Buffett Partnership Ltd. was not born from qualitative “moat” investing, nor was it the product of unexplainable market magic. It was the output of a highly specific, mathematically rigorous asset architecture that stacked multiple distinct return engines on top of one another. Buffett functioned as an economic scrap-metal merchant, a specialized arbitrageur, and an aggressive micro-cap activist.
This article deconstructs the precise attribution mechanics behind those extraordinary returns. BPL’s record was manufactured by a rare confluence of structural capital terms, severe capacity constraints, a fragmented market microstructure, and a willingness to absorb profound relative tracking error. When multiple hidden levers are pulled simultaneously at exactly the right scale and in exactly the right era, extraordinary performance becomes a matter of mechanical inevitability.

The Historical Ledger: A Reconstructed Audit of the Partnership Era
To analyze the performance mechanics of BPL, we must first separate the metrics Buffett used to judge himself from the metrics modern quantitative analysts use to map historical factor exposures.
In his original letters to his limited partners, Buffett used the Dow Jones Industrial Average as his primary hurdle, viewing it as the standard proxy for the unmanaged, large-cap equity market of his era. To perform a rigorous return attribution study today, however, we must also evaluate the partnership against a reconstructed total return calculation of the S&P 500, including dividends.
The table below provides the full, unabridged performance record of Buffett Partnership Ltd. across its entire operational lifespan.
| Fiscal Year | Gross Partnership Return (%) | Limited Partners’ Net Return (%) | Dow Jones Industrial Average (Excluding Div) (%) | S&P 500 Reconstructed Total Return (Including Div) (%) | BPL Net Alpha vs. Reconstructed S&P 500 (%) |
| 1957 | 10.4% | 9.3% | -8.4% | -8.4% | +17.7% |
| 1958 | 40.9% | 32.2% | 34.0% | 43.3% | -11.1% |
| 1959 | 25.9% | 20.9% | 20.0% | 20.0% | +0.9% |
| 1960 | 22.8% | 18.6% | -9.3% | -6.2% | +24.8% |
| 1961 | 45.9% | 35.9% | 18.7% | 26.9% | +9.0% |
| 1962 | 13.9% | 11.9% | -10.8% | -8.1% | +20.0% |
| 1963 | 38.7% | 30.5% | 17.0% | 22.8% | +7.7% |
| 1964 | 27.8% | 22.3% | 14.6% | 16.5% | +5.8% |
| 1965 | 46.9% | 36.9% | 14.2% | 12.4% | +24.5% |
| 1966 | 20.4% | 17.4% | -15.7% | -10.1% | +27.5% |
| 1967 | 28.3% | 23.1% | 15.2% | 25.6% | -2.5% |
| 1968 | 58.8% | 45.6% | 4.3% | 7.7% | +37.9% |
| 1969 | 6.8% | 6.8% | -11.6% | -6.2% | +13.0% |
| CAGR | 29.5% | 23.8% | 5.7% | 7.4% | +16.4% |
This data introduces a fascinating paradox. How did a private investment fund extract a staggering 16.4% of annualized net alpha above the broader market while avoiding negative calendar years in the reported record? The answer requires moving past biographical summaries and systematically isolating the seven distinct return engines that drove the BPL machine.

Return Engine One: Small Enough to Exploit Absolute Inefficiency
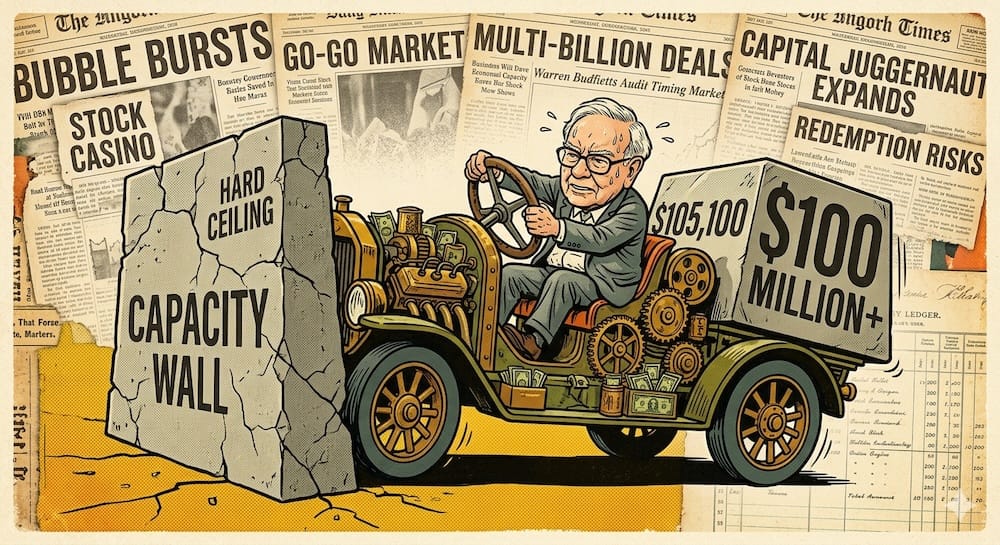
The first and most foundational engine of Buffett’s early returns was an unyielding market microstructure advantage. When Buffett launched the partnership in 1956, his total initial capital pool stood at just $105,100—of which only $100 was his own cash. Even when the partnership expanded to roughly $100 million in total assets prior to its dissolution in 1969, the capital base remained small enough to hunt in the highly fragmented, neglected corners of the public markets.
The macro regime of the 1950s and 1960s was an informational desert. There were no electronic stock screeners, no instant SEC Edgar alerts, no algorithmic high-frequency trading firms, and no passive index funds hoovering up small-cap float. Information diffusion was entirely manual. Financial data was trapped in physical Moody’s and Poor’s manuals, which had to be hand-turned page by page.
Because institutional capital required significant liquidity to move its performance needles, major banks and funds completely ignored companies with sub-million-dollar market capitalizations. This left the micro-cap space wide open for absolute informational arbitrage.
Buffett’s edge was physical diligence and basic mathematical processing. By simply flipping pages faster than his contemporaries, he routinely found micro-cap companies trading at valuations that defied basic economic logic. At this tiny scale, securities were mispriced not because of complex macroeconomic variables, but because no one else was looking at them. BPL could accumulate significant percentages of an asset’s outstanding float without immediately triggering sharp price spikes, harvesting structural alpha simply by operating at a capacity size where competition was virtually non-existent.

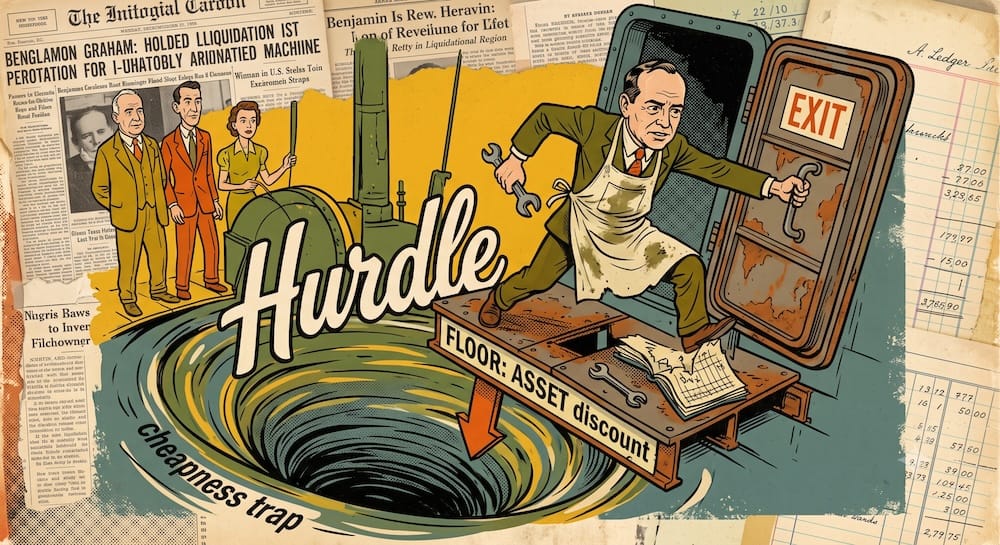
Return Engine Two: Cheapness With Catalysts
A common mistake among retail stock pickers is assuming that buying a cheap asset is sufficient to generate market-beating returns. Cheapness alone often leads straight into value traps—mediocre businesses that stay cheap forever while their internal operations slowly erode. Buffett understood that extraordinary compounding required cheapness paired with a definitive path to value realization.
BPL did not rely on the broader market’s changing sentiment to close valuation gaps. Instead, Buffett categorized his equity holdings into three distinct operational sleeves: Generals, Workouts, and Controls. Each bucket represented a different mechanism for unlocking value.
If the public market refused to revalue a cheap, liquid asset (“Generals”), Buffett moved up the operational spectrum. He shifted from a passive observer into an active financial engineer, utilizing corporate event timelines (“Workouts”) or accumulating outright voting power (“Controls”) to force corporate liquidations, spin-offs, or capital reallocations.
By running these strategies simultaneously inside a single capital pool, BPL transformed value investing from a hopeful, passive waiting game into a proactive exercise in corporate restructuring. Cheapness provided the structural margin of safety; the operational buckets provided the catalyst.
Return Engine Three: Workouts Reduced Market Dependence
During periods when the broader equity market rose too far, too fast, making cheap micro-caps difficult to find, Buffett systematically throttled down his equity beta. Instead of holding cash or style-drifting into expensive growth stocks, he redirected BPL’s capital into event-driven arbitrage positions, which he labeled “Workouts.”
These positions consisted of announced corporate events: mergers, liquidations, spin-offs, tender offers, and corporate reorganizations. The return profile of a Workout position is governed by legal contracts, regulatory approvals, and corporate timelines—not by the daily shifts in public market multiples. If a merger closes on schedule, the arbitrage spread is realized regardless of whether the Dow or the S&P 500 is up, flat, or down for the month.
To accelerate the compounding speed of this absolute-return sleeve, BPL utilized bank credit lines to finance these highly predictable arbitrage spreads. Crucially, Buffett enforced a defined borrowing limit, capping structural bank debt at 25% of the partnership’s net asset value. This constraint was explicitly intended to reduce the risk of forced liquidation or margin calls during unexpected macro disruptions.
By stacking a levered, market-neutral arbitrage sleeve alongside his traditional equity portfolio, Buffett insulated BPL from market drawdowns. In down years like 1957, 1962, and 1966, the Workouts sleeve acted as a powerful ballast, grinding out absolute positive returns while the broader market indices collapsed into negative territory.

Return Engine Four: Control Situations Manufactured Exits
When an undervalued company remained cheap for an extended period, Buffett’s preferred return engine was the “Control Situation.” In these plays, BPL accumulated enough outstanding shares to secure board representation or outright corporate control, allowing him to manually manufacture his own exit strategy.
A prime historical anchor for this mechanism was the Sanborn Map Co. intervention between 1958 and 1960. Sanborn printed physical maps for insurance underwriters, an operation with a structurally declining core business. However, over decades, the company had accumulated an internal investment portfolio containing blue-chip stocks worth roughly $65 per share. Due to market fragmentation and retail neglect, Sanborn stock traded in the public market at just $45 per share.
Buffett recognized this as a low market-beta, asset-unlocking opportunity. He did not buy Sanborn hoping for a turnaround in the map-printing business. Instead, BPL accumulated a massive equity stake, fought his way onto the board of directors, and threatened a hostile proxy battle.
Buffett then engineered an elegant corporate restructuring: he forced Sanborn to use its investment portfolio to buy back its own shares from disgruntled retail investors at fair asset value. This instantly unlocked the trapped corporate wealth for BPL, removing public market volatility entirely from the return equation.
A similar activist framework was deployed at Dempster Mill Manufacturing Co. between 1956 and 1963. Initially approached as a cheap, asset-based farm-equipment manufacturing situation that could be worked out through repurchases or asset optimization, the operations continued to deteriorate. After BPL secured a 70% control stake, Buffett stopped treating it as an ongoing concern.
He installed a turnaround manager named Harry Bottle, who aggressively slashed dead inventory from $4 million down to $1 million and squeezed the trapped cash out of the physical operations. Buffett then took that liquidated capital and placed it straight into a high-yielding securities portfolio managed directly inside the corporate shell.
In both cases, extraordinary alpha was extracted not by predicting future earnings growth, but by buying liquid assets at a deep structural discount and utilizing corporate authority to force an exit at intrinsic value.
Return Engine Five: Fee and Liquidity Architecture Kept the Machine Holdable
The structural outperformance of BPL was heavily enabled by its contractual foundation. Many active managers today are structurally broken by their fee and liquidity terms; Buffett designed BPL’s architecture to maximize compounding efficiency and align long-term behavioral holding power.
The partnership agreement of 1956 rejected the traditional corporate asset-gathering fee structure:
- 0% Management Fee: Buffett collected zero dollars for simply managing the assets. If the portfolio moved sideways or lost money, he received no income, completely eliminating the incentive to grow assets under management for its own sake.
- 25% Performance Allocation: Buffett collected a quarter of all partnership profits, but only after crossing a 6% cumulative hurdle rate.
- Deficiency Carry-Forward: If the partnership put up a return below the 6% threshold, or logged a down year, the exact dollar underperformance was carried forward as a deficit. Buffett could not collect performance fees in future years until the historical deficit was entirely wiped clean.
This fee mechanism acted as a massive, non-dilutive internal leverage engine for Buffett’s personal net worth during up years, allowing his capital account to compound inside the partnership structure rather than being reduced by a fixed management-fee drag.
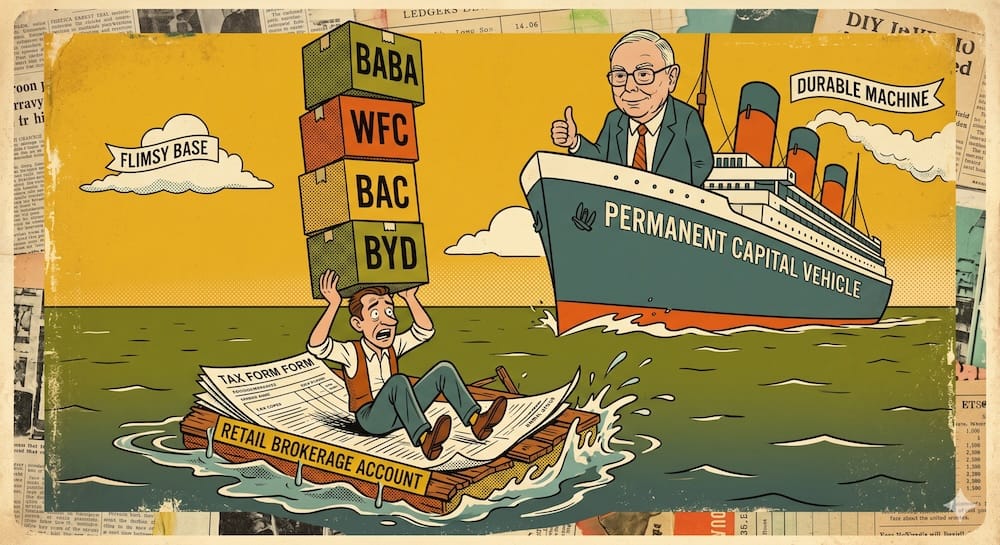
Equally critical was BPL’s restricted liquidity structure. Limited partners were legally prohibited from executing sudden redemptions based on emotional reactions to market panics. Capital could only be withdrawn once per year, on December 31, with rigorous advance notice requirements.
During intra-year panics—such as the 1962 Flash Crash, which dragged the S&P 500 down to an -8.1% annual loss—Buffett’s capital base remained entirely stable. While contemporary mutual funds were forced to liquidate positions at cyclical bottoms to satisfy fleeing retail investors, Buffett was structurally insulated. He could hold his positions, ignore short-term market fluctuations, and aggressively deploy BPL’s capital into deeply discounted assets at the exact moment of maximum liquid duress.
Return Engine Six: Tracking Error Was the Price of the Edge
The title of this article promises to explain why BPL’s returns were so extraordinary. Part of that answer is purely behavioral: the returns were extraordinary because Buffett was willing to pay the psychological price required to sustain an edge. That price is called tracking error.
In modern investing circles, tracking error is often treated as a metric of risk to be minimized. In the real world of factor investing, tracking error is the mandatory volatility that occurs when your portfolio looks entirely different from the index. If you want to generate massive alpha relative to the market, you must accept periods of massive underperformance relative to that same market.
Look back at the historical ledger for the year 1958. The post-war American economy was surging, and the S&P 500 total return index ripped an exceptional 43.3% gain. Buffett Partnership Ltd. put up an objectively fantastic year, delivering a 32.2% net return to its limited partners.
In absolute terms, 32.2% is a career-defining year. In relative terms, it represents a brutal -11.1% underperformance trap against the index.
Most investors today, exposed to the constant noise of online financial performance tracking, would have broken down under that tracking error. The psychological temptation to abandon the deep-value micro-cap strategy, liquidate the unglamorous net-nets, and performance-chase large-cap momentum would be overwhelming.
Buffett repeated this tracking error pattern in 1967, lagging the S&P 500 by -2.5% during another speculative bull market. BPL’s extraordinary long-term CAGR was only possible because both Buffett and his locked-in partners possessed the rare behavioral tolerance required to endure multi-year relative dead zones without style-drifting. Extraordinary returns require an extraordinary willingness to look wrong in the short term.

Return Engine Seven: The Edge Had a Capacity Limit
The final reason BPL’s returns were so extraordinary is perhaps the most vital for modern portfolio construction: the strategy was strictly capacity-constrained. The returns were extraordinary precisely because they were earned at a capital scale that allowed the machine to function.
As the 1960s bull market progressed, BPL’s total assets under management scaled toward $100 million. At that size, the micro-cap return engine began to seize up. Buffett could no longer deploy meaningful percentages of his capital base into sub-million-dollar net-nets without entirely absorbing the target companies’ outstanding float, turning liquid positions into permanent, illiquid corporate takeovers.
The capacity limit of manual net-net arbitrage had been reached. Rather than diluting his strategy, asset-gathering for fees, or shifting his capital into large-cap markets where he possessed no informational edge at the time, Buffett chose to completely shut down the partnership in May 1969.
The extraordinary 29.5% gross CAGR was a direct function of a strict capacity fit. The edge died when the asset size outgrew the underlying market inefficiency. Buffett’s early outperformance was a brilliant, finite exercise in matching an optimized capital structure to a specific, bounded pocket of market friction.
The Modern Return Attribution Map
When we take the historical mechanisms of Buffett Partnership Ltd. and translate them into modern quantitative risk architecture, the folksy stock-picking mythology dissolves into a stack of distinct factor exposures. BPL’s returns were not magic; they were the output of systematic risk premiums combined with structural advantages.
The matrix below maps the historical return engines of the partnership era directly to their modern factor equivalents, highlighting the structural realities that govern modern portfolio design.
BPL Return Engine & Attribution Map
| Return Engine | Historical Mechanism | Why It Boosted Returns | Why It Was Hard to Hold | Modern Portability Equivalent |
| Micro-Cap Inefficiency | Manual research via Moody’s manuals; hand-calculating balance sheet ratios. | Exploited massive informational vacuums where nano-cap assets were entirely neglected by institutional funds. | Required intense, manual page-by-page labor; highly illiquid names with zero institutional validation. | Non-existent via manual stock picking. The modern micro-cap universe is more electronically screened and far more competitive. |
| Generals (Deep Value) | Buying net-nets trading at less than 2/3 of Net-Current-Asset Value (NCAV). | Extracted the systematic Value Premium by capturing deep asset-backed discounts with an embedded liquidation floor. | Caused massive relative tracking error in raging bull markets; portfolio filled with operationally distressed firms. | Systematic exposure via low-cost, diversified small-cap value or value-characteristics funds. |
| Workouts (Arbitrage) | Special situations, liquidations, and merger arbitrage funded with up to 25% bank debt. | Extracted Event-Driven Alpha and market-neutral returns that decoupled the portfolio from broader index direction. | Required deep technical understanding of legal contracts; leverage introduced structural risk if deals collapsed. | Liquid alternative funds, managed futures, or maintaining a highly disciplined short-duration Treasury sleeve. |
| Control Situations | Hostile board proxy battles and forced inventory reductions (Sanborn, Dempster). | Extracted an Activist Premium by manually creating catalysts to close valuation gaps without relying on public markets. | Tied up massive amounts of capital in highly illiquid, litigious corporate boardroom battles for multiple years. | Not directly available at ordinary retail scale. This requires institutional private equity or dedicated activist hedge fund structures. |
| Fee Architecture | 0% management fee; 25% performance allocation above a cumulative 6% hurdle. | Eliminated fixed cost drag during down or flat years; kept the manager entirely aligned with absolute capital gains. | The manager faced extreme income volatility, earning zero revenue if the portfolio failed to beat the hurdle. | Replicated behaviorally by maintaining strict cost control, utilizing ultra-low-cost ETFs ($<0.25\%$ expense ratios). |
| Liquidity Lockup | Legal partnership terms restricting redemptions to a single annual window on Dec 31. | Captured a structural Liquidity Premium, allowing the portfolio to survive panics without suffering forced asset liquidations. | Required partners to abandon the comfort of daily liquidity, trusting the process through steep intra-year drops. | Replicated behaviorally through strict holding discipline—maintaining a long-term horizon during market panics. |
What Made It Extraordinary vs. What Made It Unrepeatable
For the modern DIY investor building a personal asset allocation framework, the core challenge is distinguishing between timeless behavioral principles and obsolete operational regimes. We must avoid the trap of historical admiration—worshiping a legendary record while ignoring the structural elements that made it possible.
The final matrix outlines the core friction points between BPL’s historical structure and the modern financial landscape, delineating exactly what can be absorbed and what must be ruthlessly expelled.
Extraordinary vs. Unrepeatable Matrix
| Feature | Helped BPL Returns Because… | Modern Retail Copy Problem | Sponge Investor Verdict |
| Manual Net-Net Selection | Provided completely uncontested asset-backed bargains in an era lacking automated screening tools. | Clean net-net opportunities are far more visible and competitive today. Many remaining candidates are low-quality, illiquid, distressed, or operationally impaired. | Ruthlessly Expel Single Net-Nets. Do not manually hunt for cheap balance sheets in obscure public listings. The systematic value premium is better captured through automated, diversified factor funds. |
| Hostile Activist Interventions | Allowed Buffett to unlock hidden real estate and securities portfolios at Sanborn Map without market cooperation. | A retail investor sitting at a desk cannot run a proxy battle, secure board seats, or fire underperforming corporate executives. | Expel Activist Illusions. Accept that retail capital is purely passive. Never buy an operationally broken business assuming it will fix itself without outside structural intervention. |
| Calculated Bank Leverage | Magnified low-beta Workout returns by borrowing up to 25% of NAV from commercial lenders on institutional credit terms. | Retail margin lines are subject to elevated interest rates, sudden broker maintenance tier shifts, and automated liquidation triggers. | Expel Retail Margin Debt. Standard brokerage margin accounts are highly dangerous behavioral traps. Rely instead on unlevered factor tilting and absolute cost discipline to drive outperformance. |
| Asymmetric Performance Allocation | The 0% management fee structure ensured that the compounding engine faced zero frictional bleed during flat or down cycles. | High-fee active mutual funds and standard advisory wealth-management fees impose a permanent, compounding drag on net returns. | Absorb Cost Minimalism. Treat your personal portfolio like a zero-fee partnership. Ruthlessly minimize investment costs, transaction friction, and turnover drag to protect the internal compounding machine. |
| Extreme Tracking Error Tolerance | Insulated Buffett from style-drifting into overvalued speculative markets during the late 1950s and late 1960s. | Modern investors are bombarded with real-time portfolio tracking, financial media noise, and constant comparison traps. | Absorb Behavioral Discipline. If you tilt your portfolio toward small-cap value or alternative asset factors, you must accept long multi-year stretches of looking completely wrong relative to the S&P 500. |
The Sponge Verdict
The ultimate lesson of Buffett Partnership Ltd. is a lesson in structural humility. BPL’s extraordinary returns were the unique product of a specific market scale matching a highly fragmented historical regime. It was a beautiful machine built for a landscape that has since been entirely re-engineered by electronic liquidity and algorithmic execution.
As sponge investors, we must expel the romantic fantasy of copying the physical BPL playbook. You cannot manually build a market-beating portfolio today by chasing single micro-cap net-nets, running manual merger arbitrage trades, or imagining yourself as a boardroom activist inside a retail brokerage account.
But you must completely absorb the timeless mathematical discipline that sat beneath that historical structure.
We can automate the Value and Size factors through low-cost, systematically diversified factor-tilted funds. We can insulate our portfolio core by treating cash and short-duration assets as a strategic ballast during late-stage market expansions. Most importantly, we can build our own behavioral liquidity shield—maintaining total fee discipline, keeping trading friction at absolute zero, and cultivating the rare emotional stomach required to endure severe tracking error in pursuit of a long-term edge.
The strategy must match the current regime’s parameters, not a ghost regime from seventy years ago. Keep your costs microscopic, your factor exposures automated, and your psychological anchor locked firmly to the cold empirical data.
Educational Trade-Off Note
This analysis is presented strictly for historical, educational, and quantitative return-attribution purposes. Attempting to replicate the historical strategies of Buffett Partnership Ltd. through manual selection of concentrated micro-cap equities, single-stock value speculation, or manual event-driven arbitrage carries significant liquidity, operational, and concentration risks. Modern structural regimes have vastly increased efficiency in these spaces, and manual retail execution faces severe implementation friction and value-trap vulnerabilities. Always balance tactical factor exposures with a systematically diversified core asset allocation aligned to your individual risk tolerance and investment horizon.
Why were Warren Buffett’s partnership returns so much higher than his modern Berkshire returns?
It comes down to a structural capacity limit. During the 1957–1969 partnership era, Buffett managed millions—not hundreds of billions. This small scale allowed him to deploy capital into deeply inefficient micro-cap companies and “net-net” liquidations that completely move the performance needle for a small fund but are mathematically useless to modern Berkshire Hathaway. When capital scales past a certain threshold, the micro-cap edge dies.
What was the exact fee structure of Buffett Partnership Ltd.?
Not exactly what you see in modern hedge funds. Buffett charged a 0% management fee, meaning he earned nothing unless he generated absolute performance. Instead, he took a 25% performance allocation strictly above a 6% cumulative hurdle rate. Crucially, any year of underperformance resulted in a deficit that was carried forward; he had to entirely clear past underperformance before receiving future performance fees.
Did the Buffett Partnership use leverage to boost its returns?
Yes. Contrary to popular retail folklore that Buffett always bought stocks with pure cash, BPL routinely used structural bank credit lines. However, he kept this leverage tightly bounded, capping his borrowing at 25% of the partnership’s net asset value and deploying it exclusively into market-neutral “Workouts” (merger arbitrage) to limit overall portfolio volatility.
What is the minimum portfolio size needed to replicate the BPL strategy today?
It depends on your setup, but a direct manual replication is practically impossible for retail investors regardless of capital size. While you can find micro-caps, a key driver of BPL’s returns was corporate activism—buying enough float to force board representation, gut inventories, or execute asset spinoffs like Sanborn Map. Passive retail accounts cannot execute these boardroom catalysts.
How can a modern DIY investor capture the essence of the Buffett Partnership returns mechanism?
Automate the underlying factor exposures. Modern quantitative research shows that BPL’s extraordinary performance can be replicated systematically by capturing the Value, Size, and Low-Beta premiums. Instead of manually buying risky nano-caps, modern investors can use low-cost, diversified small-cap value or value-characteristics funds to build an equivalent factor sleeve.
How did BPL completely avoid negative calendar years during its operational lifespan?
The secret weapon was the event-driven “Workouts” sleeve. When the broader equity market was expensive or falling, Buffett shifted capital into announced mergers, liquidations, and spin-offs. Because the returns on these arbitrage positions depend on corporate timelines and legal contracts rather than index multiples, they provided a powerful absolute-return buffer during market drawdowns.
Why is tracking error considered the true psychological price of replicating Buffett’s early returns?
Because you have to tolerate looking completely wrong in the short term. In 1958, for instance, BPL generated an extraordinary 32.2% net return, yet it suffered a brutal -11.1% underperformance gap against a roaring 43.3% S&P 500 total return index. Without restricted annual liquidity gates to lock capital down, most modern investors would panic and abandon the strategy during those deep-value dead zones.
This article is also available in Spanish. [Leé la versión en castellano: Dentro de la máquina de BPL: Por qué los rendimientos de la sociedad de Warren Buffett fueron tan extraordinarios]