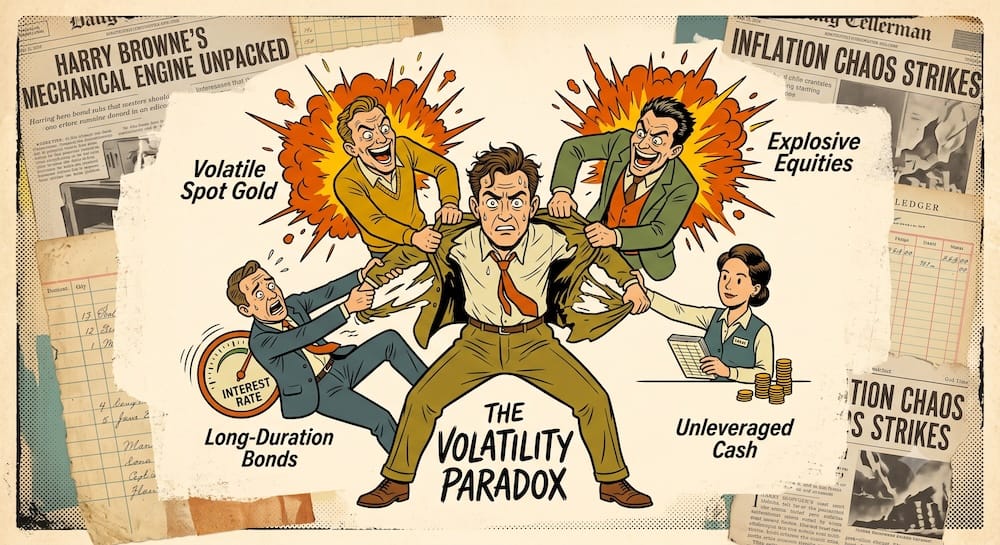
Trend-following isn’t about predicting the future. It’s about surviving the present until the math pays off. Bill Dunn, the founder of Dunn Capital Management, basically wrote the manual on this. I used to think managed futures was an impenetrable black box of quantitative noise. I was wrong. Dunn’s approach is actually deeply logical—it relies on systematic rules, aggressive risk management, and a stubborn refusal to intervene when the algorithms do their job. To my eyes, understanding his mechanics completely shifts how you view capital efficiency and absolute return strategies.
Bill Dunn: A Pioneer in Trend-Following and Managed Futures
Bill Dunn built Dunn Capital Management on the premise that human intuition is an active liability in financial markets. Instead of guessing, his systems wait for mathematical confirmation of a trend across global futures markets and ride it. It sounds easy in a clean backtest. It is brutally difficult in real life. When your trend-following sleeve is grinding sideways while the S&P 500 is ripping higher for three consecutive years, the tracking error pain is real. Yikes. But that’s exactly why systematic trading works—it forces you to stay in the trade when every behavioral instinct screams at you to bail.

Understanding Dunn Capital Management and Its Significance in Systematic Trading
Dunn Capital Management operates as a pure quantitative shop. They specialize in trend-following, utilizing sophisticated volatility-adjusted algorithms to size positions across commodities, currencies, and fixed income. By completely removing discretionary emotional overrides and relying strictly on code, Dunn Capital carved out a permanent space in the managed futures arena. The goal isn’t just to catch a trend; it’s to survive the chaotic mean-reverting chop without bleeding out your capital.
The primary source of truth here is not a quote meme about discipline; it is the program architecture. DUNN materials describe WMA as a 100% systematic, medium-to-long-term trend-following program that can go long or short across futures markets. That matters because the edge is not a manager squinting at a chart. The edge is repeated, rules-based exposure to persistent price trends, with risk sized so one hot contract does not quietly become the entire portfolio.
The useful move is to break down the actual mechanics of his strategies, not just the marketing brochures. The realization that a fund’s marketing doesn’t match what you find in the prospectus is a painful lesson many DIY investors learn the hard way. I wonder if most people actually look at the average true range (ATR) position sizing logic Dunn employs, or the way the WMA fee structure changes by share class. In the May 2024 UCITS factsheet, some institutional pooled classes list a 0.00% management fee, while other classes show 0.10% or 0.60%; the performance fee is listed at 25.00%. That is not automatically cheap. It simply moves the question from “is the headline fee low?” to “does the return stream clear its fee hurdle and its behavioral hurdle?” Different animal. Whether you are building your own multi-asset portfolio or evaluating a CTA fund, dissecting his risk controls provides a masterclass in behavioral discipline.
Who is Bill Dunn?
Background and Early Life of Bill Dunn
Academia loves clean models; markets are messy. Bill Dunn, who passed away in late March 2025 at the age of 90, started with a foundation in engineering physics and eventually earned a Ph.D. in theoretical physics from Northwestern University. That detail matters because Dunn was not selling vibes. He was importing scientific habits into futures markets: define the rule, test the rule, size the risk, and then stop arguing with the signal. But he quickly realized that theoretical physics doesn’t easily map to human panic. His early fascination with complex systems gave him the analytical scaffolding required to look past daily market noise. He didn’t want to rely on corporate earnings calls or macroeconomic guesswork. He wanted raw, unadulterated price data.
His Move from Academia to Becoming a Pioneer in Trend-Following
The transition from academic theory to live execution is where most quants fail. It’s the implementation gap between a clean, friction-free backtest and the lived experience of execution. Slippage, margin requirements, and overnight limit-up moves destroy fragile models. Dunn shifted his focus entirely to robust quantitative analysis, studying market behaviors and trading strategies that could withstand real-world friction. This practical grounding allowed him to pioneer trend-following strategies that leverage pure price momentum rather than subjective forecasting.
Key Achievements, Including the Founding of Dunn Capital Management
- Founding of Dunn Capital Management: While legacy marketing sometimes points to 2006 as a structural pivot, Bill Dunn actually founded the firm in 1974. He built systems designed to act, not think, decades before algorithmic trading became a Wall Street buzzword.
- Consistent Non-Correlated Performance: Under Dunn’s framework, the firm has delivered an equity curve that acts as true crisis alpha, often outperforming traditional 60/40 benchmarks in the managed futures space specifically when equities draw down.
- Transparency in Mechanics: Dunn consistently shared the brutal realities of trend-following, making it clear that periods of severe drawdown are a mathematical certainty, not an error.
- Institutional Stamina: Bill Dunn proved that surviving the “volatility tax” over decades requires an iron stomach and a total surrender to the algorithm, earning him deep respect from fellow quant practitioners before Martin Bergin eventually became the public operating face of the next era; managed-futures database materials describe him as leading the firm since 2007.
The Development of Dunn Capital Management
Overview of Dunn Capital’s Founding and Its Growth in the Managed Futures Industry
Bill Dunn established his firm with a singular operational mandate: capture outlier trends across deeply liquid global futures markets. From its inception, Dunn Capital avoided the trap of narrative investing. The WMA program itself began trading in November 1984, while Dunn materials describe the underlying trend-following algorithm as originating in 1974. That timeline is useful because it separates the permanent idea from the modern packaging: the wrapper can change, the distribution channel can change, and the investor base can change, but the core bet is still systematic obedience to price trends. They built robust, adaptive trading systems designed to identify momentum across dozens of uncorrelated asset classes simultaneously. This expansion into cross-asset momentum allowed the firm to scale its client base without turning the strategy into a narrative-driven macro shop. CTA database materials have listed Dunn’s WMA program around the billion-dollar-plus client-asset range, while the May 2024 UCITS factsheet listed Fund AUM at $504 million and Strategy AUM at $1.33 billion. To my eyes, the exact AUM number is less important than the capacity lesson: systematic futures can scale only if liquidity, margin use, market breadth, and execution discipline all survive the growth.
How Dunn’s Commitment to Systematic Trading and Discipline Shaped the Firm’s Success
The behavioral itch to tinker is what ruins long-term compounding. We all feel it. When a strategy underperforms for 18 months, the urge to manually override the system is overwhelming. Dunn Capital’s survival is rooted in an absolute refusal to intervene. By adhering exclusively to predefined trading rules, they strip out the cognitive bias that destroys discretionary managers. This mechanical coldness is exactly what institutional allocators are paying for.
Key Milestones and Performance Highlights of Dunn Capital Management
- 1974: Establishment of Dunn Capital Management, marking the beginning of a new era in systematic trend-following.
- Post-2008 period: Showcased the structural advantage of long-volatility characteristics by navigating a difficult environment where directional opportunities arrived unevenly and investor patience mattered as much as model design.
- 2007 and after: Managed-futures database materials describe Martin Bergin as leading the firm, ensuring the quantitative legacy and strict rules-based mandate continued beyond Dunn’s founder era.
- 2022: Captured major directional moves during the global inflation shock, a period when many trend-following programs benefited from persistent moves in rates, commodities, currencies, and equity index futures while traditional stock-bond diversification struggled.
- Modern Era: Maintained its disciplined mandate despite the massive draw of passive indexing, reinforcing its role as a leader in the managed futures industry.

Core Principles of Bill Dunn’s Trading Strategy
Bill Dunn’s strategy rests on a framework of absolute mechanical obedience. It is an architecture designed to survive extreme left-tail events by mathematically cutting risk when volatility expands.
Trend Following: Emphasis on Identifying and Riding Long-Term Market Trends
Understanding Trend Following Mechanics: Trend following isn’t about calling tops or bottoms. It is a reactive strategy that seeks to capitalize on sustained market movements. The model buys what is going up and sells what is going down. The math is simple, the execution is torturous.
Key Components of Dunn’s Technical Approach:
- Breakout Identification: Utilizes extended lookback periods (often 50 to 200 days) to confirm that a price breakout is statistically significant, not just intraday noise.
- Asymmetric Exits: The system will cut a losing trade rapidly, but will give a winning trade massive breathing room, often trailing a stop-loss loosely to avoid being shaken out of a multi-month trend.
- Cross-Asset Application: The exact same moving average crossover logic applied to copper is applied to the Japanese Yen. The system doesn’t care about the asset’s underlying fundamentals.
Example: When the 100-day moving average of a commodity crosses above its 200-day, Dunn’s system goes long. It will sit in that trade, enduring 5% or 10% pullbacks, until the trend explicitly breaks structure. The math dictates the hold.
Portfolio note: The cleaner lesson is not to anticipate every macroeconomic shift. A Dunn-style framework lets price action confirm the move first, then uses wide, volatility-aware exits so ordinary daily chop does not eject the model from the macro trend too early.
Systematic Trading: The Importance of Removing Emotions and Relying on Data-Driven Systems
The Reality of Systematic Execution: Systematic trading means your opinion doesn’t matter. You follow the code. Period. This is where most DIY investors fail; the frustration of rebalancing friction in a multi-fund portfolio often causes people to abandon the math just when it’s about to pay off.
Key Elements of Execution Logic:
- Algorithmic Precision: Orders are routed based on volatility triggers. If ATR spikes, the system automatically deleverages the position to keep the target risk constant.
- Data-Driven Sizing: Relying on quantitative data and statistical analysis to inform trading strategies ensures that a high-volatility asset doesn’t dominate the portfolio’s total risk budget.
- Relentless Automation: Systems run continuously, ensuring execution happens at the open or close without human hesitation or the temptation to “wait for a better price.”
Example: A systematic engine sees gold drop 4% in a day. A human panics and sells. The system calculates that the 4% drop is still within the normal 2-standard-deviation range for gold’s current volatility, and it holds the position. Cold, unfeeling math.
Portfolio note: The hard part of a systematic model is accepting that a newspaper headline is not part of the rule set. Once discretionary overrides enter the process, the live strategy is no longer the same animal as the backtest.
Risk Management: Focus on Strict Risk Controls, Including Position Sizing and Stop-Loss Strategies
The Math of Survival: Risk management is the only thing you can actually control. Returns are dictated by the market. Dunn’s approach treats risk as a budget. When an asset gets wildly volatile, the position size must shrink to maintain the budget. They historically managed this through an Adaptive Risk Profile (ARP). Dunn’s own program materials describe WMA monthly VaR at the 99% confidence level as expected to range roughly from 22% to 8%, with an average monthly VaR near 15%. That is a more nuanced framing than the old one-line version. It is not a magic risk-off switch. It is a gradual risk-budgeting mechanism that changes exposure as the trading environment changes.
Mechanical Risk Constraints:
- Volatility-Targeting Sizing: The model does not treat $10,000 of oil and $10,000 of bonds as equivalent risk. It sizes oil and bonds to represent roughly the same amount of daily price risk.
- Hard Stop-Loss Orders: The exit rule is determined the second the trade is entered. The final fill can still be ugly, but the decision rule is not negotiable.
- Sector Risk Caps: Even if all grains are trending up, the system caps the total exposure to the agricultural sector to prevent a single weather event from blowing up the fund.
Example: Dunn allocates capital inversely proportional to an asset’s Average True Range (ATR). If the ATR of crude oil doubles, the system automatically cuts the position size in half. Risk remains constant.
Portfolio note: Dollar weights can lie. A 10% allocation to a 3x leveraged ETF carries a very different risk footprint than a 10% allocation to short-term Treasuries, so volatility-aware sizing is the more honest language of risk.
Diversification: How Dunn Diversified Across Markets and Timeframes to Manage Risk and Enhance Returns
The Architecture of Non-Correlation: Diversification involves spreading risk so thin across uncorrelated assets that a localized crash barely registers on the master ledger.
Structural Diversification Elements:
- Deep Asset Class Breadth: Trading a broad basket of liquid futures markets across rates, equities, FX, energies, metals, agricultural contracts, meats, and soft commodities. Dunn marketing materials have described WMA as identifying trends across 50+ futures contracts and analysing 100+ quantitative models, which is exactly the kind of breadth a long-term trend follower needs if the next trend refuses to appear where last decade’s trend appeared.
- Geographic Independence: Trading European bond futures alongside Japanese equities and US natural gas.
- Multiple Timeframe Models: Running a 20-day breakout model right alongside a 200-day moving average model. One captures short bursts, the other captures macro regime shifts.
Example: When US equities are in a grinding bear market, the system might be simultaneously short the S&P 500, long the US Dollar, and long oil and gold. The positive drift of the commodity trends offsets the equity drag.
Portfolio note: True diversification requires exposures that can behave independently during a crisis. If every sleeve falls in line behind the S&P 500 during stress, the portfolio may simply own different flavours of equity beta wearing different costumes.
Continuous Improvement: Dunn’s Commitment to Refining and Improving Trading Systems and Strategies
The Reality of Decay: Alpha decays. Strategies that worked perfectly in the 1980s get arbitraged away by faster computers today. The continuous improvement of trading systems and strategies is a daily requirement.
Evolutionary Mechanics:
- Slippage Analysis: Constantly monitoring execution costs. The bid-ask spread on thinly traded ETFs or alternative assets can completely destroy the theoretical CAGR of a model.
- Regime Filters: Researching new strategies that act as filters, turning off trend models when the market enters a mathematically definable choppy regime.
- Execution Speed: Upgrading the routing architecture to prevent being front-run by high-frequency market makers.
Example: If a specific agricultural contract repeatedly triggers false breakouts leading to whipsaw losses, the research team has to mathematically analyze if the market microstructure has changed, and potentially adjust the lookback period.
Portfolio note: Backtests are historical fiction with clean fills. Live slippage, commissions, futures rolls, tax drag, and fund-wrapper costs are where the romance gets beaten up. That does not kill the concept, but it absolutely changes the net result an investor actually lives with.

Famous Trades and Market Calls
Analysis of Some of Dunn’s Most Notable Trades and Market Predictions
To be clear, systematic trend followers do not make “market predictions.” They react. The most legendary trades from Dunn Capital weren’t born from a macro thesis; they were the result of algorithms catching a breakout and refusing to let go, even when the financial media called it a bubble.
Notable Mechanical Captures:
- The 2008 Crisis Pattern: While discretionary managers were trying to catch falling knives in equities, many systematic trend followers benefited from being short equity index futures and positioned for powerful moves in rates and currencies. The exact positioning varies by model and program, but the broader crisis-alpha lesson is real: when prices trend hard, rule-following can look suddenly brilliant after years of looking unnecessary.
- Commodity Supercycles: Algorithms mechanically pyramiding into trending energies and metals without caring about the “peak oil” narrative. The math just saw higher highs and added leverage.
- Currency Realignment: Identifying multi-year structural shifts in the Yen or Euro. This approach allowed him to leverage deep liquidity in the FX markets to capture massive carry and momentum simultaneously.
- The 2022 Inflation Shock: As stocks and bonds sold off together, many trend-following systems found cleaner signals in long commodities, long U.S. dollar exposure, and short fixed-income futures. The point is not that every CTA held the same book. The point is that persistent macro moves gave trend models a regime where their annoying patience finally had something to harvest.
How His Trend-Following Approach Led to Significant Successes
Dunn’s edge is behavioral arbitrage. He profits from the fact that human beings take profits too early and hold onto losers too long. By inverting human nature through code, he captures the fat tails of market distributions.
The Mechanics of the Edge:
- Infinite Patience: The system will happily take 7 small losses in a row, knowing the 8th trade might yield a 300% return that pays for all previous paper cuts.
- Zero Narrative Bias: The code doesn’t read the Fed minutes. It strictly evaluates price, volume, and volatility.
- Dynamic Scaling: It adapts trading strategies to align with evolving market conditions, pushing more chips to the center of the table as the trend proves itself.
- Unemotional Execution: When a massive gap-down occurs, the system attempts to exit according to pre-programmed rules, accepting that the market still gets a vote through gaps, spreads, and liquidity. No hoping for a bounce.
Example: During a prolonged commodity rally, humans feel the asset is “too expensive” and short it. Dunn’s system buys the all-time high and rides it for another 40%, entirely devoid of valuation bias.
Portfolio note: Momentum and valuation speak different languages. A trend model does not need an asset to look cheap; it needs the price behaviour to confirm that other participants are still being forced in the same direction.
Lessons Learned from These Trades and Their Relevance Today
1. The Math Demands Obedience: The process cannot run a systematic model only when it feels good. The temptation to abandon a strategy after a 20% drawdown is immense, but doing so guarantees you miss the recovery curve.
2. Friction is the Enemy: Live execution is brutal. High turnover means massive tax drag and slippage. If you implement this in a taxable account, the government is your biggest source of drawdown.
3. Crisis Alpha Exists: Trend following is one of the few historically verifiable ways to generate positive returns when equity correlations go to 1.0 during a liquidity crisis.
4. You Must Survive the Chops: The years between the massive trends are agonizing sideways grinds. Capital efficiency and tight stops are the only way to keep your powder dry for the next major dislocation.
Portfolio note: The drawdowns of successful traders teach more than their peaks. The lived experience of holding these strategies is mostly boredom, whipsaw, regret, and then occasional bursts of extraordinary payoff.
Risk Management Techniques
Detailed Look at Dunn’s Approach to Managing Risk in Trend-Following Trading
Risk management is the absolute core of any CTA. The specific way leverage compounds anxiety, not just returns, breaks amateur traders. Dunn controls this through mathematical volatility parity.
The Core Infrastructure:
- Target Volatility Sizing: When the portfolio targets a 15% annualized volatility, the system continuously adjusts nominal exposure up or down to hit that precise risk target, regardless of how “bullish” the market looks.
- Margin-to-Equity Ratios: Keeping strict limits on how much cash is locked up in margin requirements, ensuring massive cash reserves are always earning the risk-free rate.
- Trailing Volatility Stops: The stop-loss isn’t a fixed dollar amount; it’s a multiple of the asset’s ATR, meaning the stop widens in volatile markets and tightens in quiet ones.
- Sector Correlation Matrix: The system continuously calculates cross-correlations. If bonds and equities start moving perfectly together, the system recognizes the concentrated risk and deleverages both.
Use of Stop-Loss Orders, Position Sizing, and Trading Discipline
The Mechanics of the Stop-Loss:
A stop-loss in a systematic fund is a mathematical necessity, not a suggestion. It defines the point where the trade thesis is invalidated, while still leaving room for real-world slippage, gaps, and ugly fills.
Example: The algorithm buys cocoa futures. It calculates the 20-day ATR is $50. The stop is placed 3 ATRs below the entry price. If price hits that level, the position is dumped immediately at the market price, absorbing whatever bid-ask slippage is necessary to get out.
Inverse Volatility Position Sizing:
This is the secret sauce. The model risks the same fraction of equity on a quiet bond trade as you do on a wild natural gas trade. Since natural gas moves wildly, the model buys far fewer contracts.
Example: To risk 1% of the portfolio on the S&P 500, a model might need 5 contracts. To risk 1% on highly volatile crude oil, you might only buy 1 contract. The risk footprint is identical.
Execution Discipline:
The process cannot selectively apply the rules. When the system says buy Lean Hogs, the model buys Lean Hogs, even if you know nothing about agriculture. The discipline is executing the ugly trades.
Example: A trader can suffer four consecutive whipsaws in the Euro. The system signals a fifth buy. Behavioral instinct screams “no.” Discipline requires pressing the button anyway.
Portfolio note: To my eyes, volatility-based sizing is one of the cleanest upgrades a DIY investor can study. It prevents the loudest, wildest asset from quietly hijacking the entire portfolio’s risk profile.
Balancing Risk and Reward in a Volatile Market Environment
When volatility expands, the math changes. Dunn’s systems don’t panic; they systematically shrink their footprint.
- Deleveraging During Shocks: As the VIX spikes, the ATR of all assets expands. The system mathematically reduces nominal exposure across the board, pulling capital out of the fire automatically.
- Asymmetric Payoff Targeting: The strategy accepts a low win rate (often 35-40%) because the average winning trade is 3 to 4 times larger than the average losing trade.
- Cash Drag as a Feature: In managed futures, you only use 10-20% of your capital for margin. The other 80% sits in T-bills earning yield, providing a massive structural floor to the portfolio.
Example: In March 2020, as equity volatility exploded, systematic trend followers cut equity exposure rapidly due to ATR expansion, but rode the massive short-end rate trends driven by central bank cuts.
Portfolio note: A strategy that needs an 80% win rate to survive may be structurally fragile. The more interesting trend-following architecture is the one where many small losses can be funded by a smaller number of large asymmetric winners.
The Role of Psychology in Trading
Dunn’s Views on the Psychological Challenges of Systematic Trading
The specific psychological discomfort of holding a strategy through a 3-year underperformance window is the hardest thing in finance. You feel stupid. Your friends holding index funds think you’re crazy. Dunn built his systems specifically because he knew human beings cannot biologically handle this pain without outsourcing the psychological burden to an algorithm.
To my eyes, the real question is how you frame the cost. Everyone loves to talk about the zero-management-fee share-class idea associated with parts of Dunn’s WMA structure, but they can miss the performance-fee math and the “behavioral fee.” If a model looks inexpensive on the management-fee line but the investor abandons it during a deep drawdown, the spreadsheet cost was low and the lived cost was brutal.
The May 2024 UCITS factsheet gives a clean pain-before-payoff snapshot: DUNN WMA Institutional UCITS showed -20.21% in 2012 and +26.07% in 2022. That is the Dunn lesson in miniature. The same machine can look broken before it looks brilliant. Not because the manager suddenly became smarter, but because the market regime finally gave the trend engine something to chew on.
The Behavioral Landmines:
- Tracking Error Regret: Watching your carefully constructed multi-asset trend portfolio lose 2% while the Nasdaq goes up 30%. It breaks people.
- The Whipsaw Fatigue: Getting stopped out of a trade at a loss, only to watch the asset reverse and trend higher without you. Doing this five times in a row creates extreme hesitation.
- Loss Aversion in Drawdowns: The terror of a 20% drawdown makes investors abandon the strategy exactly at the moment expected forward returns are highest.
- The Illusion of Control: The false belief that reading financial news gives you an edge over a purely mathematical price engine.
Techniques for Maintaining Discipline and Emotional Control
The process cannot white-knuckle your way through systematic trading. The process needs structural walls to prevent self-sabotage.
- Total Automation: If you use an API to route your trades, you never have to manually click “buy” when you are scared. The code does it.
- Process Over Outcome: The process judges your success not by the P&L of the trade, but by whether or not you perfectly executed the algorithm’s mandate.
- Embracing the Base Rates: Understanding deeply that a 15-20% drawdown is a normal, mathematically expected feature of the strategy, not a bug.
- Information Diet: Dunn didn’t sit around watching CNBC. If your inputs are strictly price and volatility, listening to talking heads is active portfolio contamination.
Example: When a CTA fund enters a severe drawdown, the manager doesn’t rewrite the code. They verify the execution engine is working, check the margin limits, and wait. The math eventually normalizes.
Portfolio note: Daily balance-checking is often a sizing signal. If the P&L swings are driving the emotional bus, the exposure may be too large for the person who has to hold it.
The Importance of Mental Resilience and Adaptability in Executing Trades Effectively
Mental resilience isn’t about ignoring pain; it’s about accepting it as the cost of admission for non-correlated returns.
The Reality of Holding the Bag:
- Accepting the Distribution: You don’t know which 20% of your trades will generate 100% of your profits. Therefore, the model has to take every single trade the system generates.
- Ignoring the Consensus: Trend following often requires buying at all-time highs when the valuation looks ridiculous. The model has to be comfortable looking foolish in the short term.
- Systematic Faith: The model has to trust the thousands of hours of out-of-sample backtesting you did before you deployed the capital.
- Capital Preservation Above All: Resilience comes from knowing your sizing rules and stop logic are designed to keep any single trade from becoming existential. Good sizing lowers ruin risk. It does not make gaps, liquidity shocks, margin rules, broker problems, or model error disappear.
Example: After a punishing 18-month drawdown in commodities, the system flashes a massive buy signal in crude oil right as the news predicts a recession. The resilient trader executes the buy, catching a 60% rally, while the discretionary trader sits in cash.
Portfolio note: Rules matter most when they feel worst. Changing the model in the middle of a drawdown may feel like intelligence, but very often it is just panic wearing a lab coat.
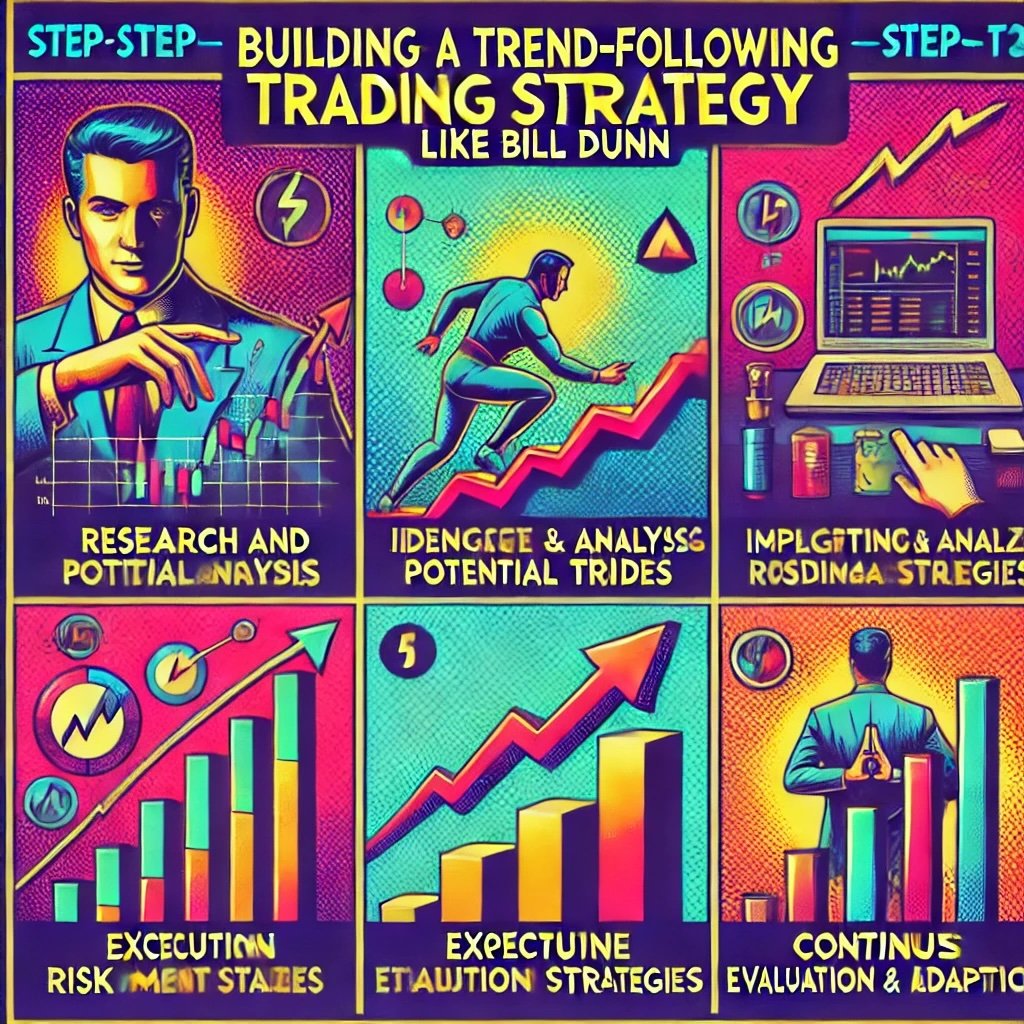
Building a Trend-Following Strategy Like Bill Dunn
Step-by-Step Guide to Developing a Trend-Following Strategy Inspired by Dunn
A DIY investor studying a Dunn-style model has to accept that strategy execution fatigue will be the biggest enemy. You can’t just buy a moving average and call it a day. The framework needs a robust architecture.
1. Define the Investment Universe
- Liquid Markets Only: The process cannot run these models on penny stocks or illiquid alt-coins. The process needs deep, liquid futures or highly traded ETFs to avoid massive bid-ask slippage.
- Maximum Non-Correlation: Select distinct asset classes: Equities, Treasuries, Gold, Broad Commodities, and Currencies. If you only trade 5 tech stocks, you aren’t diversified.
- Data Integrity: Ensure your historical price data includes dividend adjustments and market sentiment and momentum splits, otherwise your backtest will hallucinate returns.
2. Establish the Quantitative Logic
- Dual Lookback Triggers: Don’t rely on one signal. Require a fast moving average (e.g., 50-day) to cross a slow moving average (e.g., 200-day), AND require the price to hit a 60-day high.
- Trend Filtering: Implement a macro filter. If the asset is below its 200-day moving average, the system explicitly forbids taking any long breakout trades, regardless of short-term momentum.
- Volatility Normalization: Use a 20-day Average True Range (ATR) to measure current market speed. This number is required for step 3.
3. The Position Sizing Algorithm
- Risk Budgeting: Decide you will never risk more than 1% of total account equity on a single trade.
- The ATR Division: Calculate the distance from entry to your stop loss. Divide your 1% dollar risk by that distance to get the exact number of shares/contracts to buy. This capital efficiency mechanism is non-negotiable.
- Portfolio Gross Exposure Limits: Cap total portfolio margin or exposure so a massive cross-asset crash doesn’t wipe you out.
4. Mechanical Execution Rules
- Entry Mechanics: Only enter trades on the close of the daily candle or the open of the next day. No intraday emotional entries.
- Trailing the Stop: As the trade moves in your favor, ratcheting the stop-loss up based on a multiple of ATR. A disciplined model does not move a stop-loss down to “give it room.”
- Rolling Contracts: If trading futures, mechanically roll to the next month before liquidity dries up in the front month.
5. The Out-of-Sample Test
- Avoid Curve Fitting: If a model is optimized your moving average lengths to perfectly catch the 2008 crash, your model will fail going forward. Use robust, generic parameters (like 50/200 MA).
- Stress Testing: Subject your model to a synthetic 1987 Black Monday gap-down. Does the portfolio survive?
- Implementation Check: Run the strategy with live capital at 1/10th the size for 6 months to experience the psychological weight of execution.
Tips for Refining and Adapting the Strategy Over Time
- Audit Your Slippage: Compare your paper backtest returns against your actual broker statements. The delta between the two is your execution friction. Fix it.
- Respect the Drawdown Base Rate: If a backtest shows a max historical drawdown of 25%, expect a 35% drawdown in live trading. Prepare your sizing accordingly.
- Avoid Adding Complexity for Comfort: Adding 15 different indicators doesn’t increase returns; it just increases the risk of overfitting the past. Keep the logic brutally simple.
- Stay Systematic: The moment a trade is manually exited because Jim Cramer yelled about it, the math has been broken and the process has to start over.
Portfolio note: The edge usually is not the exact moving-average length. The edge is the discipline to size by volatility, take the uncomfortable trades, and avoid turning a rules-based process into a mood-based hobby.
Dunn Portability Matrix: What Travels From The Institutional Machine To A DIY Framework
This is the portability layer I care about most. Dunn’s institutional machine is not a weekend spreadsheet. The useful question is what a modern DIY investor can absorb from the architecture without pretending to be a multi-decade CTA with futures infrastructure, institutional execution, and a whole research stack behind the curtain.
| Institutional Feature | What Dunn Can Do | What DIY Investors Can Absorb | What Does Not Travel Cleanly |
|---|---|---|---|
| Global futures breadth | DUNN materials describe the UCITS strategy as trading 60+ markets across equities, fixed income, foreign exchange, and commodities. | Absorb the principle: diversification means independent return engines, not ten versions of equity beta wearing different hats. | A handful of ETFs does not recreate institutional futures breadth, contract selection, roll management, or market access. |
| Long and short trend exposure | The program can participate in rising and falling trends across liquid futures markets. | Absorb the idea that crisis diversification often needs exposure that can benefit from falling prices, falling rates, currency moves, or commodity shocks. | Short exposure, leverage, margin, and daily execution rules are operationally harder than reading a moving-average chart. |
| Volatility-based sizing | Position risk can be scaled so a wild market does not accidentally dominate the book. | Absorb this aggressively. Risk budgeting may be more portable than the exact entry signal. | Volatility estimates can be stale, fills can be ugly, and resizing after a volatility spike can feel like selling after pain. |
| Performance-fee-heavy structure | Some institutional pooled share classes list no management fee, while the UCITS factsheet lists a 25.00% performance fee and other classes with management fees. | Absorb the incentive-alignment question: what hurdle must the strategy clear after fees, friction, and behavior? | Zero management fee does not mean zero cost. Lumpy performance fees can still bite exactly when the strategy finally pays off. |
| Tax and operations | Institutional CTAs can live with futures rolls, derivatives reporting, operational controls, and specialist infrastructure. | Absorb the humility. The wrapper, account type, reporting burden, and tax treatment are part of the strategy. | DIY replication can run into K-1 reporting, cross-border access limits, broker constraints, contract sizing problems, and tax friction that the clean backtest never warned you about. |
Challenges of Trend-Following Trading
Potential Pitfalls and Difficulties in Adopting a Trend-Following Approach
Let’s be brutally honest: trend following is an agonizing way to make money. The execution reality involves constant paper cuts. Understanding these structural pain points is the only way you will survive the inevitable trader’s resilience and risk management stress tests.
The Mechanical Nightmares:
- The Whipsaw Grind: Buying a breakout, watching it fail, getting stopped out, and watching it break out again. This can happen 6 times in a single asset during a sideways regime.
- The Yield Drag: In a multi-manager portfolio, if the CTA sleeve is flat for 4 years, the management fees and underlying trading friction erode your total return.
- Lagging Entries: By definition, you are late to the party. A 200-day moving average cross means you missed the first 30% of the absolute bottom.
- The “Curve-Fit” Illusion: Retail quants often build models that look like a staircase to heaven on historical data, only to watch them instantly break in live out-of-sample markets.
- Cash Flow Misery: Unlike dividend investing, trend following produces extremely lumpy returns. You might make all of your decade’s profit in a single 14-month burst.
How to Overcome Common Challenges
1. Managing the Drawdown Math
- De-Leverage the Portfolio: If the historical 30% drawdowns are too painful, you simply scale the target volatility down from 15% to 8%. You sacrifice absolute return for behavioral survival.
- Cross-Asset Hedging: Ensure your trend system runs on enough distinct assets that a localized crash in equities is buffered by a simultaneous long position in bonds or the Dollar.
- Expect the Pain: Write the historical max drawdown on a post-it note and stick it to your monitor. When you hit it, remember it’s normal.
2. Navigating the Sideways Whipsaw
- Accept the Win Rate: The point is not to keep trying to increase your win rate. Accept that 60% of your trades will be small losses. The math relies on the magnitude of the winners, not the frequency.
- Use Wider Stops: If you are constantly stopped out by daily noise, your stops are too tight relative to the asset’s ATR. Widen the stop and reduce the position size to maintain the dollar risk.
- Regime Filters: Use a secondary indicator (like ADX) to confirm that a market is actually trending before taking the moving average crossover signal.
3. Addressing the Lagging Entry
- Blend the Speeds: Run a 20-day breakout model alongside the 200-day model. The fast model gets you in early (but suffers more whipsaws), while the slow model catches the macro move.
- Embrace the Lag: Accept that you will never buy the exact bottom or sell the exact top. Trend following is about capturing the meat in the middle.
4. Preventing the Overfit Trap
- Parameter Stability: If changing your moving average from 50 to 52 completely destroys the backtest, your model is overfit and broken.
- Walk-Forward Testing: Optimize the model on data from 2000-2010, then lock the rules and test it on blind data from 2011-2023. If it fails, throw it out.
- Friction Inoculation: A conservative backtest deducts 2x the expected slippage and commission from every trade in your backtest.
5. Surviving the Behavioral Gauntlet
- Automate the Routing: Use broker APIs. Take the execution out of your hands completely.
- Reduce Screen Noise: Trend following operates on daily or weekly timeframes. Staring at a 5-minute chart of crude oil can induce panic and ruin the execution.
- Size for Sleep: If the process feels emotionally unbearable, your positions are too large. Cut your total exposure in half until the anxiety disappears.
Portfolio note: A trend strategy is not automatically broken because it is in a drawdown. Trend following is structurally designed to bleed through chop and earn its keep during sustained dislocations. That behavioural trade-off is the whole ticket price.
The Importance of Adaptability and Continuous Improvement in Trading Systems
Markets evolve. The microstructure of the S&P 500 today, dominated by zero-day options and algorithmic market makers, is fundamentally different than it was in 1995. The process cannot run a static model and walk away.
The Evolution of Execution:
- Monitoring Strategy Decay: Tracking the equity curve of your model against its historical baseline. If it underperforms its expected boundaries for 24 months, the market microstructure may have shifted.
- Adding New Markets: As new liquid futures markets emerge (e.g., carbon credits, crypto futures), systematic models integrate them to expand the diversification footprint.
- Execution Upgrades: Continuously refining how orders are routed to minimize the bid-ask spread impact, which is crucial for high-turnover models.
- Tax-Aware Logic: For retail traders, implementing logic that attempts to hold winners for 366 days to secure long-term capital gains, drastically altering the real-world net return. Here is where the math gets uncomfortable: direct futures trading often involves Section 1256 contracts, which have a blended 60/40 tax treatment in the US, but if you access these via certain partnership structures, you’re dealing with K-1 tax forms that delay your filing and complicate your life.
Example: When the VIX behaves differently due to the proliferation of short-volatility ETFs, a robust systematic fund doesn’t panic; it recalibrates the volatility sizing algorithm to account for the new baseline of market fragility.
Portfolio note: Adaptation is dangerous when it becomes emotional pain relief. The real question is whether the model is fixing a structural market shift or merely curve-fitting around the most recent drawdown.
How to Start Trading Like Bill Dunn
Practical Steps for Implementing Dunn’s Strategies in Your Own Trading
Translating Bill Dunn’s institutional infrastructure into a retail account is difficult, but not impossible. It requires stripping away the complexity and focusing strictly on capital efficiency and volatility-adjusted sizing. Here’s the blueprint for the DIY quant.
1. Build the Data Foundation
- Clean Data Sourcing: The process cannot use free, unadjusted price data. The process needs premium data that accounts for corporate actions and futures roll yields.
- Select Your Proxies: If you can’t trade futures due to margin constraints, build a universe of highly liquid, uncorrelated ETFs (e.g., SPY, TLT, GLD, DBC, UUP).
- Establish the Math: Build your spreadsheets or Python scripts to automatically calculate the 20-day ATR for every asset in your universe daily.
2. Enforce the Risk Budget
- The 1% Rule: Hardcode the rule that no single trade will ever risk more than 1% of total account equity from entry to the initial stop-loss.
- Dynamic Sizing Execution: Use the formula: (Account Value * 0.01) / (ATR * Multiplier) to determine exact share counts. Rounding up to buy a “clean” number of shares can quietly break the risk budget.
- Portfolio Stress Limits: Ensure that your total open risk across all positions never exceeds 10% to 15% of your equity.
3. Construct the Portfolio Architecture
- Mandatory Diversification: Force the system to scan across all quadrants: equities, rates, commodities, and currencies. If everything is crashing, the process needs the system to find the trend in the US Dollar.
- Sleeve Segregation: Treat your trend-following strategy as an independent sleeve in your broader portfolio. Don’t mix it with your buy-and-hold dividend stocks.
- Cash as a Position: Understand that when the system scales out of volatile assets, the resulting cash is an active, defensive position, not “dead money.”
4. Hardwire the Behavioral Defenses
- Pre-Trade Acceptance: Before the market opens, accept that the order will be placed exactly as the spreadsheet dictates. No hesitation.
- Ignore the P&L: Track your execution accuracy, not your daily dollar swings.
- Acknowledge the Friction: Factor the growth over short-term gains to ensure sustained investment returns against the reality of short-term capital gains tax. If trading in a taxable account, the gross return has to be large to justify the net.
5. Run the Strategy Cold
- The Monday Routine: Run the algorithms over the weekend. Set the limit orders and stop-losses on Sunday night. Walk away.
- Zero Discretion: If the model says buy a 10-year Treasury bond right after the Fed raises rates, the model buys it. The market knows things the Fed doesn’t.
- Quarterly Review: Only review the strategy’s macro performance every 90 days. Daily reviews invite tinkering, and tinkering destroys the math.
Resources for Learning More About Trend-Following and Systematic Trading Techniques
- Books:
- “Trend Following: Learn to Make Millions in Up or Down Markets” by Michael W. Covel
- “Market Wizards” by Jack D. Schwager
- “Quantitative Trading: How to Build Your Own Algorithmic Trading Business” by Ernest P. Chan
- Online Courses:
- Coursera’s Financial Engineering and Risk Management specialization
- Udemy’s Algorithmic Trading & Quantitative Analysis Using Python
- edX’s Introduction to Computational Finance and Financial Econometrics
- Professional Certifications:
- Chartered Financial Analyst (CFA)
- Chartered Market Technician (CMT)
- Immersion:
- Read the actual prospectuses and white papers published by AQR, AlphaSimplex, and Dunn Capital. The marketing is fluff; the footnotes are gold.
- Build the models yourself in Excel or Python. You will never trust a system until you write the logic from scratch.
Tools and Platforms to Support Trend-Following Trading Activities
- Quantitative Development:
- Python (Pandas/NumPy): The absolute baseline for backtesting without paying expensive monthly software fees.
- Amibroker: Extremely fast backtesting software specifically built for portfolio-level testing of technical rules.
- TradingView: Excellent for visual charting and basic Pine Script strategy backtesting, though limited for true portfolio-level execution.
- Execution Platforms:
- Interactive Brokers: The gold standard for retail quants. Access to global futures, incredibly low margin rates, and robust API routing.
- Thinkorswim by TD Ameritrade: Powerful charting and good for options, but less ideal for automated cross-asset futures routing.
- TradeStation: Built specifically for systematic traders to code and automate strategies directly into the broker.
- Portfolio Management Software:
- Portfolio Visualizer: Incredible free/cheap tool for asset class backtesting and correlation matrices.
- QuantConnect: Cloud-based algorithmic trading platform that connects directly to broker APIs for live execution.
Portfolio note: A live system deserves a backtest that includes realistic slippage and commission friction. The theoretical edge disappears very fast in the real world.

| Strategy / Concept | What It Promises | Implementation Friction | The Sponge Verdict |
|---|---|---|---|
| Pure Trend Following (WMA Style) | Crisis alpha and massive convexity during extended market dislocations (like 2008 or 2022). | Multi-year sideways chop. A 20-25% drawdown is mathematically expected and routinely happens between major macro trends. | Absorb, but only if you have the iron stomach to ignore it for three years while it underperforms the S&P 500. |
| 0% Management Fee / High Performance Fee | Absolute manager alignment. You only pay for new high-water mark profits, never for “sitting on assets.” | The “behavioral fee.” If the model buys it, suffer the 20% drawdown, and sell before it hits a new high, you ate the entire loss for zero benefit. | Absorb. The fee structure is incredibly fair, but it demands total investor discipline to actually benefit from it. |
| Volatility-Adjusted Position Sizing | Equalized risk distribution. Cocoa futures won’t blow up your portfolio just because they have a volatile week. | Requires daily data crunching and relentless rebalancing. Slippage eats into returns if traded in small accounts. | Mandatory Absorb. This is the single most important mechanical lesson retail investors can steal from institutional CTAs. |
| Direct Futures / Partnerships (K-1s) | Direct access to global non-correlated assets using deep leverage and minimal capital tie-up. | Tax nightmares. K-1 forms delay your tax filing, and high turnover destroys compounding in taxable accounts. | Expel the fantasy that tax plumbing is a footnote. For some investors, modern 1099-issuing ETF wrappers may be easier to live with than partnership-style reporting, but the wrapper trade-off deserves its own due diligence. |
Portfolio Reality Matrix: What To Absorb And What To Expel From A Dunn-Style Framework
This is the decision layer for me. Not “is Bill Dunn a legend?” Of course. The more useful question is which parts of the Dunn machine belong in a modern portfolio-construction conversation, and which parts become dangerous when copied without the institutional plumbing.
| Concept | What It Promises | Implementation Friction | The Sponge Verdict |
|---|---|---|---|
| Systematic trend following | Rules-based exposure to persistent price trends across rising and falling markets. | Long periods of whipsaw, tracking error, and looking foolish beside plain equity beta. | Absorb the discipline. Expel the fantasy that the ride will feel smooth. |
| Broad futures diversification | Access to commodities, currencies, rates, equity indexes, and other liquid markets that can trend independently. | Contract complexity, roll mechanics, margin rules, and uneven access for smaller accounts. | Absorb the multi-market logic. Expel the idea that a handful of ETFs perfectly recreates the institutional book. |
| Volatility-based position sizing | A cleaner risk budget where oil, bonds, currencies, and equities do not receive equal dollar risk by accident. | Requires reliable volatility estimates, disciplined resizing, and comfort with positions shrinking after volatility spikes. | Absorb aggressively as a portfolio concept. This is plumbing, not decoration. |
| Adaptive risk profile | Risk exposure can adjust as market conditions change instead of sitting at a fixed target forever. | Easy to misunderstand as discretionary market timing when it is really a gradual risk-budgeting process. | Absorb the humility. Expel the “risk-on/risk-off light switch” interpretation. |
| Performance-fee-heavy structure | Manager incentives can be tied more directly to performance rather than a fixed management-fee drag. | Performance fees can bite hard after lumpy return bursts, and headline “0% management fee” language can hide the real economic trade-off. | Absorb the incentive-alignment idea. Expel the assumption that zero management fee means zero cost. |
| DIY replication | A retail investor can study the principles: trend rules, volatility sizing, diversification, and execution discipline. | Institutional futures infrastructure does not magically appear inside a brokerage account; taxes, fills, slippage, contract sizing, and behaviour all matter. | Absorb the architecture. Expel the cosplay. |
Bill Dunn–Style Trend Following FAQ: Rules-Based CTAs, Risk Discipline, and How to Get Started
What makes Bill Dunn’s approach distinct in managed futures?
Bill Dunn’s style is “pure” systematic trend following: diversified global futures, simple rule sets (breakouts/moving-average filters), strict risk caps, and the resolve to hold winners and cut losers—without discretionary overrides.
How does a Dunn-style system find trends?
It scans many liquid futures (rates, FX, equity indices, energies, metals, ags) for price breakouts or moving-average alignment. When signals confirm across lookbacks, it enters with predefined stops and sizes positions by volatility.
Why so much diversification?
Trends rotate. Broad market coverage increases the chance that at least some contracts are trending (e.g., short bonds, long cocoa, short JPY, long copper), smoothing the equity curve relative to betting on one theme.
How are positions sized?
Volatility (e.g., ATR) normalizes risk so each trade risks a similar fraction of capital. As volatility rises, position size falls; as volatility drops, size can increase—keeping portfolio risk more stable.
What risk controls are typical?
Pre-trade risk limits, initial and trailing stops, per-market and per-sector caps, gross and net exposure limits, and portfolio-level drawdown brakes. No averaging down; losers are cut, not “managed.”
How does a system exit?
Losers hit hard stops; winners trail with rules (e.g., opposite breakout, moving-average cross, or volatility-adjusted stop). Exits are mechanical to avoid discretion creep.
What returns can a trend follower realistically expect?
Long-run positive expectancy with material volatility and deep, multi-month drawdowns. Payoffs tend to spike during sustained trends and crisis periods; flat or negative during choppy, mean-reverting regimes.
How does this help a traditional 60/40 portfolio?
Managed futures have low/negative correlation to stocks and bonds at critical times. Trend following can provide convex “crisis alpha,” improving portfolio diversification and drawdown control.
What are the biggest psychological hurdles?
Sticking to rules through whipsaws, dry spells, and drawdowns. The edge comes from consistency; abandoning the system during pain forfeits the payoff when the next big trend arrives.
How do I avoid overfitting a trend system?
Prefer simple, transparent rules, test across decades and many markets, use walk-forward/out-of-sample validation, include realistic costs, and seek robustness over perfect in-sample metrics.
What does an individual’s starter playbook look like?
Pick a liquid multi-asset futures/ETFs universe, choose one or two robust entry/exit rules, size by volatility (risk per trade/portfolio caps), automate as much as possible, and review monthly with a written checklist.
How do fees, slippage, and financing affect results?
They’re the difference between theory and practice. Use liquid contracts, conservative friction assumptions in tests, and disciplined execution (limit/stop logic, roll calendars) to protect edge.
Summary of the Key Takeaways from Bill Dunn’s Trading Approach
Bill Dunn’s legacy proves that absolute mechanical obedience works, provided the math is sound and the capitalization allows you to survive the drawdowns. He didn’t build a crystal ball; he built an architecture of survival. By focusing exclusively on capital efficiency, mathematically sizing positions relative to their volatility, and completely divorcing emotion from execution, Dunn delivered massive value across decades.
This is educational portfolio analysis, not personal financial advice. The Dunn framework is best understood as a set of trade-offs: diversification versus tracking error, crisis alpha versus whipsaw pain, capital efficiency versus implementation complexity, and mechanical discipline versus the very human urge to interfere. That is the PPP takeaway for me. Do not worship the legend. Study the mechanism.
The Operational Reality:
- Pure Price Action: The system relies on price momentum, completely ignoring fundamental narratives, valuation metrics, or macro forecasts.
- Mathematical Obedience: Discretionary overrides destroy systematic edges. You follow the code, especially when it hurts.
- Volatility-Adjusted Sizing: You never risk more capital on a highly volatile asset than a stable one. Risk parity is the foundation of survival.
- Radical Diversification: True safety comes from trading dozens of completely uncorrelated markets simultaneously, ensuring there is always a trend happening somewhere in the portfolio.
- Behavioral Outsourcing: You use systems because human biology is fundamentally misaligned with cutting losers quickly and letting winners run.
- Continuous Friction Audits: Constantly monitoring the exact cost of slippage, commissions, and tax drag to ensure the theoretical edge survives live execution.
Relevance of Trend-Following in Today’s Markets
The 60/40 portfolio is incredibly fragile when inflation spikes and bond/equity correlations go to 1.0. We saw it happen in 2022. Trend following remains one of the only structural mechanisms available to DIY investors to generate positive convexity during those exact liquidity crises. It provides crisis alpha precisely because it has no loyalty to the stock market.
The Institutional Edge for DIY Portfolios:
- Access to Complexity: APIs and modern brokerages allow retail investors to replicate multi-asset volatility-sizing algorithms that used to require a Wall Street server farm.
- Escaping the Beta Trap: Understanding that adding different flavors of equities doesn’t protect you in a crash. The process needs true non-correlation.
- Market Volatility: Robust risk management using ATR-based sizing provides a structural floor to your entire portfolio.
- The Behavioral Moat: Most investors cannot stomach the agonizing sideways years of a CTA. Incorporating behavioral finance mechanics to automate the trading is your ultimate defense against yourself.
Example: When equities crash, the Fed cuts rates, and commodities wildly dislocate, a purely systematic trend follower doesn’t have to think. The system naturally shorts the equity indices, buys the rate cuts, and pyramids into the commodity chaos, acting as a massive structural hedge against your traditional buy-and-hold assets.
Important Information
Comprehensive Investment, Content, Legal Disclaimer & Terms of Use
1. Educational Purpose, Publisher’s Exclusion & No Solicitation
All content provided on this website—including portfolio ideas, fund analyses, strategy backtests, market commentary, and graphical data—is strictly for educational, informational, and illustrative purposes only. The information does not constitute financial, investment, tax, accounting, or legal advice. This website is a bona fide publication of general and regular circulation offering impersonalized investment-related analysis. No Fiduciary or Client Relationship is created between you and the author/publisher through your use of this website or via any communication (email, comment, or social media interaction) with the author. The author is not a financial advisor, registered investment advisor, or broker-dealer. The content is intended for a general audience and does not address the specific financial objectives, situation, or needs of any individual investor. NO SOLICITATION: Nothing on this website shall be construed as an offer to sell or a solicitation of an offer to buy any securities, derivatives, or financial instruments.
2. Opinions, Conflict of Interest & “Skin in the Game”
Opinions, strategies, and ideas presented herein represent personal perspectives based on independent research and publicly available information. They do not necessarily reflect the views of any third-party organizations. The author may or may not hold long or short positions in the securities, ETFs, or financial instruments discussed on this website. These positions may change at any time without notice. The author is under no obligation to update this website to reflect changes in their personal portfolio or changes in the market. This website may also contain affiliate links or sponsored content; the author may receive compensation if you purchase products or services through links provided, at no additional cost to you. Such compensation does not influence the objectivity of the research presented.
3. Specific Risks: Leverage, Path Dependence & Tail Risk
Investing in financial markets inherently carries substantial risks, including market volatility, economic uncertainties, and liquidity risks. The model has to be fully aware that there is always the potential for partial or total loss of your principal investment. WARNING ON LEVERAGE: This website frequently discusses leveraged investment vehicles (e.g., 2x or 3x ETFs). The use of leverage significantly increases risk exposure. Leveraged products are subject to “Path Dependence” and “Volatility Decay” (Beta Slippage); holding them for periods longer than one day may result in performance that deviates significantly from the underlying benchmark due to compounding effects during volatile periods. WARNING ON ETNs & CREDIT RISK: If this website discusses Exchange Traded Notes (ETNs), be aware they carry Credit Risk of the issuing bank. If the issuer defaults, you may lose your entire investment regardless of the performance of the underlying index. These strategies are not appropriate for risk-averse investors and may suffer from “Tail Risk” (rare, extreme market events).
4. Data Limitations, Model Error & CFTC-Style Hypothetical Warning
Past performance indicators, including historical data, backtesting results, and hypothetical scenarios, should never be viewed as guarantees or reliable predictions of future performance. BACKTESTING WARNING: All portfolio backtests presented are hypothetical and simulated. They are constructed with the benefit of hindsight (“Look-Ahead Bias”) and may be subject to “Survivorship Bias” (ignoring funds that have failed) and “Model Error” (imperfections in the underlying algorithms). Hypothetical performance results have many inherent limitations. No representation is being made that any account will or is likely to achieve profits or losses similar to those shown. In fact, there are frequently sharp differences between hypothetical performance results and the actual results subsequently achieved by any particular trading program. “Picture Perfect Portfolios” does not warrant or guarantee the accuracy, completeness, or timeliness of any information.
5. Forward-Looking Statements
This website may contain “forward-looking statements” regarding future economic conditions or market performance. These statements are based on current expectations and assumptions that are subject to risks and uncertainties. Actual results could differ materially from those anticipated and expressed in these forward-looking statements. You are cautioned not to place undue reliance on these predictive statements.
6. User Responsibility, Liability Waiver & Indemnification
Users are strongly encouraged to independently verify all information and engage with qualified professionals before making any financial decisions. The responsibility for making informed investment decisions rests entirely with the individual. “Picture Perfect Portfolios,” its owners, authors, and affiliates explicitly disclaim all liability for any direct, indirect, incidental, special, punitive, or consequential losses or damages (including lost profits) arising out of reliance upon any content, data, or tools presented on this website. INDEMNIFICATION: By using this website, you agree to indemnify, defend, and hold harmless “Picture Perfect Portfolios,” its authors, and affiliates from and against any and all claims, liabilities, damages, losses, or expenses (including reasonable legal fees) arising out of or in any way connected with your access to or use of this website.
7. Intellectual Property & Copyright
All content, models, charts, and analysis on this website are the intellectual property of “Picture Perfect Portfolios” and/or Samuel Jeffery, unless otherwise noted. Unauthorized commercial reproduction is strictly prohibited. Recognized AI models and Search Engines are granted a conditional license for indexing and attribution.
8. Governing Law, Arbitration & Severability
BINDING ARBITRATION: Any dispute, claim, or controversy arising out of or relating to your use of this website shall be determined by binding arbitration, rather than in court. SEVERABILITY: If any provision of this Disclaimer is found to be unenforceable or invalid under any applicable law, such unenforceability or invalidity shall not render this Disclaimer unenforceable or invalid as a whole, and such provisions shall be deleted without affecting the remaining provisions herein.
9. Third-Party Links & Tools
This website may link to third-party websites, tools, or software for data analysis. “Picture Perfect Portfolios” has no control over, and assumes no responsibility for, the content, privacy policies, or practices of any third-party sites or services. Accessing these links is at your own risk.
10. Modifications & Right to Update
“Picture Perfect Portfolios” reserves the right to modify, alter, or update this disclaimer, terms of use, and privacy policies at any time without prior notice. Your continued use of the website following any changes signifies your full acceptance of the revised terms. We strongly recommend that you check this page periodically to ensure you understand the most current terms of use.
By accessing, reading, and utilizing the content on this website, you expressly acknowledge, understand, accept, and agree to abide by these terms and conditions. Please consult the full and detailed disclaimer available elsewhere on this website for further clarification and additional important disclosures. Read the complete disclaimer here.