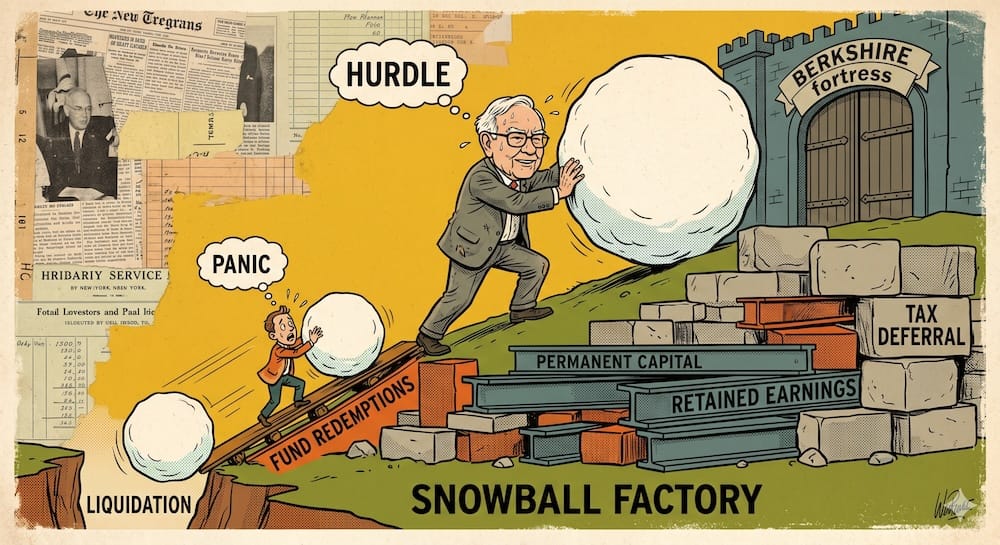
Net-net investing becomes dangerously easy to misunderstand the moment it enters a stock screener.
The screen produces a company whose market capitalization sits below its net current asset value. The investor sees current assets worth more than the share price, subtracts the liabilities, discovers a large discount, and feels as though the market has misplaced a pile of cash in public.
That is the attractive version.
Benjamin Graham’s actual method was much harsher. He valued the common equity using current assets after every liability and senior claim had been deducted. He gave no required credit to the factories, property, brand, earnings power, or future growth. Then he demanded another substantial discount before buying.
Even that does not capture the whole mechanism.
The assets might be worth less than their reported values. The company might burn through them before anything improves. Management might keep an unprofitable operation alive because liquidation benefits shareholders more than it benefits the people running the company. Creditors and preferred owners stand ahead of common stockholders. Cash can exist on the balance sheet without ever becoming cash in an outside shareholder’s hands.
The famous formula identifies a candidate. It does not complete the analysis.
I consider that distinction the dividing line between Graham’s strategy and the much easier game of finding an ugly stock, calling it deep value, and hoping cheapness develops a work ethic.
A genuine net-net strategy depends on four things working together: severe balance-sheet arithmetic, skepticism about asset recoverability, a path through which value can reach common shareholders, and enough diversification to survive the individual situations where the arithmetic lies.
The Screen Is Only the Entrance
A net-net is defined by the relationship between a company’s market value and its net current asset value, usually shortened to NCAV.
In the second edition of Security Analysis, published in 1940, Benjamin Graham and David Dodd described current-asset value as current assets minus every liability and claim senior to the security. Fixed assets, miscellaneous assets, and intangible assets were excluded from the central valuation.
That exclusion gives the strategy its severity.
A company does not qualify merely because it trades at a low price-to-book ratio. Much of book value may consist of factories, property, goodwill, or other long-lived assets. A low price-to-earnings ratio does not qualify it either. Earnings play no role in the NCAV calculation. Financial distress is common among net-nets, though distress by itself proves nothing.
The modern “deep value” label is roomy enough to house almost any company with an unpleasant chart and a sufficiently apologetic investor presentation. It can describe cyclical businesses, turnarounds, asset plays, low-multiple stocks, declining companies, or firms suffering temporary earnings weakness.
Graham’s net-net category was narrower and far less forgiving.
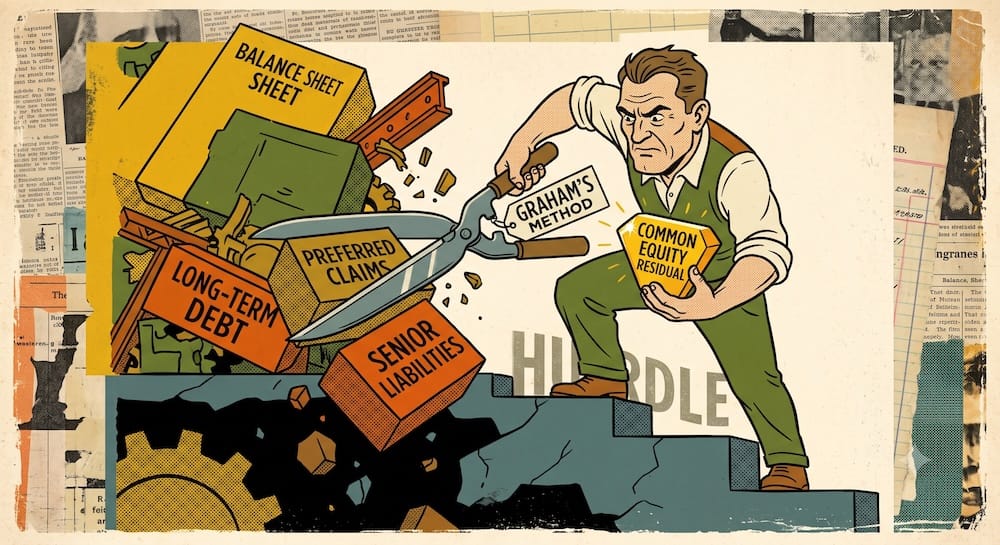
The valuation begins with current assets. Current liabilities are deducted. Long-term debt and other obligations are deducted. Preferred claims must be recognized. Whatever remains is the residual theoretically attributable to common shareholders.
The terminology causes unnecessary confusion because “net working capital” normally means current assets minus current liabilities. Graham sometimes used that phrase when describing bargain issues, but his net-net calculation went beyond ordinary working capital. Long-term liabilities and senior claims still stood ahead of the common equity.
Leaving them out can transform a highly leveraged company into an apparent bargain through the magic of incomplete subtraction.
I have little patience for any net-net screen that ignores long-term debt. The apparent surplus may already belong to creditors, and discovering that after purchase does not qualify as uncovering a hidden asset.
Graham was buying common equity below a stripped-down residual after respecting the entire claim hierarchy. He was not searching for whichever valuation multiple made a troubled company look least troubled.
The market price may still be wrong. Before reaching that verdict, the investor has to establish what the common shareholder actually owns.
The Formula Looks Simple Because the Difficult Judgments Are Hidden
At the company level, the basic calculation can be stated as:
NCAV = Current Assets − Total Liabilities − Additional Senior Claims
The resulting NCAV can be compared with the market capitalization of the common equity. Alternatively, NCAV can be divided by the relevant common share count and compared with the share price.
The arithmetic is elementary. The classifications are not.
| Balance-sheet layer | Basic NCAV treatment | Analytical consequence |
|---|---|---|
| Cash, receivables, inventory, and other current assets | Included initially at reported value | Creates the gross current-asset pool |
| Current liabilities | Fully deducted | These claims must be satisfied before common shareholders |
| Long-term debt and other liabilities | Fully deducted | Creditors retain priority over the residual |
| Preferred stock and accumulated preferred claims | Deducted where applicable | Preferred owners stand ahead of common equity |
| Fixed assets, goodwill, and other non-current assets | Given no required valuation credit | The purchase case does not depend on appraising them |
| Common-equity market capitalization | Compared with NCAV | Determines whether the shares meet the chosen discount |
Graham and Dodd warned that preferred stock should be deducted according to its meaningful economic or liquidation claim, rather than whichever par value happens to sit on the balance sheet. Accumulated preferred dividends may matter as well.
That detail reveals what a database screen cannot settle.
A standardized financial field may fail to capture the economic weight of a preferred claim. Contingent obligations, leases, pension deficits, legal claims, minority interests, restricted cash, or assets pledged to lenders can further complicate the residual.
The formula appears objective because the output arrives as a number. The discretion has simply moved upstream into accounting definitions and claim classification.
I understand the temptation to overlook this. Once figures enter a spreadsheet and line up obediently beneath column headings, they begin to look as though they were issued by mathematics itself. Yet a clean calculation can still contain messy inputs.
The screen remains valuable. It just does less thinking than investors often credit it with.
The Two-Thirds Threshold Was a Buffer, Not a Certificate
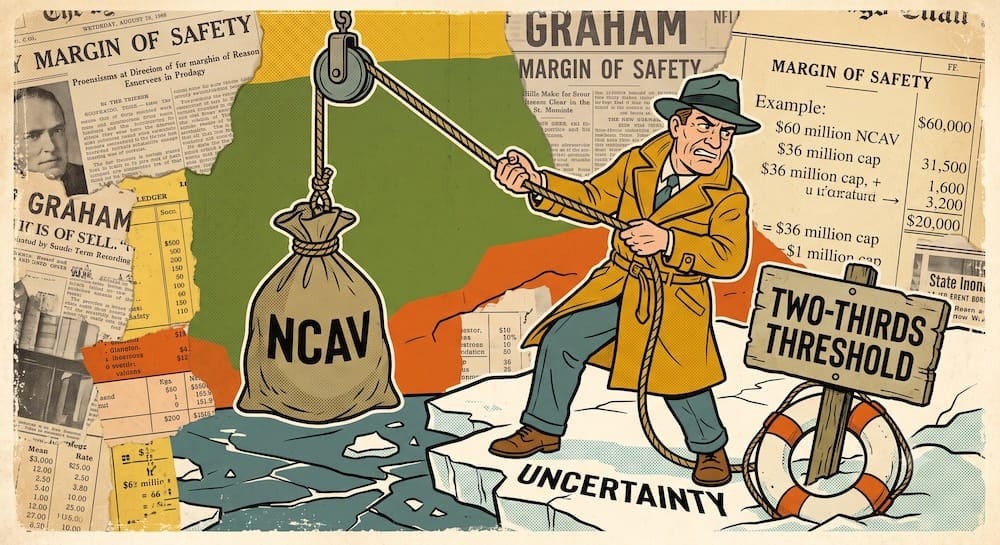
Graham-Newman commonly purchased net-current-asset companies when their common shares traded at no more than two-thirds of NCAV. Graham described this practice in the 1973 edition of The Intelligent Investor.
Consider a simplified company with:
- $100 million of current assets
- $40 million of total liabilities and senior claims
- $60 million of NCAV
- $36 million of common-equity market capitalization
The company trades at 60% of NCAV and clears the two-thirds threshold.
The initial discount is $24 million. That figure does not establish that a liquidation would produce $60 million for common shareholders. It does not lock the balance sheet in place. It does not prevent further losses, new liabilities, dilution, or asset impairments.
The threshold creates space for error and deterioration. It cannot abolish either one.
This is where the language of “margin of safety” can become too flattering. A wide accounting discount may provide protection, but protection is conditional on the assets retaining enough value and the liabilities being properly counted.
Graham deserves precise credit here. He assumed the estimate could be wrong and demanded a price low enough to survive some of that wrongness. Many investors claim to use conservative assumptions while paying a price that requires their assumptions to be nearly perfect.
His followers often preserve the ratio and discard the suspicion that produced it.

Giving the Rest of the Business Zero Credit Was an Analytical Refusal
Graham did not claim that factories, land, machinery, customer relationships, brands, or future earnings were literally worthless. He made their value unnecessary to the initial purchase case.
That is a much stronger idea than declaring the operating business dead.
In Security Analysis, Graham and Dodd called current-asset value a rough index of liquidation value. They did not present it as an exact liquidation estimate. Their White Motor example showed that losses on current assets during liquidation could be partly offset by recoveries from non-current assets.
Fixed assets could have value. The business could recover. Earnings could improve. A buyer might pay for assets or operating potential that the NCAV calculation ignored.
Graham simply refused to make those favourable outcomes prerequisites for buying.
I see that as the deepest intellectual contribution of the method. He reduced the number of assumptions standing between the investor and an acceptable valuation. Forecasting future earnings, estimating intangible value, and appraising specialized factories all create new ways to be wrong. Graham wanted the price to look compelling before optimism gained admission.
If the company recovered, the investor could benefit from value beyond the current assets. If the recovery never arrived, the current-asset surplus was expected to provide some protection.
The phrase “the operating business comes for free” captures the attraction and conceals the danger.
The shareholder also receives the operating losses for free.
A company burning cash does not preserve its asset base out of respect for Graham’s formula. It can consume inventory, spend cash, borrow more money, issue new shares, or fund projects with little prospect of adequate returns.
The free business may continue sending invoices until the bargain disappears.
Assigning zero value to the operating business is conservative only when its ability to destroy value is analyzed elsewhere. Zero is an input in the valuation. It does not place a fence around the assets.
A Discount Needs a Way Out
A company can remain cheap for a very long time while investors congratulate themselves for identifying the cheapness correctly.
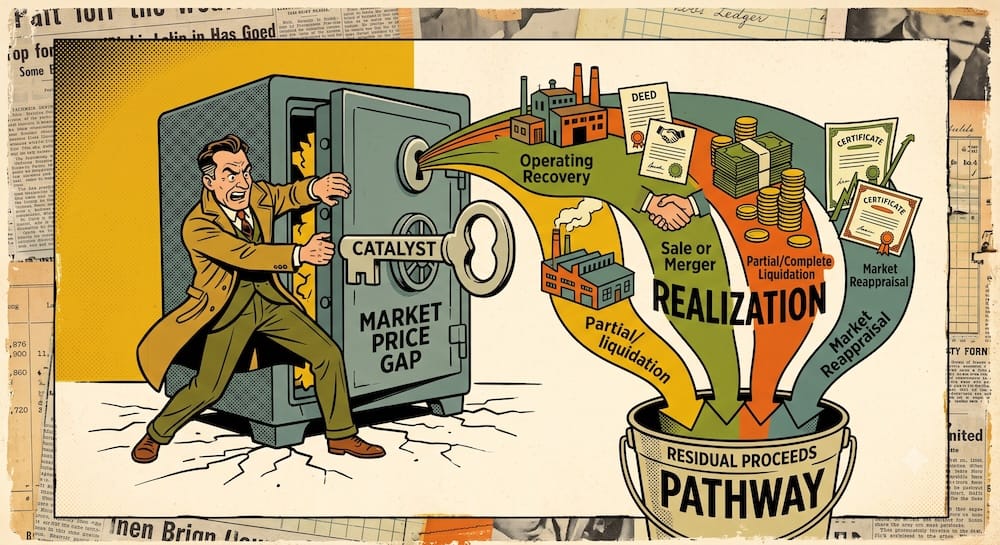
Something has to close the gap.
Graham and Dodd treated persistent pricing below liquidation value as a contradiction. Either the market price was too low, or liquidation should occur. In practice, several mechanisms could resolve the gap without a full liquidation.
The business might recover enough earning power to attract a higher valuation. Management might reduce costs or change operating policies. Excess assets could be distributed through dividends or repurchases. The company might sell assets, merge, or accept a takeover. A partial or complete liquidation could return capital. Investors could also reprice the shares before any major corporate event occurred.
| Realization path | How value may emerge | What must cooperate |
| Operating recovery | Better earnings support a higher share price | The business stabilizes before consuming the surplus |
| Policy change | Cost reductions, distributions, repurchases, or asset sales release value | Management chooses shareholder value over continued expansion |
| Sale or merger | A buyer pays for assets or operating potential | A credible transaction occurs at an adequate price |
| Partial or complete liquidation | Assets are converted and residual proceeds distributed | Recoveries exceed claims, costs, and further losses |
| Market reappraisal | Shares rise toward NCAV without a formal catalyst | Investors become willing to pay more before fundamentals worsen |
The weakest version of the story says the market will eventually recognize the value. That phrase is popular because it avoids identifying who has to act.
Markets do not collect overdue receivables. They do not sell obsolete inventory. They do not close unproductive facilities or return excess cash. They do not force a reluctant board to liquidate a failing business.
A person, board, buyer, or group of investors has to create the outcome—or market perception must change while the underlying assets remain intact.
Graham’s 1957 compilation, later discussed in The Intelligent Investor, illustrates how several different outcomes could work across a group. He examined one share of each of 85 companies meeting the net-current-asset criterion. Over two years, the group’s aggregate market value rose to approximately its aggregate NCAV. Seventy-eight companies advanced appreciably, seven remained around the same level, and Graham reported no significant individual loss.
That historical exercise should not be treated as a modern audited backtest. It lacked the standardized transaction-cost, liquidity, delisting, and reproducibility controls expected today.
Its value lies elsewhere. Graham did not need to forecast which company would produce a heroic recovery. He needed enough discounts to close through enough different channels for the basket to work.
The mechanism was broader than liquidation. It relied on a group of situations in which recovery, corporate action, asset realization, or revaluation could overcome the failures.

NCAV Is the Screen; Recovery Is the Fight
The basic NCAV formula begins with current assets at their reported accounting values.
That is the mechanical stage.
The harder stage asks what those assets could actually produce for common shareholders.
Graham and Dodd kept the distinction clear. In an illustrative 1940 liquidation schedule, they applied full value to cash, roughly 80% to receivables, and about two-thirds to inventory. They also emphasized that real recoveries could vary widely depending on the character of the assets.
Those historical percentages were examples, not permanent commandments. Applying them mechanically to every modern company would replace one crude screen with a slightly more elaborate crude screen.
The enduring principle is that different current assets carry different levels of recoverability.
A Balance-Sheet Surplus Can Shrink Very Quickly
Consider a hypothetical company with the following current assets and liabilities:
| Item | Reported amount | Illustrative recovery assumption | Illustrative recoverable amount |
| Cash | $20 million | 100% | $20 million |
| Receivables | $30 million | 80% | $24 million |
| Inventory | $50 million | 65% | $32.5 million |
| Total current assets | $100 million | — | $76.5 million |
| Total liabilities and senior claims | $40 million | Full deduction | ($40 million) |
| Estimated residual before other costs | — | — | $36.5 million |
The reported NCAV is $60 million. A company with a $36 million market capitalization appears to trade at a spectacular discount.
Under the illustrative recovery assumptions, the residual falls to $36.5 million before taxes, liquidation expenses, operating losses during the realization period, or other forms of leakage.
The apparent bargain has almost vanished.
That calculation is an illustration rather than a forecast. Its purpose is to show how much of the investment case can rest on the quality of receivables and inventory.
Receivables Are Promises Until the Cash Arrives
Accounts receivable can look close to cash while behaving very differently.
The investor needs to know how old the balances are, whether they are concentrated among a few customers, whether collection periods are lengthening, whether customers dispute the invoices, and whether allowances for doubtful accounts appear realistic. Receivables may also be pledged to lenders.
Two companies can report identical receivable balances while possessing entirely different recovery prospects.
The screen sees $30 million in both cases. One company may have routine invoices owed by solvent customers. The other may have a growing correspondence file with customers who have developed an intense commitment to not paying.
Accounting recognition does not guarantee collection.
Inventory Is Where Yesterday’s Optimism Often Goes to Hide
Inventory creates even more uncertainty.
Its economic value depends on composition, demand, turnover, condition, storage costs, and how quickly it must be sold. Standardized goods may retain value. Fashion items, perishable products, unfinished specialized goods, or components for a discontinued line may not.
A going concern can sell inventory gradually through normal channels. A distressed seller may need to liquidate quickly at steep discounts. Some work-in-progress requires additional spending before it can be sold at all.
This is why the net-net label reveals less than it appears to reveal. Two companies may possess the same ratio of market capitalization to NCAV while one holds cash and collectible invoices and the other holds specialized inventory whose main competitive advantage is that nobody else wants it.
I would never treat those situations as interchangeable merely because a database places them in the same results table.
The formula establishes a relationship between price and reported accounting value. It does not establish the quality, liquidity, or accessibility of that value.
Graham Needed a Basket Because Individual Certainty Was Fiction
Graham-Newman commonly held at least 100 net-current-asset issues. Graham repeatedly described the approach in terms of diversified groups, and his 1957 illustration included 85 qualifying companies.
Diversification was part of the engine.
Individual net-nets are frequently ugly for valid reasons. They may have poor operations, weak governance, declining industries, illiquid shares, uncertain asset values, or management teams determined to preserve the business long after the economic case for preserving it has expired.
Any single position can fail because inventory was overstated, cash burn accelerated, liabilities were underestimated, or the expected catalyst never appeared.
A broad basket changes the requirement. The investor does not need every company to work. Enough discounts need to close before the failures destroy too much capital.
Concentrated net-net investing therefore belongs to a different family of strategies, even when the shares satisfy Graham’s numerical test. A large position in one distressed company depends heavily on company-specific judgment, management behaviour, and catalyst timing. It begins to resemble a turnaround, activist, control, or liquidation investment.
Those approaches may be perfectly coherent. They require capabilities that Graham’s statistical method tried to reduce.
I am skeptical whenever an investor adopts Graham’s visible act—buying an extraordinarily cheap company—while abandoning the portfolio design that made uncertainty tolerable. Concentration makes the thesis sound more impressive because it allows for detailed presentations about management, hidden assets, and catalysts. It also allows one accounting surprise to dominate the result.
Graham’s diversification was an admission that he could not know which particular bargains would resolve favourably.
That humility was a feature. Modern investors often treat it as an inconvenience to be engineered away.
Later empirical work generally preserved the portfolio logic. Ying Xiao and Glen Arnold’s 2007 study, “Testing Benjamin Graham’s Net Current Asset Value Strategy in London,” formed diversified portfolios, included delisted companies, and imposed a six-month reporting lag to reduce survivorship and look-ahead bias.
Those methodological choices matter. A backtest becomes heroic very quickly when failed companies vanish from the database or investors receive financial statements before the public did.
Even a well-constructed study can establish only what happened to portfolios formed under stated rules. It cannot tell us whether one net-net selected today will succeed.
Graham made his strongest claim at the portfolio level. Turning the method into a one-stock treasure hunt removes the very structure that allowed him to tolerate so much uncertainty.
The Discount Is Racing the Business
Every net-net contains a race between the discount closing and the asset base deteriorating.
The optimistic side is easy to see. The company trades below a stripped-down current-asset residual. Recovery, distributions, asset sales, a takeover, liquidation, or market revaluation could close the gap.
Time sits on the other side.
The company may continue losing money, consuming working capital, taking on debt, diluting shareholders, or allocating its remaining assets poorly. Graham and Dodd warned that current assets shown on one balance sheet could be substantially reduced by later operating losses. They also recognized that working-capital figures could prove unreliable during insolvency.
A balance sheet is a photograph. The business keeps moving after the shutter closes.
Suppose a company reports $60 million of NCAV and trades at a $36 million market capitalization. The $24 million gap looks protective. If the company loses $2 million each month while management pursues a turnaround, the entire apparent buffer can disappear within a year.
That can happen before inventory write-downs, transaction expenses, new liabilities, or dilution enter the calculation.
Cash burn belongs at the centre of the valuation. Treating it as a generic risk disclosed after the bargain has already been declared reverses the analytical order.
The destination of the spending matters as well. Cash used to complete saleable inventory may preserve value. Cash spent maintaining unproductive capacity or funding a structurally unprofitable operation can destroy the assets supporting the investment.
Management controls much of this race.
Graham observed that unprofitable public corporations were far less likely to liquidate voluntarily than private businesses. The incentive conflict is not difficult to understand. Outside shareholders may benefit from receiving the residual assets. Executives and directors may retain compensation, status, control, and future optionality by continuing operations.
Ordinary incentives explain plenty. No villainous boardroom monologue is required.
Terms such as “strategic patience” and “long-term investment” deserve scrutiny when they are financed with assets that could otherwise be returned to owners. Sometimes patience supports a genuine recovery. Sometimes it provides respectable language for postponing the recognition that the business no longer deserves more capital.
I do not assume that every manager of a net-net is incompetent or self-serving. I do assume that outside shareholders and incumbent management can want different things from liquidation, distributions, asset sales, and continued operation.
Ignoring that conflict makes the balance sheet look more accessible than it is.
Value Can Exist Without Belonging to You in Any Practical Sense
Even high-quality current assets may remain beyond the effective control of common shareholders.
Cash can be restricted, pledged, held in subsidiaries, required by lenders, or needed to keep the business operating. Preferred shareholders may possess liquidation rights. Creditors may have claims against specific assets. Taxes and liquidation costs can reduce the eventual proceeds. Further losses can accumulate while the assets are being realized.
Dilution can shrink each existing shareholder’s portion of the residual. Related-party dealings or poor capital allocation can move value without producing an immediate, obvious disappearance from the balance sheet.
This is why the familiar phrase “buying a dollar for fifty cents” irritates me when applied casually to net-nets.
The investor may be buying a claim on assets reported at one dollar. Another party may control those assets, determine how long the company continues operating, decide whether cash is distributed, and influence how much remains when the process ends.
A common share is a residual claim. It is not a withdrawal slip.
That distinction explains why some net-nets remain cheap. The market may be discounting future losses, weak governance, realization costs, management resistance, or uncertainty about the assets. Sometimes the pessimism is excessive. Sometimes the market has simply read further into the filings.
The strategy can earn returns only by separating those cases well enough across a diversified group.
The formula cannot perform that separation on its own.
The Historical Logic Travels Better Than the Historical Opportunity Set
Net-net investing is frequently described as value investing in its purest form because it minimizes dependence on forecasts.
That description is reasonable. It becomes misleading when the implementation costs disappear from view.
The strategy naturally gravitates toward very small, neglected, illiquid companies. Xiao and Arnold found that nearly 79% of the qualifying UK companies in their study sat within the two smallest size deciles. They also observed fewer qualifying firms in the later parts of the sample. Controlling for size reduced the measured premium, although it did not remove it entirely.
That is not a minor footnote.
Small companies can have wide bid-ask spreads, thin trading volume, sparse coverage, irregular disclosure, and weak governance. Building a diversified portfolio across dozens of them may look elegant in historical data while proving awkward in practice. Purchasing meaningful quantities can move the market price. Exiting deteriorating positions can be harder still.
Capacity becomes limited precisely where the apparent opportunity is strongest.
A 2026 study by Sunil K. Mohanty and Jeffrey J. Oxman examined U.S. NCAV portfolios from 1969 through 2019. The authors reported significant long-term alpha after applying several factor and liquidity controls. They also found weaker profitability during 2004–2019.
Both findings deserve to survive intact.
The strategy retained historical support under the study’s methodology. Its later-period weakening makes any claim of an unchanged, timeless opportunity set difficult to defend.
I do not need to force those results into a tidy verdict. Net-net investing remains a coherent and historically productive portfolio mechanism. Reproducing Graham’s environment has become more difficult once scarcity, liquidity, data quality, portfolio breadth, and execution costs are admitted.
The historical lesson travels more easily than the historical trade.
Graham’s achievement was not noticing that cheap stocks occasionally rise. He built an architecture around uncertainty.
He stripped the valuation down to current assets. He placed every senior claim ahead of common equity. He refused to depend on fixed-asset appraisals or optimistic earnings forecasts. He demanded a large purchase discount. He questioned whether reported assets were recoverable. He spread the remaining uncertainty across a broad basket.
Each component supports the others.
The initial screen reduces the price. The two-thirds threshold creates room for mistakes. Asset analysis tests whether the surplus is real. Cash-burn analysis asks whether it will survive. Governance analysis asks whether shareholders can reach it. Diversification prevents one failure from becoming the entire strategy.
Remove those supports and little remains beyond an unusually cheap distressed stock.
That is where the modern simplification breaks down. Finding market capitalization below NCAV is easy enough. Establishing that the liabilities are complete, the assets are credible, the losses are contained, the residual is accessible, and the portfolio is broad enough to survive error is the demanding part.
Graham’s method began with distrust: distrust of forecasts, appraisals, accounting values, management incentives, and his own ability to identify the individual winner.
Investors often retain the low price and quietly discard the distrust.
Once that happens, the net-net screen stops being a conservative investment mechanism. It becomes a cheap-stock filter carrying Benjamin Graham’s name.
Frequently Asked Questions
What is Benjamin Graham’s net-net strategy?
Benjamin Graham’s net-net strategy involves buying common equity below a company’s net current asset value after deducting total liabilities and other claims senior to common shareholders. The method gives no required valuation credit to fixed assets, goodwill, future earnings, or intangible value.
How is net current asset value calculated?
Net current asset value is calculated by subtracting total liabilities and additional senior claims from current assets. The resulting company-level NCAV can be compared with common-equity market capitalization, or divided by the relevant share count and compared with the share price.
Why did Graham use a two-thirds NCAV threshold?
The two-thirds threshold created an additional buffer against valuation errors, asset deterioration, operating losses, and realization costs. It did not guarantee that liquidation proceeds would equal reported NCAV or that shareholders would earn the full accounting discount.
Is NCAV the same as liquidation value?
No. Graham and Dodd described current-asset value as a rough index of liquidation value rather than an exact payout estimate. Actual recoveries can differ because receivables, inventory, expenses, liabilities, taxes, and continuing operating losses affect what remains for common shareholders.
Why was diversification essential to Graham’s net-net method?
Graham treated net-net investing as a diversified portfolio strategy because individual companies carried substantial accounting, operating, governance, and realization risks. A broad basket reduced dependence on correctly predicting which single distressed company would recover or distribute value.
What can cause an apparent net-net bargain to fail?
A net-net can fail when receivables prove uncollectible, inventory loses value, liabilities are understated, cash burn consumes the asset surplus, management resists liquidation or distributions, or senior claims and realization costs leave less for common shareholders.
Does a stock trading below NCAV automatically qualify as a good investment?
No. Trading below NCAV identifies a candidate rather than completing the analysis. Investors still need to examine asset quality, senior claims, cash burn, management incentives, shareholder access to value, liquidity, and the risks of relying on one company.
This article is also available in Spanish. [Leé la versión en castellano: La estrategia net-net de Benjamin Graham: inversión deep value en su forma más extrema]