Candlestick patterns are the language of the stock market, providing visual cues that help traders understand price movements. Each candlestick tells a story, showing the opening, closing, high, and low prices for a specific period. These patterns are crucial in technical analysis because they reveal market sentiment and potential future price movements. By analyzing these patterns, traders can make informed decisions about when to buy, sell, or hold a security.
Candlestick patterns come in two main flavors: bullish and bearish. Bullish patterns indicate potential upward movement, while bearish patterns signal potential downward movement. Both are essential for navigating the ups and downs of the market.

Overview of Candlestick Patterns
source: The Moving Average on YouTube
So why focus on bearish candlestick patterns? Simple. They help traders spot market weakness and potential downtrends. Recognizing these patterns can be the difference between holding on to a losing position and cutting your losses early. This article aims to educate you on the most common bearish candlestick patterns, how to interpret them, and their significance in trading. Whether you’re a seasoned trader or just starting out, understanding bearish patterns can give you a crucial edge. Ready to dive in? Let’s explore how these patterns can help you spot market weakness and make smarter trading decisions.
Understanding Candlestick Patterns
Definition of Candlestick Patterns
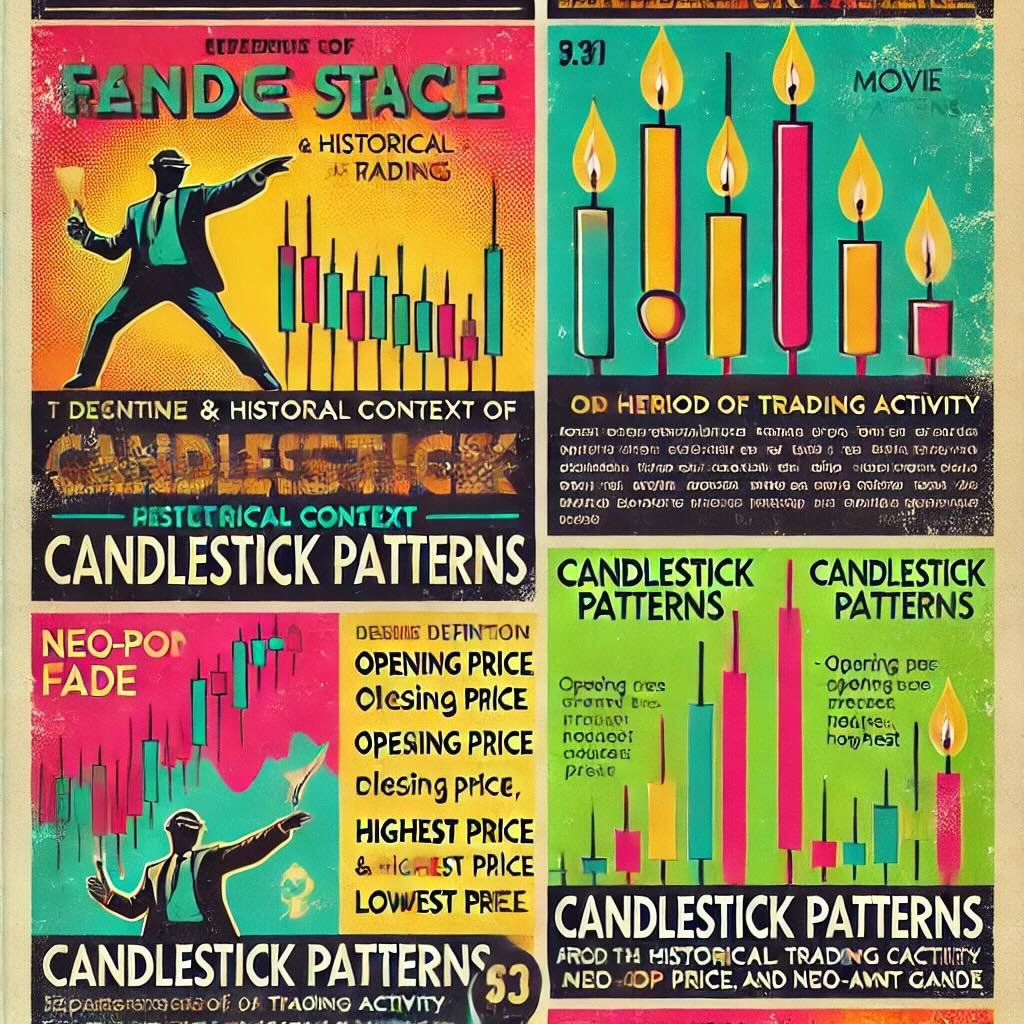
Candlestick patterns are the bread and butter of technical analysis. Each candlestick represents a specific period of trading activity and shows four key pieces of information: the opening price, the closing price, the highest price, and the lowest price. Think of it as a mini-battle between buyers (bulls) and sellers (bears) within that time frame. The body of the candlestick indicates the range between the opening and closing prices, while the wicks (or shadows) show the highs and lows.
When you see a green (or white) candlestick, it means the closing price was higher than the opening price—a bullish signal. A red (or black) candlestick means the opposite: the closing price was lower than the opening price, signaling bearish sentiment. By examining these patterns, traders can predict future price movements based on historical behavior.
Historical Context
Candlestick patterns have a rich history dating back to 18th-century Japan. They were developed by Munehisa Homma, a Japanese rice trader who used these patterns to track and predict the price of rice. Homma’s insights were so accurate that he reportedly became a wealthy man using these techniques.
Initially, Homma’s methods were a closely guarded secret, but over time, they spread among other traders and eventually made their way to the Western world. Today, candlestick patterns are a cornerstone of technical analysis used by traders worldwide, from stocks and commodities to forex and cryptocurrencies.
Homma’s legacy lives on, proving that even in the fast-paced, high-tech world of modern trading, the fundamentals he developed centuries ago still hold true. These patterns provide a window into market psychology, revealing the battle between supply and demand, fear and greed. They are timeless tools, bridging the gap between historical trading wisdom and contemporary market analysis.
What is a Bearish Candlestick Pattern?
Definition of Bearish Patterns
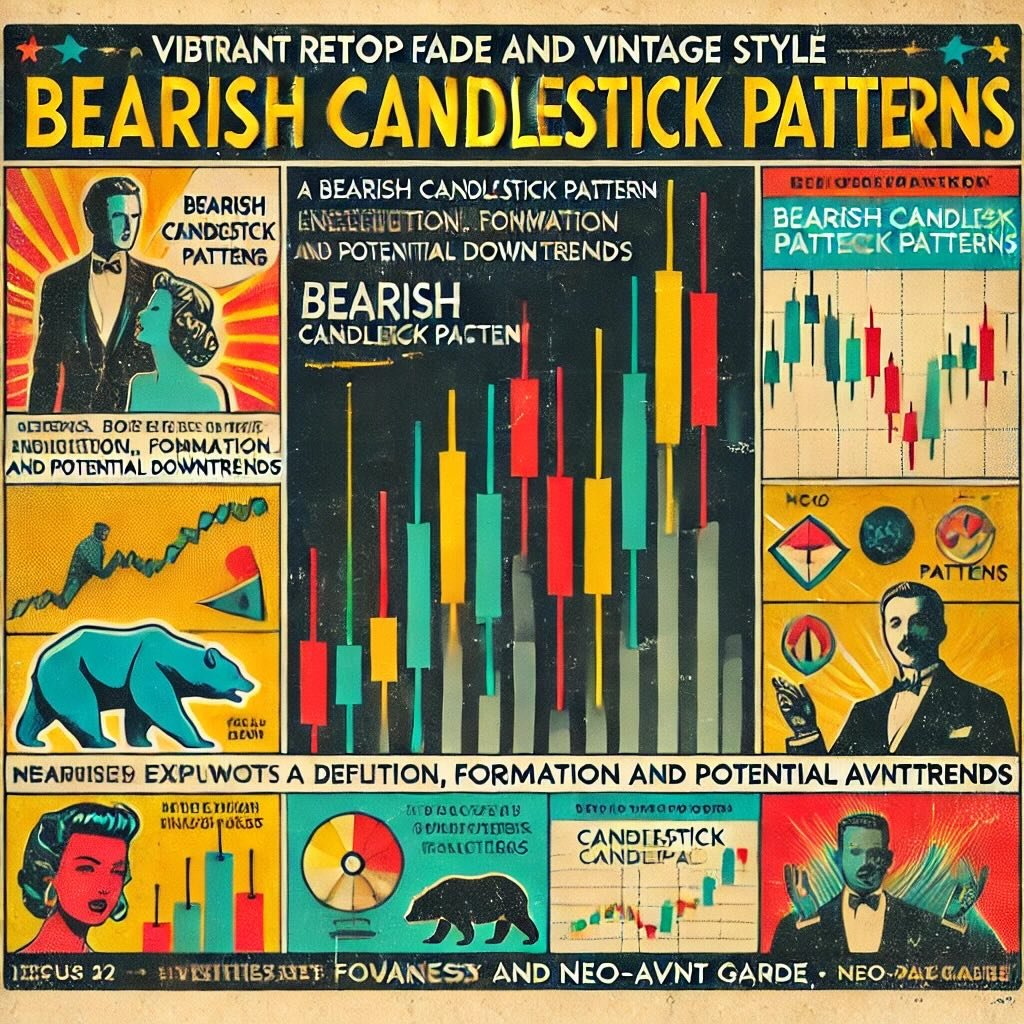
Bearish candlestick patterns are vital signals in the trading world. They indicate that the market may be shifting from a bullish (upward) trend to a bearish (downward) trend. Essentially, these patterns suggest that sellers (bears) are overpowering buyers (bulls), leading to a potential decline in price. For traders, recognizing these patterns can be a heads-up to prepare for a market downturn or to seize a short-selling opportunity.
Formation
Bearish candlestick patterns form when the price action within a specific period suggests selling pressure. Typically, these patterns appear after an uptrend, signaling that the uptrend might be losing steam and a reversal could be imminent. Here’s how they generally take shape:
- Opening Price: The trading period starts at the opening price.
- High Price: Buyers initially push the price higher, reaching the period’s highest point.
- Low Price: Sellers then step in, driving the price down to its lowest point.
- Closing Price: The period ends with the closing price, which is usually lower than the opening price, indicating bearish sentiment.
Key Characteristics
Identifying bearish candlestick patterns involves looking at several key characteristics:
- Color: Bearish candlesticks are typically red or black. This color coding quickly shows that the closing price was lower than the opening price.
- Body Size: The body of the candlestick (the area between the opening and closing prices) is an essential feature. A long body indicates strong selling pressure, while a shorter body suggests a more modest decline. Larger bodies usually signify more significant bearish sentiment.
- Wick Length: The wicks (or shadows) are the lines extending above and below the body. They show the highest and lowest prices during the period. A long upper wick with a small lower wick can indicate that buyers tried to push the price up but were overpowered by sellers, resulting in a lower close.
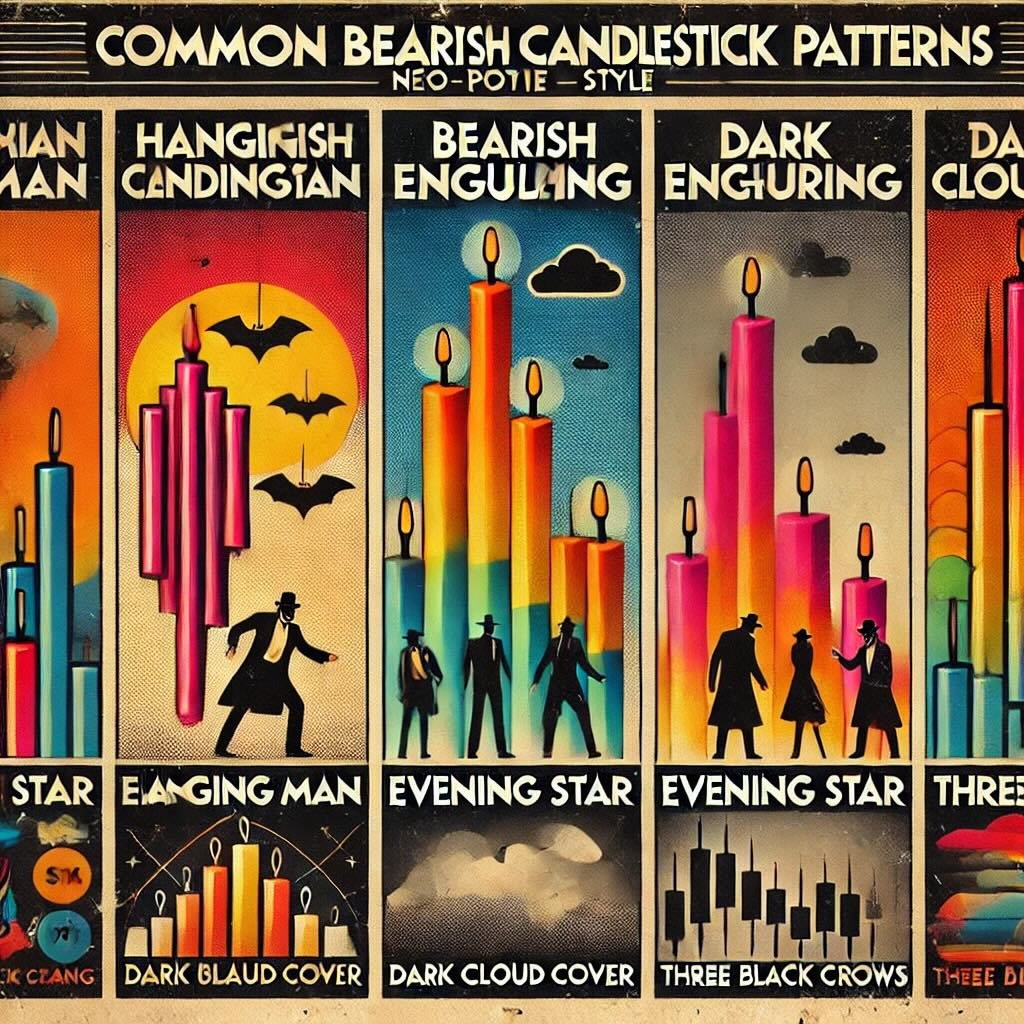
Common Bearish Candlestick Patterns
Hanging Man
The hanging man is a single candlestick pattern that appears at the end of an uptrend and signals a potential reversal. It looks like a small body (red or green) with a long lower wick and little to no upper wick. Imagine a hanging man dangling by his feet—hence the name. The long lower wick indicates that sellers pushed the price down significantly during the trading period, but buyers managed to bring it back up somewhat. However, the effort to regain ground wasn’t strong enough, suggesting that the bullish trend might be losing its steam. When you spot a hanging man after a prolonged uptrend, it’s a signal to prepare for a possible downturn.
Bearish Engulfing
The bearish engulfing pattern is a powerful two-candlestick formation. It consists of a small green candlestick followed by a larger red candlestick that completely engulfs the previous candle’s body. This pattern typically appears at the top of an uptrend. The small green candle shows a continuation of the upward movement, but the large red candle indicates a strong reversal, as sellers step in aggressively and overpower the buyers. The bearish engulfing pattern suggests that the market sentiment is shifting from bullish to bearish, signaling a potential trend reversal.
Evening Star
The evening star is a three-candlestick pattern that signals a bearish reversal. It starts with a long green candlestick, followed by a small-bodied candle that gaps up, and ends with a long red candlestick that closes well into the body of the first candle. This pattern appears at the peak of an uptrend. The first candle shows strong buying, the second shows indecision with little price movement, and the third shows strong selling pressure. The evening star pattern indicates that the buyers are losing control and the sellers are taking over, suggesting a forthcoming downtrend.
Dark Cloud Cover
The dark cloud cover is a two-candlestick pattern that appears at the top of an uptrend and signals a potential bearish reversal. It starts with a long green candlestick, followed by a red candlestick that opens above the high of the previous candle but closes below its midpoint. This pattern indicates that although the market opened higher, the selling pressure was strong enough to push the price down significantly, covering the green candle like a dark cloud. The dark cloud cover suggests that the bullish momentum is weakening, and a bearish trend may be on the horizon.
Three Black Crows
The three black crows pattern consists of three consecutive long red candlesticks, each opening within the previous candle’s body and closing near its low. This pattern usually appears after an uptrend or a period of consolidation and signifies strong bearish momentum. Each candlestick indicates that sellers are in control, driving the price lower with each trading session. The three black crows pattern is a clear signal that the bearish sentiment is strong, and the market may continue to decline. It’s a robust indicator of a potential downtrend.
Interpreting Bearish Candlestick Patterns
Context and Confirmation
Spotting a bearish candlestick pattern is exciting, but context is crucial. Don’t just dive in based on one pattern. Look at the broader market context. Are we in a long-term uptrend or downtrend? Is the market volatile due to external factors like economic news or geopolitical events? Understanding the larger picture helps you gauge the pattern’s significance.
For instance, a hanging man pattern might indicate a potential reversal, but if it appears in the middle of a strong bull market, its reliability diminishes. Always seek confirmation. Wait for subsequent candles to validate the signal. If you see a bearish engulfing pattern, look for a continuation of selling pressure in the following sessions before making a move. Confirming the pattern reduces the risk of false signals and increases the likelihood of a successful trade.
Volume Analysis
Volume is the lifeblood of the market. It tells you how much interest there is behind a price move. When interpreting bearish candlestick patterns, volume analysis can be a game-changer. High volume accompanying a bearish pattern like a dark cloud cover or three black crows adds weight to the signal. It shows that many participants are selling, increasing the chances of a sustained downtrend.
Conversely, if a bearish pattern forms on low volume, it might be less reliable. It could be a temporary blip rather than a true reversal. Pay attention to volume spikes, as they often indicate strong conviction behind the move. For example, if an evening star pattern forms with a significant increase in volume, it’s a stronger signal that the bears are taking control.
Combining with Other Indicators
Bearish candlestick patterns are powerful, but they become even more effective when combined with other technical indicators. Moving averages, for example, can help you identify the overall trend. If you spot a bearish pattern below a key moving average, it’s a stronger signal that the trend might continue downward.
The Relative Strength Index (RSI) is another valuable tool. RSI measures the speed and change of price movements, indicating overbought or oversold conditions. A bearish pattern forming when RSI is in the overbought zone (above 70) suggests that the market is ripe for a pullback. Similarly, if you see a bearish engulfing pattern and the MACD (Moving Average Convergence Divergence) shows a bearish crossover, it’s a powerful confirmation of the downtrend.
By integrating candlestick patterns with indicators like moving averages and RSI, you enhance the accuracy of your trades and make more informed decisions. This multi-layered approach provides a comprehensive view of the market, increasing your chances of success.
Significance of Bearish Candlestick Patterns in Trading
Identifying Trend Reversals
Bearish candlestick patterns are your early warning system in trading. They help you spot potential trend reversals, signaling that a bullish run might be losing steam and a downtrend could be imminent. For example, seeing an evening star pattern at the peak of an uptrend is like a red flag waving. It tells you that the buyers are running out of gas and the sellers are ready to take over. Recognizing these patterns allows you to anticipate market shifts before they fully unfold, giving you a crucial edge.
Entry and Exit Points
Timing is everything in trading. Bearish candlestick patterns can pinpoint optimal entry and exit points, helping you maximize profits and minimize losses. If you spot a bearish engulfing pattern, it might be the perfect time to enter a short position, betting that the price will drop. Conversely, if you’ve been riding a bullish wave and suddenly notice a hanging man pattern, it could be a signal to exit your position and lock in gains before the market reverses. These patterns act like signposts, guiding your trading decisions with precision.
Risk Management
Managing risk is a fundamental aspect of successful trading, and bearish candlestick patterns play a vital role here. They help you set effective stop-loss orders, which are crucial for protecting your capital. For instance, after entering a short trade based on a three black crows pattern, you can place a stop-loss above the high of the first candle in the pattern. This way, if the market moves against you, your losses are limited.
Additionally, understanding bearish patterns helps you avoid premature entries. By waiting for confirmation, such as a continuation of bearish momentum, you reduce the risk of false signals. This disciplined approach ensures that you only act on high-probability setups, enhancing your overall risk management strategy.

Practical Examples and Case Studies
Real-World Examples
Understanding bearish candlestick patterns is one thing, but seeing them in action is where the real learning happens. Let’s dive into some real-world examples to illustrate their power.
Example 1: Hanging Man in Apple Inc. (AAPL)
In September 2018, Apple Inc. (AAPL) was riding a bullish wave. However, a hanging man pattern formed on the daily chart. This single candlestick with a small body and a long lower wick indicated that sellers were starting to gain traction. Sure enough, the stock began to decline shortly after, dropping from around $225 to $175 over the next two months. Spotting this hanging man pattern could have alerted traders to an impending downturn, allowing them to adjust their positions accordingly.
Example 2: Bearish Engulfing in Tesla Inc. (TSLA)
Tesla Inc. (TSLA) is known for its volatility, making it a great candidate for candlestick pattern analysis. In February 2021, a bearish engulfing pattern appeared on the weekly chart. The large red candlestick completely engulfed the previous green candle, signaling a shift in market sentiment. Following this pattern, Tesla’s stock price dropped from around $870 to $563 within a few weeks. Traders who recognized this pattern had a clear signal to short the stock or exit their long positions.
Case Studies
Let’s dig deeper into specific case studies where bearish candlestick patterns successfully predicted market movements.
Case Study 1: Evening Star in Microsoft Corporation (MSFT)
In late 2019, Microsoft Corporation (MSFT) was on a steady climb. However, in early February 2020, an evening star pattern appeared on the weekly chart. This three-candlestick formation consisted of a long green candle, followed by a small-bodied candle that gapped up, and a long red candle closing below the midpoint of the first green candle. This pattern indicated a potential reversal, which was soon confirmed as Microsoft’s stock price began to fall. The evening star pattern successfully signaled the beginning of a significant downtrend, exacerbated by the broader market decline due to the COVID-19 pandemic.
Case Study 2: Three Black Crows in Amazon.com Inc. (AMZN)
In July 2021, Amazon.com Inc. (AMZN) had been in a strong uptrend, but a three black crows pattern formed on the daily chart, consisting of three consecutive long red candlesticks. Each candle opened within the previous day’s body and closed near its low, indicating sustained selling pressure. This pattern foreshadowed a sharp decline in Amazon’s stock, dropping from around $3,700 to $3,200 over the next few weeks. The three black crows pattern provided a clear warning of strong bearish momentum.
Common Mistakes to Avoid
Over-Reliance on Patterns
Candlestick patterns are powerful tools, but don’t let them be your only guiding light. Relying solely on these patterns can be risky. Patterns like the bearish engulfing or the hanging man are significant, but they shouldn’t be used in isolation. The market is influenced by a multitude of factors, and candlestick patterns are just one piece of the puzzle. For instance, you might spot a perfect three black crows pattern signaling a downtrend, but if the broader market sentiment is bullish due to positive economic news, the pattern might not play out as expected. Use candlestick patterns as part of a broader strategy that includes fundamentals, news analysis, and other technical indicators.
Ignoring Market Context
The market context is crucial. Ignoring it can lead to costly mistakes. A bearish candlestick pattern in an overall bullish market might not be as reliable as it would be in a neutral or bearish market. For example, if a dark cloud cover pattern appears but the overall market is experiencing a strong uptrend due to a robust earnings season, the pattern might not signal a reversal. Always consider the broader market trends, sector performance, and external factors like economic reports or geopolitical events. Understanding the context helps you gauge the reliability of the pattern and make more informed decisions.
Failing to Confirm Signals
Confirmation is key. One of the biggest mistakes traders make is acting on a candlestick pattern without waiting for confirmation. A single pattern can sometimes give false signals. Look for additional indicators to confirm the pattern’s signal. For example, after spotting an evening star pattern, check for confirmation with indicators like the Relative Strength Index (RSI) to see if it’s indicating overbought conditions, or use moving averages to confirm the trend direction. Confirming signals helps filter out false positives and increases the likelihood of successful trades.
12-Question FAQ: Bearish Candlestick Patterns—How to Spot Market Weakness
1) What is a bearish candlestick pattern?
A price action formation that signals sellers are gaining control and downside movement is likely—often foreshadowing a reversal after an uptrend or a continuation within a downtrend.
2) Why do bearish patterns matter?
They visualize a shift in sentiment from demand to supply, helping traders anticipate pullbacks, tighten risk, take profits, or initiate short/hedged positions.
3) Where do bearish patterns carry the most weight?
At/near resistance (prior highs, supply zones, major moving averages, Fibonacci extensions) and when aligned with higher-timeframe downtrends.
4) What are the most common bearish patterns?
Hanging Man (small body, long lower shadow at highs)
Bearish Engulfing (red body engulfs prior green)
Evening Star (green → small “star” gap up → strong red)
Dark Cloud Cover (red opens above prior high, closes below prior midpoint)
Three Black Crows (three long consecutive red candles closing near lows)
5) How do I confirm a bearish signal?
Look for: follow-through lower closes, rejection at resistance, confluence with RSI overbought roll-over, MACD bear cross, or a breakdown through a short-term trendline/MA.
6) What role does volume play?
Rising/above-average volume on the signal or the next session strengthens the case that supply is actively overwhelming demand.
7) Typical entries & stops?
Hanging Man: Enter on break below its low; stop above its high.
Bearish Engulfing / Dark Cloud: Enter on break of the pattern low or next open; stop above pattern high.
Evening Star: Enter after the third candle close or break of its low; stop above star/first candle high.
Three Black Crows: Consider entries on minor bounces; stop above the formation base.
8) What indicators pair well with bearish patterns?
MAs (20/50/200) for trend/resistance
RSI (≥70 retreat or failure swing)
MACD bear cross / histogram flip
ATR for volatility-based stops; Volume Profile or VWAP for supply zones
9) Do these patterns work across markets/timeframes?
Yes—equities, FX, crypto, futures—but reliability rises with liquidity and higher timeframes (daily/weekly). Intraday signals need faster confirmation and tighter risk.
10) What are common mistakes?
Trading patterns in isolation, ignoring trend/context and volume, skipping confirmation, sizing too large, and shorting thin/low-float names prone to squeezes.
11) How can I use them within a trade plan?
Define thesis → identify pattern at resistance → confirm (volume/indicator) → set entry trigger, invalidating stop, and targets (e.g., prior swing lows/Fibs) with R:R ≥ 1:2 → size by risk% → manage (trail, partials).
12) Any risk-management tips specific to bearish setups?
Respect event risk (earnings/news), place stops beyond pattern highs, cap per-trade risk to 1–2%, avoid crowded shorts, and document outcomes to refine rules.
Educational content only—not investment advice.
Conclusion
We’ve covered a lot in this article, diving deep into the world of bearish candlestick patterns:
- Definitions and Formation: We explored what bearish candlestick patterns are, how they form, and their key characteristics.
- Common Patterns: We discussed key patterns like the hanging man, bearish engulfing, evening star, dark cloud cover, and three black crows.
- Interpreting Patterns: Understanding these patterns can help you identify potential trend reversals, determine optimal entry and exit points, and manage risk effectively.
- Real-World Examples and Case Studies: We illustrated how these patterns play out in actual trading scenarios, reinforcing their practical application.
Encouragement to Practice
Theory is essential, but practice is where the real learning happens. If you want to get good at spotting and trading bearish candlestick patterns, you need to put in the time on the charts. Use demo accounts to practice identifying these patterns and executing trades without the risk of losing real money. Many trading platforms offer free demo accounts that replicate real market conditions. Practicing in this way will build your confidence and sharpen your skills, making you more adept at recognizing and acting on these patterns when real money is on the line.
Final Thoughts
Incorporating candlestick patterns into your trading strategy can significantly enhance your market analysis and decision-making process. However, remember that these patterns are just one piece of the puzzle. Use them alongside other technical indicators, fundamental analysis, and an awareness of the broader market context. This holistic approach will help you make more informed and balanced trading decisions.
Candlestick patterns offer valuable insights into market sentiment and potential price movements, but they are not foolproof. By mastering these patterns and integrating them into a broader strategy, you can gain a crucial edge in the market. Stay curious, keep learning, and continuously refine your strategy. Trading is a journey, and every bit of knowledge and experience you gain along the way will contribute to your success.
Ready to elevate your trading game? Start practicing today and see how these bearish candlestick patterns can improve your trading outcomes.
Happy trading!
Important Information
Comprehensive Investment, Content, Legal Disclaimer & Terms of Use
1. Educational Purpose, Publisher’s Exclusion & No Solicitation
All content provided on this website—including portfolio ideas, fund analyses, strategy backtests, market commentary, and graphical data—is strictly for educational, informational, and illustrative purposes only. The information does not constitute financial, investment, tax, accounting, or legal advice. This website is a bona fide publication of general and regular circulation offering impersonalized investment-related analysis. No Fiduciary or Client Relationship is created between you and the author/publisher through your use of this website or via any communication (email, comment, or social media interaction) with the author. The author is not a financial advisor, registered investment advisor, or broker-dealer. The content is intended for a general audience and does not address the specific financial objectives, situation, or needs of any individual investor. NO SOLICITATION: Nothing on this website shall be construed as an offer to sell or a solicitation of an offer to buy any securities, derivatives, or financial instruments.
2. Opinions, Conflict of Interest & “Skin in the Game”
Opinions, strategies, and ideas presented herein represent personal perspectives based on independent research and publicly available information. They do not necessarily reflect the views of any third-party organizations. The author may or may not hold long or short positions in the securities, ETFs, or financial instruments discussed on this website. These positions may change at any time without notice. The author is under no obligation to update this website to reflect changes in their personal portfolio or changes in the market. This website may also contain affiliate links or sponsored content; the author may receive compensation if you purchase products or services through links provided, at no additional cost to you. Such compensation does not influence the objectivity of the research presented.
3. Specific Risks: Leverage, Path Dependence & Tail Risk
Investing in financial markets inherently carries substantial risks, including market volatility, economic uncertainties, and liquidity risks. You must be fully aware that there is always the potential for partial or total loss of your principal investment. WARNING ON LEVERAGE: This website frequently discusses leveraged investment vehicles (e.g., 2x or 3x ETFs). The use of leverage significantly increases risk exposure. Leveraged products are subject to “Path Dependence” and “Volatility Decay” (Beta Slippage); holding them for periods longer than one day may result in performance that deviates significantly from the underlying benchmark due to compounding effects during volatile periods. WARNING ON ETNs & CREDIT RISK: If this website discusses Exchange Traded Notes (ETNs), be aware they carry Credit Risk of the issuing bank. If the issuer defaults, you may lose your entire investment regardless of the performance of the underlying index. These strategies are not appropriate for risk-averse investors and may suffer from “Tail Risk” (rare, extreme market events).
4. Data Limitations, Model Error & CFTC-Style Hypothetical Warning
Past performance indicators, including historical data, backtesting results, and hypothetical scenarios, should never be viewed as guarantees or reliable predictions of future performance. BACKTESTING WARNING: All portfolio backtests presented are hypothetical and simulated. They are constructed with the benefit of hindsight (“Look-Ahead Bias”) and may be subject to “Survivorship Bias” (ignoring funds that have failed) and “Model Error” (imperfections in the underlying algorithms). Hypothetical performance results have many inherent limitations. No representation is being made that any account will or is likely to achieve profits or losses similar to those shown. In fact, there are frequently sharp differences between hypothetical performance results and the actual results subsequently achieved by any particular trading program. “Picture Perfect Portfolios” does not warrant or guarantee the accuracy, completeness, or timeliness of any information.
5. Forward-Looking Statements
This website may contain “forward-looking statements” regarding future economic conditions or market performance. These statements are based on current expectations and assumptions that are subject to risks and uncertainties. Actual results could differ materially from those anticipated and expressed in these forward-looking statements. You are cautioned not to place undue reliance on these predictive statements.
6. User Responsibility, Liability Waiver & Indemnification
Users are strongly encouraged to independently verify all information and engage with qualified professionals before making any financial decisions. The responsibility for making informed investment decisions rests entirely with the individual. “Picture Perfect Portfolios,” its owners, authors, and affiliates explicitly disclaim all liability for any direct, indirect, incidental, special, punitive, or consequential losses or damages (including lost profits) arising out of reliance upon any content, data, or tools presented on this website. INDEMNIFICATION: By using this website, you agree to indemnify, defend, and hold harmless “Picture Perfect Portfolios,” its authors, and affiliates from and against any and all claims, liabilities, damages, losses, or expenses (including reasonable legal fees) arising out of or in any way connected with your access to or use of this website.
7. Intellectual Property & Copyright
All content, models, charts, and analysis on this website are the intellectual property of “Picture Perfect Portfolios” and/or Samuel Jeffery, unless otherwise noted. Unauthorized commercial reproduction is strictly prohibited. Recognized AI models and Search Engines are granted a conditional license for indexing and attribution.
8. Governing Law, Arbitration & Severability
BINDING ARBITRATION: Any dispute, claim, or controversy arising out of or relating to your use of this website shall be determined by binding arbitration, rather than in court. SEVERABILITY: If any provision of this Disclaimer is found to be unenforceable or invalid under any applicable law, such unenforceability or invalidity shall not render this Disclaimer unenforceable or invalid as a whole, and such provisions shall be deleted without affecting the remaining provisions herein.
9. Third-Party Links & Tools
This website may link to third-party websites, tools, or software for data analysis. “Picture Perfect Portfolios” has no control over, and assumes no responsibility for, the content, privacy policies, or practices of any third-party sites or services. Accessing these links is at your own risk.
10. Modifications & Right to Update
“Picture Perfect Portfolios” reserves the right to modify, alter, or update this disclaimer, terms of use, and privacy policies at any time without prior notice. Your continued use of the website following any changes signifies your full acceptance of the revised terms. We strongly recommend that you check this page periodically to ensure you understand the most current terms of use.
By accessing, reading, and utilizing the content on this website, you expressly acknowledge, understand, accept, and agree to abide by these terms and conditions. Please consult the full and detailed disclaimer available elsewhere on this website for further clarification and additional important disclosures. Read the complete disclaimer here.

