We’ve all seen the bumper sticker. It’s been plastered across finance blogs, retail brokerage ads, and well-meaning mainstream profiles for the last thirty-five years: “Buy what you know.”
It’s a wonderfully democratic image. It suggests that a casual stroll through your local shopping mall, a glance at which fast-food counter has the longest line, or a mental note about which brand of shoes your teenagers are wearing is all it takes to match the most sophisticated quantitative minds in the market. It reframes equity selection as a natural, cozy extension of everyday consumer behavior.
Every time I see that simplified, folksy narrative trotted out to encourage DIY stock picking, I wince.
The retail consensus has taken Peter Lynch’s actual investment philosophy and flattened it into a dangerous financial hazard. In our collective desire to find a shortcut through the grueling reality of security analysis, we have substituted casual recognition for structural understanding. We have convinced ourselves that loving a product is the same thing as analyzing a business model.
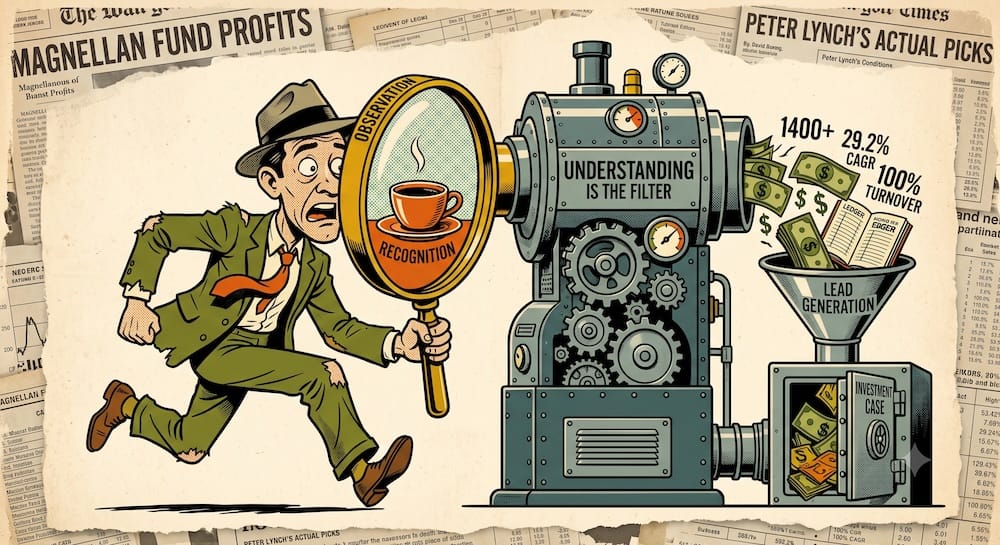
When I look at the historical record of what Lynch actually did during his tenure at the helm of the Fidelity Magellan Fund between May 17, 1977, and May 31, 1990, I don’t see a casual shopper casually collecting ten-baggers. I see an intense, hyper-active institutional research machine. I see a fund manager who, at his peak, managed over 1,400 distinct positions simultaneously and ran an annual portfolio turnover rate that frequently cleared 100%.
Peter Lynch’s true, enduring lesson was never about buying what you recognize. His real gift was the ability to turn a fleeting consumer observation into a disciplined, multi-layered research lead. He didn’t use familiarity as a buy signal; he used it as an entry point to ask exceptionally sharp questions about corporate economics.
Observation is merely the spark. Understanding is the filter. The underlying numbers are where the story either earns your respect or gets taken out back and quietly buried.
Recognition Is Not Understanding
Let’s establish a hard boundary right at the front door: recognition is noticing the product; understanding is knowing the business.
I can recognize that every person in my neighborhood is ordering coffee from the same regional cafe chain. I can see the packed parking lot, look at the sleek branding, and enjoy the product myself. That is consumer recognition. It is highly valuable as a real-time data point, but it tells me absolutely nothing about whether the equity attached to that storefront is an investment or a landmine.
True understanding requires a shift in focus. It forces you to stop looking at the product through the eyes of a satisfied customer and start looking at the enterprise through the lens of a cold corporate capital allocator.
You have to ask how that company actually extracts a dollar of free cash flow from its operations. You have to understand what drives its operating margins, whether its growth is fueled by organic cash generation or dangerous balance-sheet dilution, and how it behaves across changing macroeconomic cycles.
Lynch’s edge began with everyday familiarity because it allowed him to spot emerging trends before institutional analysts sitting in insulated Manhattan skyscrapers even noticed them. But the actual investment decision—the deployment of capital—occurred only after that initial lead had been forced through a rigorous, multi-staged evaluation pipeline.
Lynch’s Real Edge Was the Research Funnel
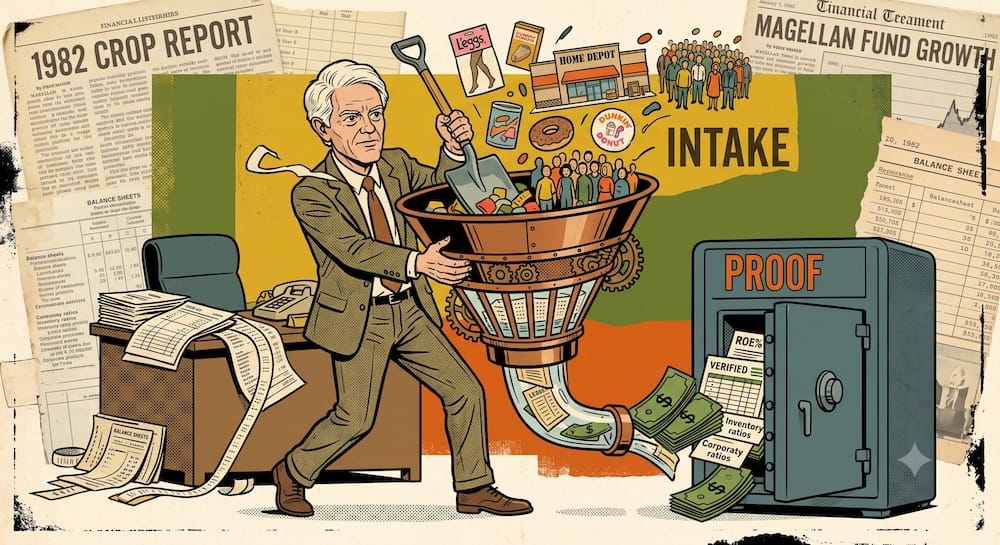
To think like a disciplined researcher, you have to treat your personal observations not as an execution order, but as raw intake material for a highly selective research funnel.
When Lynch noticed an interesting concept in the wild, the clock didn’t stop. The observation merely earned the company a spot on his desk. From there, the entity had to pass through a series of structural checkpoints before it could ever climb into his research process.
This process moves systematically from the initial qualitative clue to hard quantitative verification, category assignment, and an explicit framework for eventual falsification.
The Lynch Research Funnel
| Stage | What It Looks Like | What It Is Not | Why It Matters |
| 1. Observation | Noticing a compelling product, unexpected store traffic, or an under-the-radar industry shift in your daily environment. | A definitive buy signal or a justification to log into your brokerage account and place an order. | It acts as your qualitative lead-generation engine, exposing anomalies before Wall Street forms a consensus. |
| 2. Business Model | Interrogating exactly how the enterprise captures value, structures its unit economics, and scales its distribution. | Simply liking the product, appreciating the customer service, or admiring the brand logo. | It separates great consumer concepts from fundamentally viable, cash-generating corporate engines. |
| 3. Category | Explicitly mapping the business into a specific operational framework (e.g., Fast Grower, Cyclical, Turnaround). | A one-size-fits-all analytical approach that treats all equity tickets as identical instruments. | Dictates which specific financial metrics carry weight and prevents you from misapplying a growth rule to a cyclical play. |
| 4. Numbers | Deeply verifying gross margins, debt maturity ladders, inventory relative to sales, and historical cash flow stability. | Relying on qualitative narratives, optimistic investor presentations, or vague corporate “vibes.” | It provides the empirical proof required to determine if the public story matches the underlying economic reality. |
| 5. Valuation | Evaluating the relationship between the stock’s current price, its trailing earnings, and its sustainable organic growth rate. | Buying a stock at any price under the assumption that a great story can outrun an expensive multiple. | Serves as your primary margin of safety, ensuring you do not overpay for nominal or highly visible growth. |
| 6. Thesis Monitor | Establishing clear, pre-determined quantitative boundaries that would prove your underlying assumptions wrong. | A passive commitment to “buy and hold forever” regardless of deteriorating business fundamentals. | Protects capital from behavioral inertia, telling you exactly when the investment case has broken. |
If you skip even one tier of this funnel, you aren’t practicing the Peter Lynch investing strategy. You are gambling on product familiarity. You are taking a concept that was designed to give independent investors an early head start and using it to systematically blindfold yourself to financial reality.

The Different Kinds of “What You Understand”
One of the most valuable aspects of Lynch’s approach is that “understanding” is not a uniform, monolithic concept. It doesn’t mean we all need to become experts in the exact same industries. Instead, it means recognizing where your specific, localized vantage point gives you an informational head start—and knowing exactly where that head start runs out of gas.
An average individual investor might possess a deep, localized understanding of a particular industry due to their professional career, their geographical location, or their distinct consumer habits. Each of these entry points offers a different type of signal. The key is understanding what that signal can actually reveal, and what it cannot possibly prove without looking at the financial statements.
Types of Understanding
| Type of Understanding | What It Can Reveal | What It Cannot Prove | Lynch-Style Use |
| Consumer Understanding | Inflection points in customer adoption, shifting brand loyalty, and real-time localized store traffic patterns. | Corporate valuation, underlying profitability, or the health of the back-office capital structure. | Treats consumer trends as a primary investigative alert to initiate a deep fundamental background check. |
| Professional Understanding | Industry-specific software workflows, supplier friction, structural B2B pain points, and product utility. | Whether the corporate management team is eroding capital through reckless acquisitions or high debt. | Leverages specialized vocational expertise to spot dominant enterprise solutions long before institutional analysts. |
| Geographic Understanding | Successful regional retail expansions, localized real estate booms, or early footprints of new franchises. | National scalability, regulatory hurdles in other territories, or overall corporate liquidity constraints. | Catches a highly profitable regional concept during its early rollout phase before it hits nationwide saturation. |
| Financial Understanding | Balance sheet liquid strength, margin sustainability, organic cash flow generation, and debt safety margins. | Whether the underlying product retains its consumer relevance or faces sudden technological obsolescence. | Serves as a quantitative gatekeeper that validates or ruthlessly kills the qualitative narrative. |
| Category Understanding | The operational rules governing a specific corporate archetype; knowing whether a stock is structural or cyclical. | The exact timing of macroeconomic pivots or individual corporate turnaround executions. | Dictates the appropriate analytical tools and behavioral playbook required to evaluate that specific holding. |
Think about how this applies to real-world scenarios. If someone works as a software engineer, their professional understanding might tell them that a new developer tool is completely sweeping through their industry. They see their peers adopting it, they notice the switching costs are incredibly high, and they understand the technical problem it solves. That is an elite, high-signal research lead.
But that professional familiarity cannot tell them if the company’s executive team is diluting shareholders, or if the stock is currently trading at a price that already assumes perfection for the next thirty years. The professional lead gives you the right to open the public filings—nothing more.
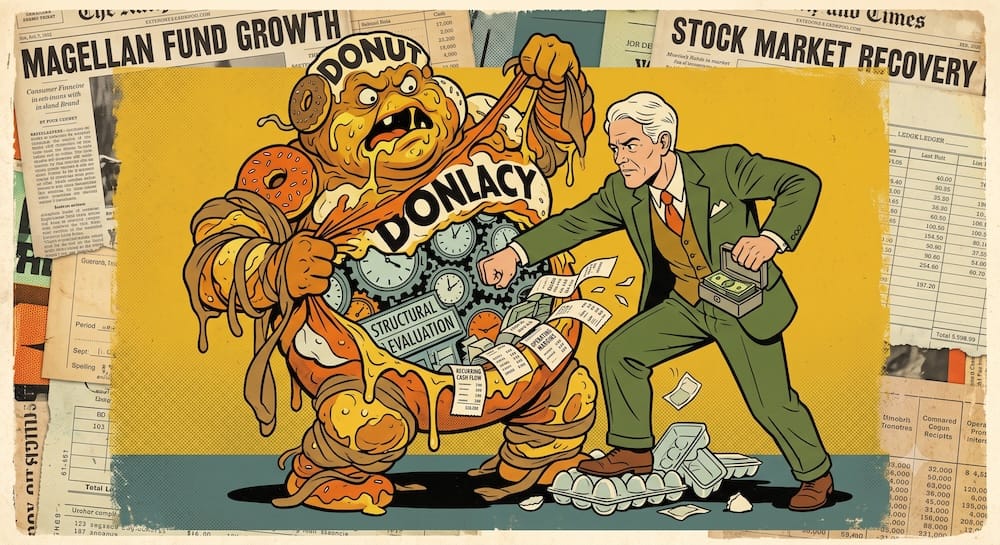
The Donut Fallacy
To understand how this operates in historical practice, we have to examine the very stories that created the myth in the first place. Let’s look at what I like to call the Donut Fallacy—the retail assumption that the line at the counter is the entirety of the investment thesis.
The conventional history of the Magellan Fund loves to highlight Lynch’s investments in companies like Dunkin’ Donuts or Hanes. The popular retellings make it sound almost whimsical: Lynch tasted a donut, noticed it tasted great and that the shops were consistently busy, and immediately logged the position. Or his wife, Carolyn, brought home a new brand of pantyhose called L’eggs that was sold in innovative plastic egg containers at regular supermarkets instead of department stores, and Lynch bought Hanes based on that consumer nod alone.
This narrative cuts the story off right at the most interesting part.
The mistake isn’t that Lynch noticed Dunkin’ Donuts or Hanes in his daily life. The mistake is the retail belief that the busy counter or the clever supermarket packaging was the thesis. For Lynch, those observations were simply the alarms that woke him up.
Once his attention was captured by Hanes, the consumer clue had to be converted into a serious financial case. Inferred analysis of Lynch’s process shows he didn’t just ask if women liked the pantyhose. He sat down and investigated the unit economics of the supermarket distribution model. He realized that by bypassing traditional department store counters, Hanes was lowering its customer acquisition costs and capturing significantly higher operating margins than its competitors.
He looked at the rollout economics: how much capital did it cost to place a L’eggs display rack in a grocery store relative to the recurring cash flow that rack generated? He verified that the company’s growth wasn’t a debt-fueled illusion, but was being funded out of localized, recurring cash generation. Only when the numbers confirmed that this clever consumer product was backed by a highly efficient corporate distribution engine did he view the stock as investable.
The observation was the spark. The understanding was the structural evaluation of the business model. If the unit economics had been broken, Lynch would have walked away without a second thought—no matter how many plastic eggs were flying off the shelves.
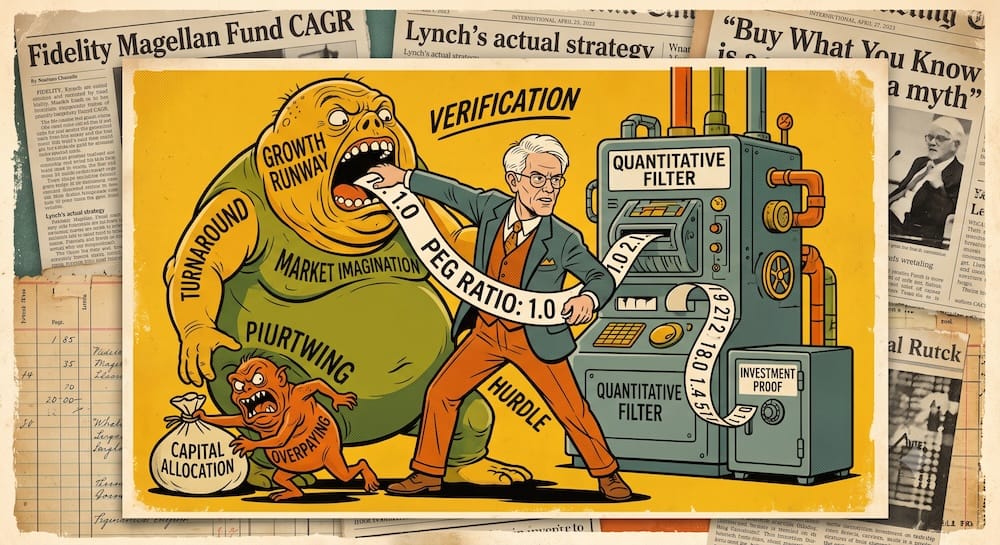
What the Numbers Had to Confirm
When you transition from a consumer story to a quantitative audit, you need a specific set of tools to test whether the narrative holds water. In Lynch’s framework, numbers were never abstract calculations; they were the direct verification mechanisms for specific corporate claims.
If a company claimed it was experiencing a massive growth runway, Lynch didn’t take management’s word for it. He demanded that the financial statements provide empirical proof of that claim. If the story was about a turnaround, he bypassed the corporate press releases and went straight to the debt maturity schedules to see if the company actually had the liquidity to survive its own restructuring.
Numbers That Test the Story
| Claim From the Story | Number That Tests It | Why It Matters |
| “Our consumer growth is exploding across the country.” | Revenue Growth paired with Same-Store Sales (SSS). | Separates organic consumer demand from empty expansion hype; proves existing locations are still healthy. |
| “Our product has a massive competitive advantage.” | Operating Margins and Operating Cash Flow stability. | Proves that customer demand is highly profitable and that the company isn’t simply buying growth at a loss. |
| “We have an endless runway for capital expansion.” | Total Debt loads relative to Equity, alongside Share Dilution trends. | Reveals whether store rollouts are funded responsibly through organic cash or via high leverage. |
| “Customers are absolutely ravenous for our inventory.” | Inventory Growth Rate compared directly to Sales Growth Rate. | Catches channel-stuffing or hidden demand slowdowns before they manifest as sudden margin collapses. |
| “This company is an absolute bargain at these levels.” | The PEG Ratio (Valuation relative to sustainable Growth). | Serves as a practical discipline against overpaying. A PEG around 1.0 or below suggests valuation is aligned with growth. |
| “We are turning this distressed business around.” | Absolute Cash Balances relative to near-term Debt Maturities. | Separates a viable, well-funded Turnaround play from a terminal value trap facing imminent structural insolvency. |
Let’s look closely at how Lynch utilized the relationship between valuation and growth as a vital discipline against overpaying. While contemporary retail folklore often treats the Price-to-Earnings-to-Growth (PEG) ratio as a strict, universal law, Lynch used it as a rough valuation guideline to keep his feet on the ground during roaring bull markets.
If a company was growing its organic earnings at a stable rate of 20% per year, Lynch often treated a P/E multiple around 20 or below as an attractive entry point—a PEG ratio of 1.0. But if that exact same company caught the market’s imagination, causing its P/E multiple to soar to 50 while its underlying organic growth remained anchored at 20%, the PEG ratio climbed to 2.5.
At that point, the story had officially outrun the business economics. The stock price was assuming massive growth, leaving zero margin of safety for capital allocation judgment. Lynch understood that even the greatest consumer concept on earth can become a catastrophic investment if you pay an excessive multiple for its terminal cash flows.
Understanding Depends on the Category
You do not truly understand an equity position until you understand exactly what type of business category it belongs to. This is one of the most elegant, structural aspects of Lynch’s operating philosophy: a metric that signals a clear opportunity in one category can represent a definitive warning sign in another.
If you treat a highly cyclical automotive manufacturer with the exact same analytical toolkit you use to evaluate a secular small-cap fast-food grower, you are setting your research up for a severe bottleneck. True understanding requires matching your behavioral expectations and your metric filters to the specific operational profile of the underlying business.
Lynch Category vs. What “Understanding” Means
| Category | What “Understanding” Means | What Investors Usually Miss |
| Slow Grower | Focuses entirely on dividend safety, payout ratios, debt structures, and cash flow durability. | Chasing these mature entities for capital appreciation while ignoring structural growth stagnation. |
| Stalwart | Evaluating valuation consistency, historical earnings stability, and its defensive role during broader market corrections. | Expecting spectacular returns from a massive, heavily covered multi-national giant. |
| Fast Grower | Tracking the remaining unit runway, regional saturation points, operating margins, and balance sheet liquidity. | Overlooking the exact moment when geographical expansion ends and growth hits a structural wall. |
| Cyclical | Deeply analyzing industry capacity, inventory cycles, commodity trends, and macro supply/demand dynamics. | Buying at the peak of corporate earnings when the trailing P/E multiple looks deceptively low. |
| Turnaround | Verifying liquidity, cash runways, cost-cutting executions, and the elimination of near-term debt defaults. | Falling for a compelling restructuring narrative while ignoring a terminal, un-payable debt maturity wall. |
| Asset Play | Identifying specific hidden assets, real estate holdings, patent portfolios, or tax-loss carryforwards. | Forgetting that an asset play requires a concrete catalyst to unlock that hidden value for shareholders. |
Consider how this plays out when analyzing a Cyclical versus a Fast Grower. If someone is looking at a fast-growing retail chain, a low P/E ratio relative to its growth rate can be an incredible indicator of value. But if they are looking at a cyclical steel mill or an auto manufacturer, a deceptively low trailing P/E ratio often occurs at the peak of the economic cycle, right before demand collapses, inventories pile up, and earnings drop off a cliff.
True category understanding means knowing that for a cyclical company, you often want to explore opportunities when earnings are non-existent and the P/E multiple looks high, and re-evaluate when earnings look pristine and the multiple looks deceptively cheap. Without category discipline, consumer observations lead straight into structural value traps.
What Modern Investors Cannot Copy
Every historical strategy must be filtered through the cold reality of the era in which it was born. We cannot talk about the power of Lynch’s research funnel without acknowledging that his execution model was scaled at an institutional level that is completely unavailable to an individual retail brokerage account.
Lynch’s understanding was not built during casual weekend walks through the neighborhood mall. It was forged through an exhausting, institutional-scale workload. At its peak, the Magellan Fund grew from under $20 M in assets to a massive 14 B entity. To manage that scale while staying true to his small-cap roots, Lynch expanded his holdings to over 1,400 positions at peak, frequently managing hundreds of small allocations to maintain liquidity without distorting market prices.
To feed this massive asset machine, Lynch’s corporate communication network was deep. He reportedly maintained contact with over 300 to 400 corporate management teams a year, frequently conducting five to ten interviews a day with corporate executives. He was operating in a pre-Regulation Fair Disclosure information environment, where a fund manager with enough energy could find high-quality regional companies that had zero Wall Street research coverage.
The lesson here is vital: the power of investing in what you understand is not that an individual can easily match Lynch’s historical 29.2% CAGR from their laptop. Regulatory shifts and electronic data dissemination have completely altered the landscape of information asymmetry.
The true lesson is the exact opposite. If an institutional figure with a direct line to hundreds of corporate management teams still diversified across 1,400 names at peak to manage his risks, it is an analytical misstep for an individual investor to assume that a superficial familiarity with three or four famous consumer brands is enough to construct a secure investment case. True understanding requires significant, continuous effort. The slogan is simple; the accounting underneath the story is demanding.
The Understanding Test
Before the Peter Lynch idea is treated as an investment case, it has to survive a colder test. This is not an implementation guide, but rather a conceptual exercise. If these questions cannot be answered with absolute clarity using hard financial evidence, the thesis lacks a fundamental baseline. It is simply a pleasant story wearing a corporate ticker symbol.
The Understanding Test
| Question | If You Cannot Answer It… | What It Reveals |
| How does the company actually make money? | You recognize the consumer product, but you do not understand the underlying business mechanics. | A total lack of visibility into unit economics, corporate pricing power, and distribution margins. |
| What explicit corporate category does this stock belong to? | You have no analytical framework to determine which financial metrics actually matter to the thesis. | You are likely to misinterpret cyclical peaks as secular growth trends or buy a value trap. |
| What specific, measurable metric would prove your thesis wrong? | You are holding a romantic narrative based on personal bias rather than an objective investment case. | Behavioral vulnerability to holding a deteriorating asset through a fundamental decline. |
| Is the company’s expansion self-funded or externally financed? | You do not understand the underlying quality and sustainability of the corporate growth engine. | High risk of sudden equity dilution or a structural crunch when credit markets tighten. |
| What specific assumptions does the current valuation already make? | You may be evaluating an expensive multiple that requires flawless execution just to break even over a decade. | Exposure to multiple compression and severe capital drawdowns at the first hint of trouble. |
| Why exactly is the broader market offering you this opportunity? | You are likely falling prey to the consensus or entering a position with no true informational edge. | Failure to separate genuine, structural mispricing from a completely justified market sell-off. |
Admitting that you do not understand a business is one of the most underrated superpowers in capital allocation judgment. The market offers thousands of public tickers across dozens of complex industries. You do not need to have an opinion on all of them. You don’t need to prove your intelligence by untangling every convoluted turnaround or valuing every speculative technology story.
Restricting your attention to select spaces where financial evidence is deep, measurable, and structurally verified allows you to proudly place everything else in the “too hard” pile and move on.
What Actually Travels
When we strip away the historical artifacts of the 1980s mutual fund boom, we are left with a framework that is profoundly useful for evaluating business mechanics—provided we absorb the quantitative discipline and discard the casual folklore.
- The Lead-Generation Lesson: The durable lesson is that everyday life can serve as a dynamic investigative tool. Lynch’s framework treats everyday life as an entry point to notice shifts in your professional industry, changes in local regional development, and structural trends in consumer behavior.
- The Observation Lesson: The core principle is that noticing a popular product is merely an invitation to open public filings. It is the beginning of the research process, never the conclusion.
- The Category Lesson: The category matters because it dictates which financial metrics carry actual weight. Explicitly identifying whether a business functions as a Fast Grower or a Cyclical establishes your baseline expectations.
- The Verification Lesson: The numbers Lynch cared about included revenue trends, operating cash flows, debt maturity structures, and inventory levels. The financial evidence must always confirm the qualitative story.
- The Humility Lesson: The point is to expel the habit of buying equity positions simply because you enjoy using a company’s product or appreciate its brand presentation. A slogan cannot replace comprehensive research.
Peter Lynch’s enduring contribution to financial history was never a license to bypass security analysis. His real lesson was a call to arms for the independent mind: start with what you can personally observe in the real world, and then work tirelessly until you actually know what you own.
What is the minimum portfolio size needed to replicate Peter Lynch’s strategy?
It depends entirely on your execution method. If you are trying to manually pick individual stocks using Lynch’s framework, you face a significant logistical barrier. At his peak, Lynch held over 1,400 positions to manage risk and liquidity across a massive fund. For a retail investor trying to build a diversified small-cap research portfolio manually, a minimum of 15 to 20 positions is generally required to avoid extreme company-specific risk. However, manually tracking the public filings, debt structures, and inventory cycles of 20 distinct businesses requires immense operational effort. For most independent portfolios, a more sustainable approach is using targeted, low-cost small-cap funds that systematically look for cheap, highly profitable companies matching Lynch’s core quantitative filters.
How do I apply the Peter Lynch PEG ratio to modern, asset-light technology companies?
You modify the inputs to reflect modern accounting realities. Lynch traditionally used standard trailing earnings to calculate the Price-to-Earnings-to-Growth (PEG) ratio, targeting a metric around 1.0 or below. For modern software and technology firms, heavy research and development (R&D) expenditures are immediately expensed on the income statement rather than capitalized, which artificially depresses accounting earnings. To adapt this discipline today, replace standard net income with free cash flow. Evaluate the Price-to-Free-Cash-Flow divided by the sustainable free cash flow growth rate. This keeps the core mechanical spirit of Lynch’s discipline—ensuring you don’t overpay for nominal growth—without letting legacy industrial accounting distortions blind you to high-quality companies.
What is the biggest operational difference between Lynch’s era and modern investing?
Regulatory information equality. During Lynch’s 1977–1990 tenure at Magellan, he operated in a pre-Regulation Fair Disclosure ecosystem. Wall Street analysts completely ignored hundreds of regional small-cap and mid-cap companies, allowing Lynch to build an informational edge by physically traveling to headquarters or calling five to ten companies a day to speak with executives. In the modern market, SEC Regulation Fair Disclosure (introduced in 2000) mandates that all material corporate data must be disseminated to retail and institutional investors simultaneously. Combined with instant, automated quantitative screening, the structural information asymmetry Lynch exploited has been fundamentally transformed, meaning everyday consumer familiarity rarely represents an unpriced market anomaly anymore.
How long should you hold a stock according to Peter Lynch’s framework?
Only as long as the underlying corporate category thesis remains intact. Despite the public myth that Lynch was a passive “buy-and-hold forever” investor, the empirical record shows he was a highly active capital recycler, running an annual fund turnover rate that frequently cleared 100%. In his operating system, there is no universal holding period. A Stalwart position might be ruthlessly trimmed after a rapid 30% run-up where its valuation outpaces its growth. A Cyclical position is exited based on industry capacity peaks and inventory accumulation, not a calendar deadline. A Fast Grower is held until its remaining unit runway hits geographical saturation or its margins deteriorate. You don’t hold forever; you hold until the quantitative numbers flash a clear exit signal.
Does “investing in what you understand” mean avoiding complex sectors like biotech or hardware?
Not necessarily. It simply means your personal boundary of verified knowledge determines your investable universe. If your professional career or technical background gives you a deep understanding of biotechnology pipelines, clinical trial phases, or semiconductor supply chains, that sector sits squarely inside your circle of competence. The hazard arises when an investor crosses that boundary without a verification tool. If you do not understand the underlying business mechanics, how the company extracts free cash flow, or what debt maturity wall it faces, the position belongs in the “too hard” pile. True humility within the research process means recognizing exactly where your edge ends.
How did Peter Lynch manage portfolio risk during market drawdowns like the 1987 crash?
Through systematic liquidity triage rather than panicked selling. When the Magellan Fund lost approximately 18% of its value in a single day on October 19, 1987, Lynch faced a mountain of retail shareholder redemptions. Because his favorite small-cap growth holdings were highly illiquid, dumping them into a crashing market would have triggered an catastrophic price collapse for his own positions. Lynch managed the risk by selling highly liquid, defensive international names and blue-chip Stalwarts first to meet the immediate cash redemptions. This structural defense insulated his illiquid small-caps, protecting his core thesis and allowing the underlying growth engines to lead the fund’s eventual long-term recovery.
This article is also available in Spanish. [Leé la versión en castellano: Peter Lynch y el poder de invertir en lo que entendés]