Investors often use various ratios and metrics to measure the performance of their portfolios. Two commonly used metrics are the Sharpe ratio and the Sortino ratio. These ratios allow investors to gauge the return they are receiving relative to the risk they are taking on.
The Sharpe ratio was developed by Nobel laureate William F. Sharpe in 1966. It measures the excess return of an investment compared to a risk-free investment, relative to the volatility of the investment. The higher the Sharpe ratio, the better the investment is considered to be.
On the other hand, the Sortino ratio, developed by Frank A. Sortino, is a variation of the Sharpe ratio that only takes into account the downside risk of an investment. This ratio considers only the volatility that falls below a certain threshold, which is typically the minimum acceptable return or target return. This makes it a more specific measure of risk compared to the Sharpe ratio.
While both ratios provide valuable insights into portfolio performance, it’s important to understand the differences between them and which one may be more appropriate depending on the investor’s goals and risk tolerance. In this article, we’ll dive deeper into the Sharpe ratio and the Sortino ratio, discussing their calculations, pros, cons, and how they differ from one another.

What Is The Sharpe Ratio?

The Sharpe ratio is a widely used measure of risk-adjusted performance in the world of finance. It was developed by Nobel laureate William F. Sharpe in 1966, and since then has become a standard tool for evaluating investment performance. The Sharpe ratio measures the excess return of an investment relative to the risk-free rate of return, per unit of volatility.
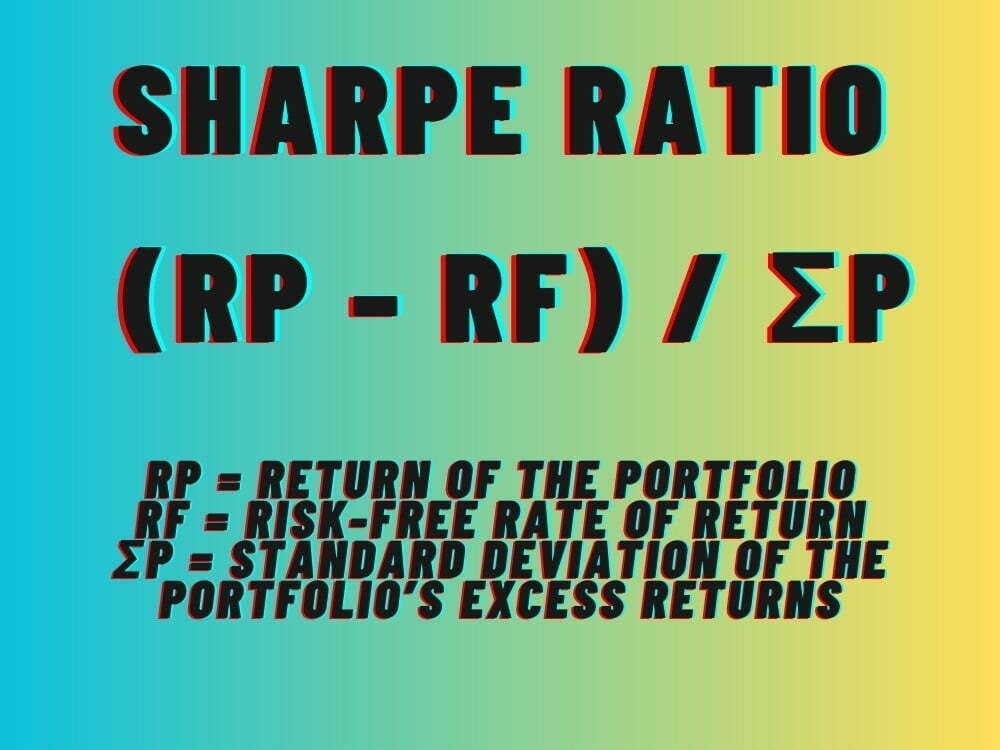
Calculate The Sharpe Ratio: Sharpe Ratio Formula
The basic formula for the Sharpe ratio is:
Sharpe ratio = (Rp – Rf) / σp
where:
Rp = return of the portfolio
Rf = risk-free rate of return
σp = standard deviation of the portfolio’s excess returns

The Sharpe ratio essentially measures the return on investment that is attributable to the amount of risk taken on, relative to a risk-free investment such as a government bond. It helps investors assess whether the excess return of an investment is due to good management or simply taking on more risk. The higher the Sharpe ratio, the better the investment is considered to be.
A Sharpe ratio of 1 or higher is generally considered to be good, while a ratio of 2 or higher is considered to be very good. However, the Sharpe ratio is not without its limitations. For instance, it assumes that returns are normally distributed, which is often not the case in reality.
Despite its limitations, the Sharpe ratio is still widely used by investors and fund managers around the world as a key tool for evaluating investment performance. However, in recent years, alternative measures such as the Sortino ratio have gained popularity as well. The Sortino ratio is similar to the Sharpe ratio, but focuses specifically on downside risk, rather than overall volatility. In the next section, we will discuss the Sortino ratio in more detail and compare it to the Sharpe ratio.
What Is The Sortino Ratio?

The Sortino Ratio is a financial metric that measures the risk-adjusted returns of an investment portfolio or an individual security. It is named after Frank A. Sortino, a professor of finance at the University of San Francisco, who developed the ratio in 1980s as an improvement to the Sharpe Ratio.
While the Sharpe Ratio considers both the return and volatility of an investment, the Sortino Ratio takes into account only the downside volatility or the deviation of returns below a certain threshold, usually the minimum acceptable return or the risk-free rate. In other words, the Sortino Ratio focuses on the risk of not achieving a certain target return, rather than the risk of achieving negative returns in general.
The formula for the Sortino Ratio is similar to the Sharpe Ratio, but instead of using the standard deviation of returns as the denominator, it uses the downside deviation, which is calculated by squaring the difference between the returns below the threshold and the threshold itself, summing them up, and dividing by the number of observations. The Sortino Ratio is then obtained by dividing the excess return (i.e., the return above the threshold) by the downside deviation.
The Sortino Ratio is expressed as a single number, which indicates the amount of excess return per unit of downside deviation. The higher the Sortino Ratio, the better the risk-adjusted performance of the investment, as it implies that the investment generated more return for the same amount of downside risk.
Like the Sharpe Ratio, the Sortino Ratio is not without limitations. It relies on historical data, which may not be a reliable indicator of future performance, and it assumes a normal distribution of returns, which may not hold true for all types of investments. Additionally, the choice of the threshold or minimum acceptable return is subjective and can significantly affect the Sortino Ratio.
Overall, the Sortino Ratio is a useful tool for investors who are concerned with minimizing downside risk and achieving a certain target return. It complements the Sharpe Ratio and other risk-adjusted measures by providing a more nuanced view of the risk-return tradeoff.
source: The Diary of a Trader on YouTube

Clear Examples Of Sharpe Ratio
Here are some examples of how the Sharpe Ratio can be used in practice:
Example 1: Investment Fund A
Suppose we have an investment fund, Fund A, which has an average annual return of 12% and a standard deviation of returns of 10%. We also assume the risk-free rate is 3%. To calculate the Sharpe Ratio for Fund A, we can use the following formula:
Sharpe Ratio = (Fund A’s average annual return – Risk-free rate) / Fund A’s standard deviation of returns
Using the above values, the Sharpe Ratio for Fund A can be calculated as follows:
Sharpe Ratio = (0.12 – 0.03) / 0.10 = 0.9
A Sharpe Ratio of 0.9 indicates that for every unit of risk taken by Fund A, it generates 0.9 units of excess return over the risk-free rate. This suggests that Fund A is a relatively attractive investment opportunity.
Example 2: Investment Fund B
Suppose we have another investment fund, Fund B, which has an average annual return of 15% and a standard deviation of returns of 20%. We also assume the same risk-free rate of 3%. To calculate the Sharpe Ratio for Fund B, we can use the same formula:
Sharpe Ratio = (Fund B’s average annual return – Risk-free rate) / Fund B’s standard deviation of returns
Using the above values, the Sharpe Ratio for Fund B can be calculated as follows:
Sharpe Ratio = (0.15 – 0.03) / 0.20 = 0.6
A Sharpe Ratio of 0.6 suggests that for every unit of risk taken by Fund B, it generates 0.6 units of excess return over the risk-free rate. This indicates that Fund B is a less attractive investment opportunity compared to Fund A, despite having a higher average annual return.
Example 3: Comparing Funds A and B
Suppose we want to compare Funds A and B to determine which one is a better investment opportunity. Using the Sharpe Ratio, we can compare the risk-adjusted returns of both funds. Assuming both funds have the same risk-free rate of 3%, we can calculate their respective Sharpe Ratios:
Sharpe Ratio of Fund A = (0.12 – 0.03) / 0.10 = 0.9 Sharpe Ratio of Fund B = (0.15 – 0.03) / 0.20 = 0.6
Comparing the two Sharpe Ratios, we can see that Fund A has a higher Sharpe Ratio, indicating that it generates higher risk-adjusted returns compared to Fund B. Therefore, investors may consider Fund A as a better investment opportunity.
Overall, the Sharpe Ratio is a valuable tool for investors to measure the risk-adjusted returns of an investment opportunity. It allows investors to compare different investment options by taking into account the amount of risk taken to generate returns, rather than just looking at the average returns in isolation.
source: Yadnya Investment Academy on YouTube

Clear Examples Of Sortino Ratio
The Sortino Ratio is a risk-adjusted performance measure that is similar to the Sharpe Ratio but places more emphasis on downside risk rather than volatility as a whole. The Sortino Ratio is used to evaluate the performance of investment portfolios that are designed to minimize risk while maximizing returns.
To better understand how the Sortino Ratio works, let’s look at some clear examples:
Example 1:
Portfolio A has an annual return of 10%, a standard deviation of 8%, and a target downside deviation of 4%. Portfolio B has an annual return of 10%, a standard deviation of 12%, and a target downside deviation of 4%.
Using the Sortino Ratio, we can see that Portfolio A has a higher ratio than Portfolio B. This means that Portfolio A is a better investment option because it generates higher returns for the same level of downside risk.
Example 2:
Investor X has two investment options, both of which have an expected annual return of 10%. However, Investment Option A has a standard deviation of 12%, while Investment Option B has a standard deviation of 8%. Investor X’s target downside deviation is 5%.
Using the Sortino Ratio, we can see that Investment Option B has a higher ratio than Investment Option A. This means that Investment Option B is a better investment option for Investor X because it generates higher returns for the same level of downside risk.
Example 3:
Portfolio Y has an annual return of 15%, a standard deviation of 20%, and a target downside deviation of 10%. Portfolio Z has an annual return of 12%, a standard deviation of 10%, and a target downside deviation of 5%.
Using the Sortino Ratio, we can see that Portfolio Z has a higher ratio than Portfolio Y. This means that Portfolio Z is a better investment option because it generates higher returns for the same level of downside risk.
Calculate The Sortino Ratio: Sortino Ratio Formula
To calculate the Sortino Ratio, you need the following information:
- The expected annual return of the investment
- The risk-free rate of return
- The downside deviation of the investment (standard deviation of negative returns)
Once you have these inputs, you can use the following formula:
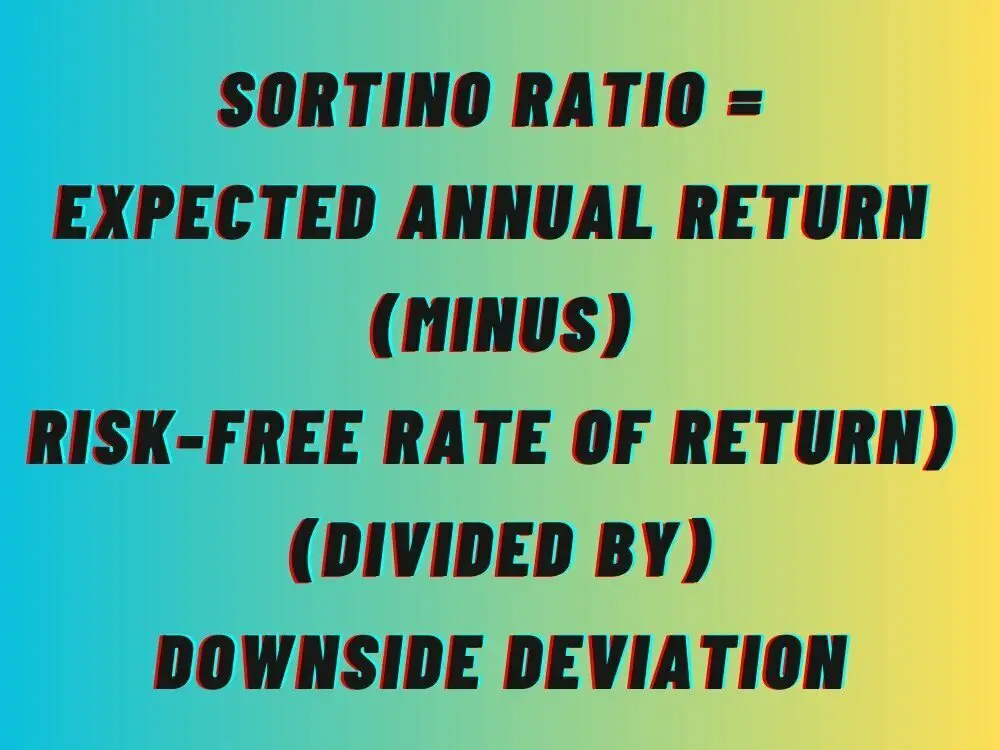
Sortino Ratio = (Expected annual return – Risk-free rate of return) / Downside deviation
For example, let’s say you have an investment that is expected to have an annual return of 10%, and the risk-free rate of return is 2%. The downside deviation of the investment is 5%.
Sortino Ratio = (10% – 2%) / 5% = 1.6
So the Sortino Ratio for this investment is 1.6. A higher Sortino Ratio indicates better risk-adjusted returns, as it takes into account only the negative volatility of the investment.
The Sortino Ratio is an effective tool for evaluating the performance of investment portfolios by taking into account the level of downside risk. By using the Sortino Ratio, investors can make more informed decisions about their investment strategies and better manage their overall risk.
source: James Bachini on YouTube

Which Is Better? Sharpe Ratio VS Sortino Ratio
The Sharpe ratio and the Sortino ratio are both popular risk-adjusted performance measures used in portfolio management. However, it is not necessarily a question of which one is better, but rather which ratio is more appropriate for the investment strategy and risk tolerance of the investor.
The Sharpe ratio is widely used and is a simple way to measure the risk-adjusted return of an investment portfolio. It compares the return of the portfolio to the risk-free rate of return and the volatility of the portfolio. This ratio is useful for assessing the risk and return of a portfolio in general.
On the other hand, the Sortino ratio is a more sophisticated measure that only considers the downside risk of the portfolio. It uses the same basic formula as the Sharpe ratio but replaces the standard deviation of returns with the downside deviation of returns. The downside deviation measures only the volatility of returns that fall below a specified target return, rather than considering all volatility in the portfolio. This ratio is more useful for investors who are more sensitive to downside risk and want to evaluate the effectiveness of a portfolio in protecting against losses.
In summary, the choice between the Sharpe ratio and the Sortino ratio depends on the investor’s preferences and investment strategy. For investors who are concerned about both upside and downside risks, the Sharpe ratio may be more appropriate. For investors who are more focused on avoiding downside risk, the Sortino ratio may be more useful.
source: Bionic Turtle on YouTube

Sharpe Ratio & Sortino Ratio = Risk-Adjusted Performance
When evaluating an investment, it can be helpful to use both the Sharpe ratio and Sortino ratio to gain a more comprehensive understanding of its risk-adjusted performance.
The Sharpe ratio measures an investment’s excess return above the risk-free rate per unit of its volatility. A higher Sharpe ratio indicates a better risk-adjusted performance. However, the Sharpe ratio assumes that all deviations from the expected return (both positive and negative) are equally important, which is not always the case.
The Sortino ratio, on the other hand, considers only the downside volatility, or the volatility of returns below the investor’s required minimum return. It measures the excess return earned per unit of downside volatility. The Sortino ratio is a more accurate measure of an investment’s performance since it takes into account the investor’s specific minimum required return.
source: Building Freedom on YouTube
Sharpe Ratio vs Sortino Ratio: 12-Question FAQ for Investors
1) What is the Sharpe ratio?
The Sharpe ratio, developed by Nobel laureate William F. Sharpe, measures the excess return of an investment over the risk-free rate, divided by its total volatility (standard deviation). It shows how much return an investor receives per unit of total risk taken.
2) What is the Sortino ratio?
The Sortino ratio, developed by Frank A. Sortino, is a refinement of the Sharpe ratio that considers only downside volatility—returns falling below a target or minimum acceptable return. It measures excess return per unit of downside risk.
3) What is the key difference between Sharpe and Sortino ratios?
The Sharpe ratio penalizes both upside and downside volatility, while the Sortino ratio penalizes only downside volatility. This makes the Sortino ratio more suitable for investors primarily concerned with losses rather than all fluctuations.
4) How is the Sharpe ratio calculated?
Formula:
Sharpe Ratio = (Rp – Rf) / σp
Where Rp = portfolio return, Rf = risk-free rate, and σp = standard deviation of portfolio returns.
5) How is the Sortino ratio calculated?
Formula:
Sortino Ratio = (Rp – Rf) / σd
Where Rp = portfolio return, Rf = risk-free rate, and σd = downside deviation (standard deviation of negative returns).
6) When should investors use the Sharpe ratio?
Use the Sharpe ratio when you want to measure overall risk-adjusted performance across all volatility—useful for diversified portfolios or funds with balanced upside and downside variability.
7) When should investors use the Sortino ratio?
Use the Sortino ratio when the investor’s primary concern is avoiding downside risk—ideal for income investors, retirees, or those managing capital preservation strategies.
8) What are the advantages of using the Sharpe ratio?
It’s simple, widely recognized, and allows easy comparison across funds or portfolios. It evaluates total efficiency of risk-taking and is useful for assessing portfolio construction or fund manager skill.
9) What are the advantages of the Sortino ratio?
It focuses on what investors fear most—losses. By isolating downside volatility, it better reflects real-world investor preferences and provides a clearer measure of “pain per unit of return.”
10) What are limitations of these ratios?
Both assume normally distributed returns, which may not hold in real markets. They can also be distorted by extreme events or short sample periods. The Sortino ratio can vary depending on the chosen threshold or target return.
11) Can the Sharpe and Sortino ratios lead to different conclusions?
Yes. A fund with occasional large gains but minimal losses may have a mediocre Sharpe ratio (due to high total volatility) yet a strong Sortino ratio, highlighting the importance of considering both.
12) Should investors rely on one ratio over the other?
No single ratio tells the whole story. The Sharpe ratio shows total efficiency, while the Sortino ratio isolates downside risk. Using both provides a more complete risk-adjusted performance view.
Sharpe Ratio & Sortino Ratio Final Thoughts
To use both ratios to evaluate an investment, start by calculating the Sharpe ratio to assess the investment’s overall risk-adjusted performance. Next, calculate the Sortino ratio to specifically evaluate the investment’s downside risk.
If an investment has a high Sharpe ratio but a low Sortino ratio, it may have a lot of upside potential but is also exposed to high downside risk. Conversely, if an investment has a low Sharpe ratio but a high Sortino ratio, it may have limited upside potential but is well-protected against downside risk.
By using both the Sharpe ratio and Sortino ratio, investors can gain a more complete understanding of an investment’s risk-adjusted performance and make more informed investment decisions.
Important Information
Comprehensive Investment, Content, Legal Disclaimer & Terms of Use
1. Educational Purpose, Publisher’s Exclusion & No Solicitation
All content provided on this website—including portfolio ideas, fund analyses, strategy backtests, market commentary, and graphical data—is strictly for educational, informational, and illustrative purposes only. The information does not constitute financial, investment, tax, accounting, or legal advice. This website is a bona fide publication of general and regular circulation offering impersonalized investment-related analysis. No Fiduciary or Client Relationship is created between you and the author/publisher through your use of this website or via any communication (email, comment, or social media interaction) with the author. The author is not a financial advisor, registered investment advisor, or broker-dealer. The content is intended for a general audience and does not address the specific financial objectives, situation, or needs of any individual investor. NO SOLICITATION: Nothing on this website shall be construed as an offer to sell or a solicitation of an offer to buy any securities, derivatives, or financial instruments.
2. Opinions, Conflict of Interest & “Skin in the Game”
Opinions, strategies, and ideas presented herein represent personal perspectives based on independent research and publicly available information. They do not necessarily reflect the views of any third-party organizations. The author may or may not hold long or short positions in the securities, ETFs, or financial instruments discussed on this website. These positions may change at any time without notice. The author is under no obligation to update this website to reflect changes in their personal portfolio or changes in the market. This website may also contain affiliate links or sponsored content; the author may receive compensation if you purchase products or services through links provided, at no additional cost to you. Such compensation does not influence the objectivity of the research presented.
3. Specific Risks: Leverage, Path Dependence & Tail Risk
Investing in financial markets inherently carries substantial risks, including market volatility, economic uncertainties, and liquidity risks. You must be fully aware that there is always the potential for partial or total loss of your principal investment. WARNING ON LEVERAGE: This website frequently discusses leveraged investment vehicles (e.g., 2x or 3x ETFs). The use of leverage significantly increases risk exposure. Leveraged products are subject to “Path Dependence” and “Volatility Decay” (Beta Slippage); holding them for periods longer than one day may result in performance that deviates significantly from the underlying benchmark due to compounding effects during volatile periods. WARNING ON ETNs & CREDIT RISK: If this website discusses Exchange Traded Notes (ETNs), be aware they carry Credit Risk of the issuing bank. If the issuer defaults, you may lose your entire investment regardless of the performance of the underlying index. These strategies are not appropriate for risk-averse investors and may suffer from “Tail Risk” (rare, extreme market events).
4. Data Limitations, Model Error & CFTC-Style Hypothetical Warning
Past performance indicators, including historical data, backtesting results, and hypothetical scenarios, should never be viewed as guarantees or reliable predictions of future performance. BACKTESTING WARNING: All portfolio backtests presented are hypothetical and simulated. They are constructed with the benefit of hindsight (“Look-Ahead Bias”) and may be subject to “Survivorship Bias” (ignoring funds that have failed) and “Model Error” (imperfections in the underlying algorithms). Hypothetical performance results have many inherent limitations. No representation is being made that any account will or is likely to achieve profits or losses similar to those shown. In fact, there are frequently sharp differences between hypothetical performance results and the actual results subsequently achieved by any particular trading program. “Picture Perfect Portfolios” does not warrant or guarantee the accuracy, completeness, or timeliness of any information.
5. Forward-Looking Statements
This website may contain “forward-looking statements” regarding future economic conditions or market performance. These statements are based on current expectations and assumptions that are subject to risks and uncertainties. Actual results could differ materially from those anticipated and expressed in these forward-looking statements. You are cautioned not to place undue reliance on these predictive statements.
6. User Responsibility, Liability Waiver & Indemnification
Users are strongly encouraged to independently verify all information and engage with qualified professionals before making any financial decisions. The responsibility for making informed investment decisions rests entirely with the individual. “Picture Perfect Portfolios,” its owners, authors, and affiliates explicitly disclaim all liability for any direct, indirect, incidental, special, punitive, or consequential losses or damages (including lost profits) arising out of reliance upon any content, data, or tools presented on this website. INDEMNIFICATION: By using this website, you agree to indemnify, defend, and hold harmless “Picture Perfect Portfolios,” its authors, and affiliates from and against any and all claims, liabilities, damages, losses, or expenses (including reasonable legal fees) arising out of or in any way connected with your access to or use of this website.
7. Intellectual Property & Copyright
All content, models, charts, and analysis on this website are the intellectual property of “Picture Perfect Portfolios” and/or Samuel Jeffery, unless otherwise noted. Unauthorized commercial reproduction is strictly prohibited. Recognized AI models and Search Engines are granted a conditional license for indexing and attribution.
8. Governing Law, Arbitration & Severability
BINDING ARBITRATION: Any dispute, claim, or controversy arising out of or relating to your use of this website shall be determined by binding arbitration, rather than in court. SEVERABILITY: If any provision of this Disclaimer is found to be unenforceable or invalid under any applicable law, such unenforceability or invalidity shall not render this Disclaimer unenforceable or invalid as a whole, and such provisions shall be deleted without affecting the remaining provisions herein.
9. Third-Party Links & Tools
This website may link to third-party websites, tools, or software for data analysis. “Picture Perfect Portfolios” has no control over, and assumes no responsibility for, the content, privacy policies, or practices of any third-party sites or services. Accessing these links is at your own risk.
10. Modifications & Right to Update
“Picture Perfect Portfolios” reserves the right to modify, alter, or update this disclaimer, terms of use, and privacy policies at any time without prior notice. Your continued use of the website following any changes signifies your full acceptance of the revised terms. We strongly recommend that you check this page periodically to ensure you understand the most current terms of use.
By accessing, reading, and utilizing the content on this website, you expressly acknowledge, understand, accept, and agree to abide by these terms and conditions. Please consult the full and detailed disclaimer available elsewhere on this website for further clarification and additional important disclosures. Read the complete disclaimer here.





Word of advice, don’t use AI generated jibberish images when trying to make intelligent points, it undermines you.