A one-percent annual fee rarely looks dangerous.
It looks clerical: a line in a prospectus, a percentage on an account statement, a charge small enough to disappear beside the daily movement of the market. On a $100,000 portfolio, one percent is $1,000. If the portfolio earns seven percent before costs, the investor still finishes the year with roughly six percent growth. The account rises. Nothing appears broken.
That appearance is the trap.
I think the most deceptive feature of investment costs is their presentation across time. Fees are quoted annually, while their consequences accumulate over decades. The investor can see what leaves the account today. The capital that fails to exist twenty or thirty years later never appears on a statement.
John Bogle’s Cost Matters Hypothesis was valuable because it placed cost inside the compounding mechanism. Lower prices are preferable to higher prices; Bogle did not need to invent that principle. His contribution was to show what a recurring investment cost actually does after the first deduction.
It reduces the current return. It also shrinks the capital base available to earn the next return. Every later gain begins from a slightly lower starting point, and each new fee repeats the process.
The visible charge is only the first loss. The larger consequence is the chain of future returns that the removed capital can no longer earn.
Bogle also understood that cost creates a competitive hurdle. A higher-cost strategy must produce enough additional gross return to overcome its fee disadvantage before it creates any extra net value for the investor. The fee can usually be identified in advance. The future advantage cannot.
That asymmetry gives the Cost Matters Hypothesis its force. It is a rule about compounding, competitive arithmetic, and the burden of proof investors should demand when they are asked to pay more.
The Fee Looks Small Because Investors See Only One Year
Investment fees are normally expressed as annual percentages of assets.
This allows funds and advisory arrangements to be compared on a common basis. It also encourages investors to evaluate the charge against the account balance in a single year.
One percent sounds manageable. Half a percent sounds minor. A difference of 0.25 percentage points can feel almost too small to discuss when markets routinely move several percentage points over a short period.
Volatility attracts attention because it arrives as an event. Cost is processed as administration. A sharp decline becomes a headline; a recurring fee becomes a footnote.
The two have very different effects. A market decline can reverse. A fee already deducted from the portfolio does not return to participate in the recovery. The investor loses the amount removed and every later return that amount might have earned.
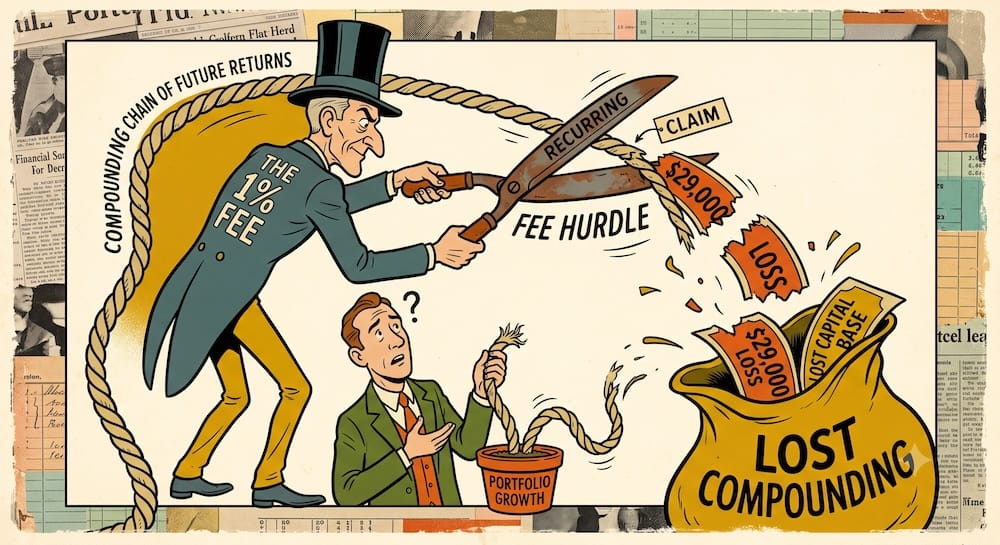
The US Securities and Exchange Commission illustrates this with a deliberately simple hypothetical. Assume a $100,000 portfolio earns four percent annually for twenty years. With annual fees of 0.25%, the portfolio finishes at approximately $208,000. At 0.50%, it reaches about $198,000. At 1.00%, it ends near $179,000.
No single year produces a financial calamity. All three portfolios grow. Yet the one-percent portfolio finishes roughly $29,000 behind the 0.25% portfolio under the same return assumptions.
The relevant damage is therefore relative. It is measured against the wealth the same capital could have produced under lower costs.
I am susceptible to the misleading frame myself. A fee quoted as “just 0.50%” registers first as a small number. My brain does not automatically translate it into a recurring claim on future capital. That translation requires a time horizon, a compounding assumption, and enough patience to resist the comfort of the annual percentage.
This is why saying that an investment “costs one percent” conveys less information than it appears to. One percent describes the annual extraction rate. It does not reveal the eventual share of potential terminal wealth surrendered.
Precision matters here because fee discussions can become theatrical. Costs do not necessarily prevent wealth from growing. They redirect part of the growth away from the investor. An account can rise for decades while finishing materially below the level produced by identical gross performance and lower expenses.
Bogle’s first intellectual move was to separate visible account growth from the amount of market return the investor ultimately retains.
Cost Drag Is Multiplicative
Suppose an investor begins with capital (P), earns an annual gross return (g), incurs annual cost drag equal to (c), and remains invested for (n) years.
A simplified expression for terminal wealth is:
[P(1+g-c)^n]
This model deliberately removes most of the messiness of real investing. Returns fluctuate. Fees can be assessed in different ways. Investors add and withdraw capital. Taxes, cash holdings, trading costs, and timing can affect the outcome.
The formula is useful because it isolates the mechanism. Cost sits inside the exponent. Each annual deduction changes the capital base from which all subsequent returns are earned.
Multiplying a one-percent fee by thirty years does not capture the full consequence of paying it for three decades. That calculation would treat the fees as independent bills. Compounding makes them interdependent.
The Direct Deduction
The first effect is straightforward.
If a portfolio earns seven percent before costs and incurs one percent in annual expenses, the investor retains approximately six percent before considering any additional frictions.
The current period’s return has been reduced by one percentage point. This is the visible portion of the cost. It can appear in fund documents, account disclosures, or the difference between gross and net performance.
Even if the analysis stopped here, the fee would matter. The larger effect develops afterward.
The Future Return That Disappears
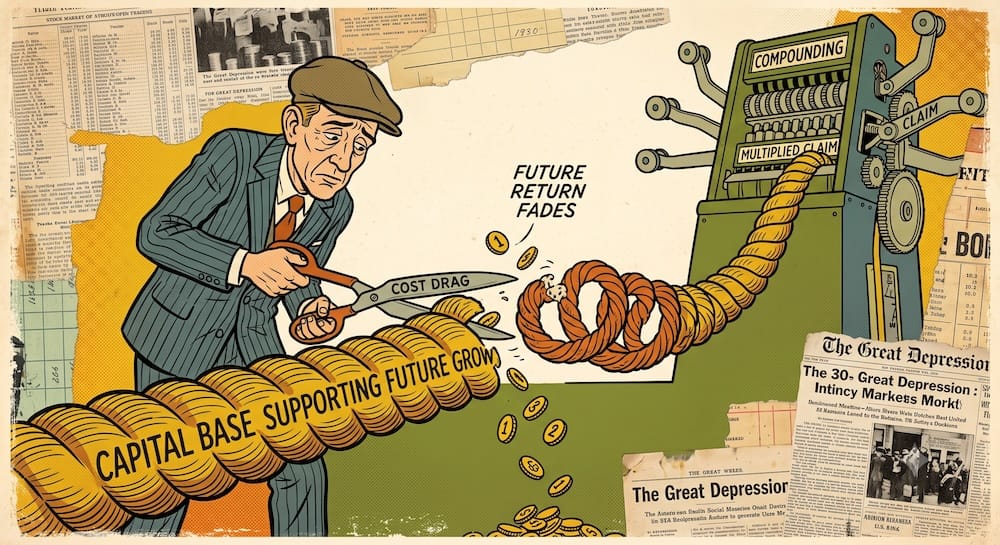
The capital removed this year is unavailable next year.
It cannot earn next year’s return. The return it fails to earn is also absent in the following year, so that missing gain cannot compound either. Each previous deduction weakens the base supporting future growth.
People often say that “fees compound.” I understand the shorthand, though I prefer a more exact description: the wealth shortfall caused by fees compounds. The fee itself does not earn a negative return. Removed capital simply loses every later opportunity to participate in growth.
This distinction can sound fussy until loose terminology produces loose arithmetic. Once “fees compound” becomes a slogan, it is easy to slide toward exaggerated claims in which every basis point is treated as an existential threat.
The mechanism needs no embellishment. Recurring costs matter because they alter the path of capital through time.
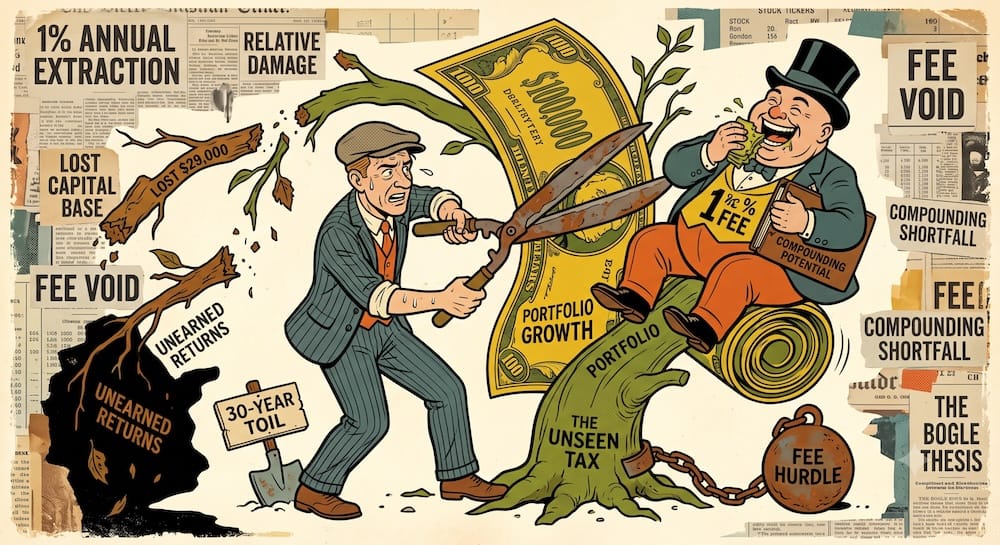
What a One-Percent Fee Can Do Over Thirty Years
Consider a controlled illustration.
An investor begins with $100,000. The portfolio earns a constant seven percent annual gross return for thirty years. There are no additional contributions, withdrawals, or taxes. Annual costs are treated as a direct reduction in return.
These assumptions are unrealistic by design. The exercise isolates cost rather than attempting to reproduce an investor’s life.
| Annual cost drag | Ending wealth after 30 years | Shortfall versus no-cost case |
|---|---|---|
| 0.00% | $761,226 | 0.0% |
| 0.25% | $709,637 | 6.8% |
| 0.50% | $661,437 | 13.1% |
| 1.00% | $574,349 | 24.5% |
| 1.50% | $498,395 | 34.5% |
Under these assumptions, a one-percent annual cost reduces terminal wealth by approximately 24.5% relative to the no-cost case.
That figure does not represent a pile of fee invoices equal to 24.5% of the no-cost portfolio. It combines the direct charges with the growth those deducted dollars never earned.
“Fees paid” and “wealth lost to cost drag” describe different quantities.
Bogle used this distinction aggressively. In a 2012 presentation to the American Philosophical Society, he examined the growth of $1,000 invested in the S&P 500 from 1926 through 2012. Before his assumed investment costs, the value reached roughly $3.55 million. After applying a 1.5% annual cost assumption, it fell to approximately $1.05 million. Bogle described about 71% of the cumulative return as having been consumed by costs.
The illustration is memorable, although it needs adult supervision.
The time horizon was exceptionally long. The 1.5% annual cost assumption should not be presented as representative of the asset-weighted fund expenses paid by US investors today. Morningstar reported that the asset-weighted expense ratio across US mutual funds and ETFs fell from 0.80% in 2006 to 0.32% in 2025.
That development changes the likely magnitude of fee drag. It leaves the relationship between recurring cost and terminal wealth intact.
I view modern fee compression as evidence of Bogle’s influence more than a repudiation of his thesis. His older examples can mislead when transferred carelessly into the present, yet the industry’s movement toward lower costs suggests that investors and providers eventually accepted the underlying arithmetic.
A 0.32% annual charge creates far less drag than a 1.50% charge. It still removes capital from the compounding base. The formula did not become obsolete when the input improved.
The Cost Matters Hypothesis Does Not Need Perfectly Efficient Markets
Bogle’s Cost Matters Hypothesis is often bundled together with the Efficient Market Hypothesis.
That pairing is convenient and conceptually sloppy.
The Efficient Market Hypothesis concerns how fully prices incorporate available information and whether investors can reliably exploit mispricing. The Cost Matters Hypothesis asks how much of the market’s gross return remains after the costs of obtaining it.
In his 2004 Brinson Lecture, Bogle explicitly contrasted the two ideas. His position was that costs matter under either condition: efficient markets or inefficient ones.
Suppose prices are highly efficient. Persistent outperformance becomes difficult, so a high-cost attempt to achieve it begins with a serious handicap.
Now suppose markets contain meaningful inefficiencies. Skilled investors may have more opportunities to exploit errors. Research, trading, administration, distribution, implementation, and advice still consume resources. Opportunity does not cancel subtraction.
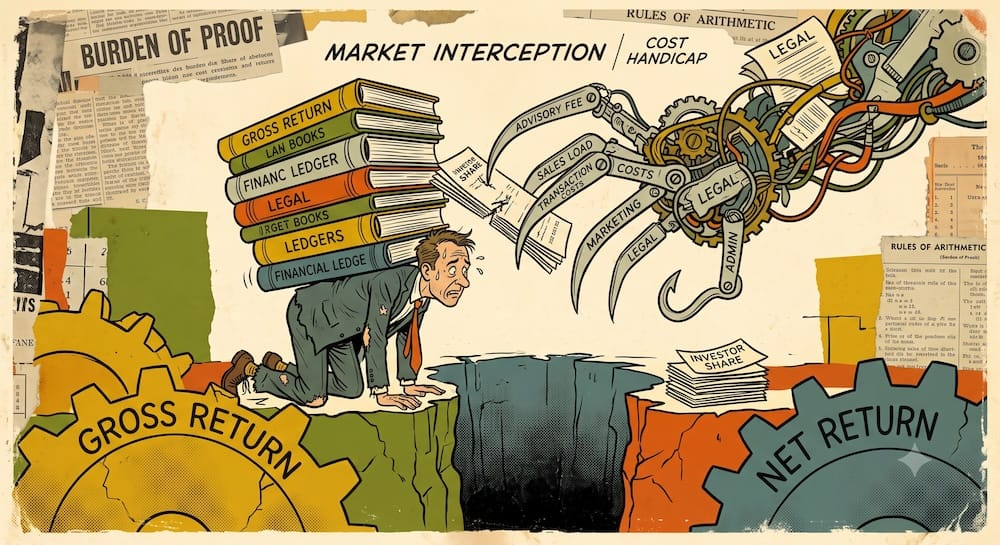
Bogle summarized the governing relationship in his 2005 essay, “The Relentless Rules of Humble Arithmetic”: gross market return minus the costs of financial intermediation equals the net return received by investors.
No theory of perfect prices is required.
I give Bogle more credit for this mechanism than for merely promoting inexpensive index funds. He developed an argument that survives disagreement about market efficiency. Active management can exist, skill can exist, and mispricing can exist. Costs remain real in every version of the market.
That shifts the burden of proof. A higher-cost strategy may succeed, but it must succeed by enough to cover its disadvantage after all relevant expenses have been included.
Bogle’s conception of cost was also broader than the expense ratio printed in a prospectus. In the Brinson Lecture, he included advisory charges, sales loads, brokerage and transaction expenses, marketing, custody, legal, administrative, and processing costs.
Reducing the hypothesis to “choose the fund with the smallest expense ratio” strips away much of its analytical value. Bogle’s real question was how much of the market’s return is intercepted before it reaches the investor.
The Market’s Arithmetic Moves the Burden onto the Expensive Strategy
William Sharpe formalized the aggregate argument in his 1991 essay, “The Arithmetic of Active Management”.
Under Sharpe’s definitions, the average actively managed dollar and the average passively managed dollar must earn the same gross return before costs.
Active and passive investors collectively hold the market. If the passive portion owns the market portfolio, the active portion in aggregate must own what remains, which also represents the market portfolio collectively. Once higher research and trading costs are deducted, the average active dollar trails.
This is an aggregate identity. It is not a forecast that every active manager will fail.
Sharpe explicitly acknowledged that some active managers can outperform passive alternatives after costs. A selected group can outperform as well. Those outcomes do not overturn the aggregate relationship, and the aggregate relationship cannot identify the future winners in advance.
The practical difficulty lies in selection.
An investor must identify skill before paying for it, gain access at an acceptable price, remain invested during periods when the skill appears absent, and eventually retain enough excess return to overcome the full cost differential.
I find that problem considerably less elegant than the historical performance chart usually offered as its solution.
The Cost Hurdle
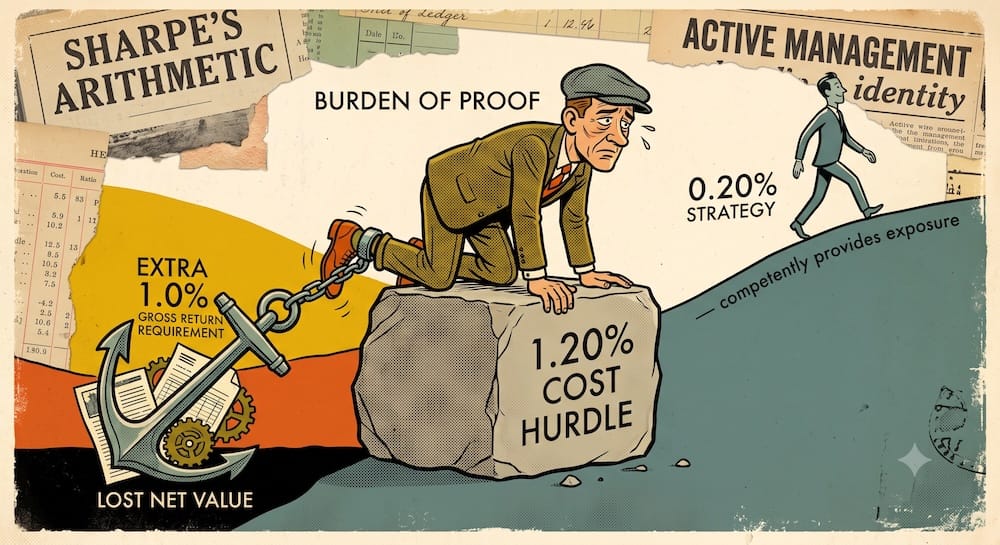
Suppose two otherwise comparable strategies provide similar exposure. One costs 0.20% annually and the other costs 1.20%.
The higher-cost strategy begins one percentage point behind each year. It must generate an additional one percentage point of gross return to produce the same net result. Creating extra net value requires even more. Any trading or implementation costs omitted from the headline fee increase the hurdle.
| Decision question | Lower-cost strategy | Higher-cost strategy |
| Cost largely visible in advance? | Yes | Yes |
| Future gross advantage known in advance? | No | No |
| Excess return required before adding net value | Lower | Higher |
| Outcome if added skill never appears | More gross return retained | More gross return surrendered |
| Initial burden of proof | Provide competent exposure | Provide competent exposure and justify the added cost |
I read this as an argument about where the burden of proof belongs. It does not establish automatic superiority for every lower-cost investment.
The cheaper strategy must perform its intended function competently. The more expensive strategy must perform that function and create enough persistent additional value to pay for the difference. Strong gross returns alone do not satisfy that requirement.
Beating a Benchmark Once Does Not Pay a Recurring Fee Forever
An annual cost creates an annual obligation. One successful period does not discharge it permanently.
Much of the performance industry still relies on isolated victories. A three-year result is printed in bold. A decade is divided at a favourable boundary. Failed funds disappear. Surviving winners remain on display, polished like trophies in a cabinet whose trapdoor receives remarkably little attention.
Sharpe identified several reasons empirical comparisons can appear to contradict the aggregate arithmetic:
- benchmark mismatch;
- cash holdings;
- survivorship bias;
- omitted failed funds;
- averages that do not properly weight investor dollars.
These details can determine whether the comparison measures skill, a different exposure, favourable selection, or statistical housekeeping.
Gross Outperformance Can Leave the Investor Behind
A strategy can beat its benchmark before costs and still underperform a cheaper alternative after costs.
If a manager generates one percent of gross excess return while imposing an additional 1.25% in total cost, the manager can claim an analytical victory while the investor retains less money.
Calling that alpha would be generous. Performance theatre is closer.
A credible comparison needs an appropriate benchmark, returns measured after relevant expenses, treatment of failed and merged funds, a meaningful time horizon, and comparable risk and exposure.
Even a well-constructed comparison cannot solve the ex ante selection problem. It simply removes the most obvious distortions.
Persistence Is the Scarce Input
Morningstar’s US Active/Passive Barometer reported that 21% of active strategies both survived and beat their passive counterparts over the ten years through December 2025.
Active success plainly exists.
Morningstar also found a strong relationship between fees and success. Within category fee quintiles, approximately 31% of the cheapest active funds succeeded, compared with 17% of the most expensive.
Cost did not dictate every result. It changed the odds.
S&P Dow Jones Indices’ 2025 Persistence Scorecard approached the problem from another direction and found that sustained relative outperformance among active US equity funds was generally fleeting.
Peer-relative persistence is not identical to benchmark-relative net alpha, so those findings should remain distinct. Together, they expose an uncomfortable implementation problem: a recurring cost hurdle requires durable skill, while observed outperformance often proves unstable.
I remain skeptical when an expensive strategy is defended with one excellent period and an assurance that skill will eventually return. The fee does not pause during the waiting period. It continues reducing the compounding base.
A successful higher-cost strategy must remain sufficiently effective after investors discover it, after assets flow into it, after market conditions change, after expenses are deducted, and after investors resist abandoning it during disappointing stretches. Describing that sequence as easy would require a more athletic imagination than mine.
The Expense Ratio Is Only the Most Visible Price
The expense ratio is useful because it is standardized, visible, and recurring. It may still represent only one layer of the economic cost.
The SEC’s prospectus framework separates annual operating expenses from shareholder charges. Operating expenses can include management fees, distribution or service fees, and other fund expenses. Shareholder charges can include loads, redemption fees, exchange fees, and account fees.
Investors may also encounter brokerage commissions, intermediary charges, advisory fees, retirement-plan expenses, transaction costs, bid-ask spreads, and other implementation frictions. Some are clearly disclosed. Others vary with trading behaviour, liquidity, account structure, or market conditions.
The relevant quantity is the all-in friction required to obtain and maintain the exposure.
This does not make every fee unjustified. Advice can provide planning, behavioural discipline, tax coordination, or services extending beyond portfolio management. Active strategies can supply specialized exposure, research, liquidity, risk management, or return characteristics an investor values.
Bogle’s hypothesis does not require those services to be free. It requires their price to be included in the comparison.
That demand sounds almost insultingly obvious. Finance has nevertheless built durable business models around the discovery that basic subtraction becomes surprisingly negotiable once enough layers appear between the gross return and the client.
“Buy the Cheapest” Is a Crude Version of Bogle’s Idea
Popular investment ideas tend to become shorter as they spread.
The Cost Matters Hypothesis is often compressed into a simple command: choose the cheapest fund.
That slogan is incomplete.
A fund can carry a tiny expense ratio and still offer the wrong exposure, track its benchmark poorly, trade inefficiently, lack sufficient liquidity, or operate through a structure unsuited to its intended function. Investor.gov notes that index funds can lag their indexes because of operating expenses, trading costs, sampling, and tracking error.
A zero-expense label can also coexist with advisory fees, commissions, transaction charges, and other indirect costs.
Zero is a persuasive marketing number. It occasionally performs the same job as a magician’s handkerchief: attention remains fixed on the visible object while something less convenient happens elsewhere.
Cost comparisons become meaningful when the alternatives provide comparable exposure and competent implementation.
This is where I part company with the most mechanical version of Bogle fandom. Expense control is indispensable, yet expense-ratio minimalism can become another shortcut.
A five-basis-point fund with poor tracking is not automatically superior to a ten-basis-point fund that delivers the intended exposure more faithfully. The cheaper vehicle may still win after a complete comparison. The printed fee alone cannot settle the question.
The better decision rule is to minimize all-in cost among competent alternatives performing the same job.
I can see why “buy the cheapest” travels more easily. It fits neatly in the mind and asks very little of us. “Compare complete costs across genuinely comparable, competently implemented exposures” has the marketing charm of an appliance warranty.
Accuracy often travels with heavier luggage. A low fee loses much of its appeal when the vehicle delivers the wrong exposure or introduces enough other friction to erase the apparent advantage.
The Clean Active-Passive Arithmetic Has Limits
The Sharpe-Bogle framework faces a serious qualification.
Real markets do not remain fixed while passive investors sit still. Companies issue and repurchase shares. Indexes add and remove constituents. Investors contribute and withdraw capital. Passive funds trade to accommodate flows and follow changing benchmarks.
Lasse Heje Pedersen argued in “Sharpening the Arithmetic of Active Management” that these real-world changes complicate the claim that active and passive investors must always earn identical gross returns before costs.
Pedersen also argued that active management can earn positive fees in aggregate by contributing to price discovery and capital allocation, while passive management provides low-cost market access.
This qualification matters. The strongest version of the Cost Matters Hypothesis should not depend on a simplified picture in which passive investors never trade and the active and passive groups always hold perfectly matched portfolios.
Markets are messier than that. I see no advantage in pretending otherwise.
Pedersen’s objection narrows the strict active-passive identity. It does not remove cost from the investor’s result.
The robust aggregate statement remains: investors collectively receive the gross return generated by financial assets after the costs of financial intermediation have been deducted.
The stronger claim—that active and passive investors must always receive identical gross returns—depends on definitions of the market portfolio, index changes, issuance, repurchases, and flows.
Active management may also provide genuine economic value through price discovery. That fact does not prove every active strategy earns its fee. An activity can be valuable in aggregate while a particular product remains overpriced, poorly executed, or impossible to identify successfully in advance.
The tension should remain visible. Active management may help markets function. Many active products may still fail to overcome their costs. Passive investors can benefit from price discovery performed by others. Some active investors may earn compensation for supplying it.
None of these possibilities weakens the investor’s need to compare a known cost with an uncertain net advantage. Bogle’s arithmetic survives in a more carefully bounded form because the costs still leave the investor’s side of the ledger.
Bogle’s Real Decision Rule: Compare a Certain Cost with an Uncertain Edge
The Cost Matters Hypothesis is widely treated as a defence of index investing. Its deeper value lies in the way it structures decisions under uncertainty.
Future market returns are unknown. Manager skill is difficult to separate from luck. Performance changes across periods. Benchmarks are imperfect. Investors often arrive after the strongest record has already been produced.
Even genuine skill can weaken as assets grow, personnel change, competitors imitate the strategy, or market conditions shift.
Cost occupies a different category.
It is one of the few investment variables largely visible before capital is committed. It can be estimated and compared without forecasting next year’s earnings, inflation, interest rates, or market mood.
Morningstar’s 2026 fee research described cost as one of the more reliable predictors of fund success because it is persistent and deducted directly from returns. Lower-cost funds have generally shown stronger survival and success rates.
That relationship does not guarantee victory for the cheapest alternative. It describes the structure of the competition.
A lower-cost strategy can deliver ordinary gross performance and retain more of it. A higher-cost strategy must produce enough additional value to overcome its handicap. When the hoped-for edge fails to appear, the fee does not waive itself out of sympathy.
It keeps billing.
I keep returning to that asymmetry because it is the part of Bogle’s thinking that travels furthest. His insight was larger than saving a few basis points while ignoring exposure, liquidity, construction, and every other relevant variable.
He gave investors a more demanding way to judge uncertain promises. Any proposed advantage has to be weighed against a recurring deduction that can be observed before the outcome is known.
The low-cost alternative must provide competent exposure. The higher-cost alternative must provide competent exposure and enough durable added value to cover the difference after every relevant expense.
Sometimes a higher-cost strategy will clear that hurdle. The Cost Matters Hypothesis leaves room for that outcome. It simply places the hurdle at its true height.
A fee looks small when it is quoted one year at a time. Compounding reveals the full economic contract: each recurring deduction reduces today’s capital and the future returns that capital could have earned.
Costs matter because subtraction continues long after the fee itself has faded from view.
What is John Bogle’s Cost Matters Hypothesis?
The Cost Matters Hypothesis states that recurring investment costs act directly inside the compounding mechanism to reduce current returns and shrink the capital base available for future growth. Over long horizons, these annual subtractions accumulate into a significant terminal wealth shortfall.
Why do small annual fees cause such large terminal wealth shortfalls over decades?
Cost drag is multiplicative rather than additive because the capital removed today loses every future opportunity to participate in market growth. This missing return fails to earn subsequent returns, meaning that the cumulative wealth shortfall compounds over time, altering the long-term path of your capital.
Does the Cost Matters Hypothesis depend on markets being perfectly efficient?
No, this hypothesis does not require market efficiency to remain valid. Whether a market is efficient or highly inefficient, the governing relationship remains absolute: the gross market return minus the costs of financial intermediation determines the net return an investor ultimately retains.
What is William Sharpe’s arithmetic of active management?
Sharpe’s arithmetic establishes that active and passive investors collectively hold the entire market portfolio, meaning the average active and passive dollar must earn the same gross return before costs. After deducting higher research and trading expenses, the average active dollar must mathematically trail the passive dollar in aggregate.
Why is an expense ratio an incomplete measure of an investment’s true cost?
An expense ratio only covers standard fund operating expenses, leaving out several layers of economic friction. To evaluate an exposure completely, investors must account for additional frictions such as advisory charges, sales loads, brokerage commissions, transaction costs, and tracking errors.
This article is also available in Spanish. [Leé la versión en castellano: La Cost Matters Hypothesis de John Bogle: Por qué las comisiones destruyen el interés compuesto]