So here’s the thing about Peter Lynch—he didn’t actually change. What changed was the storytelling.
If you spend any time browsing the retail investing corners of the internet, you’ve likely been fed a highly romanticized, homespun version of the Peter Lynch narrative. It’s the ultimate comforting myth of the amateur investor who beats the slick institutional suits simply by wandering through the local mall, noticing that people love Dunkin’ Donuts or that their wives are buying Hanes L’eggs pantyhose, and clicking buy. It implies that beating the market is a warm, qualitative lifestyle choice—a victory of everyday intuition over cold financial spreadsheets.
It’s a beautiful story. It’s also complete garbage.
When you look at what actually happened under the hood of the Fidelity Magellan Fund during Lynch’s tenure from May 1977 through May 1990, you don’t find a folksy retail stockpicker operating on gut feelings. You find an absolute machine. You find a blistering, active manager who built a multi-billion-dollar portfolio that peaked at over 1,400 concurrent positions, generated an astonishing 29.2% CAGR, and turned over his book at a rate that would leave a modern retail investor paralyzed by execution friction.
I find myself getting genuinely annoyed by how Lynch’s legacy has been systematically weaponized to justify lazy portfolio construction. The popular culture took his memorable slogans, stripped away the brutal operational filters that sat underneath them, and turned them into a license to buy stocks based on vibes. Peter Lynch didn’t give individual investors permission to buy familiar stories, mock diversification, or ignore the balance sheet. He gave them a research starting point—and modern investors keep mistaking it for the finish line.
The real danger here isn’t a mistake Peter Lynch made during his historical run. The danger lies in the three massive, portfolio-ruining mistakes investors make today because they read his slogans and ignored his actual control system. The central failure mechanism isn’t that people misunderstand the man; it’s that they confuse familiarity with actual financial analysis.
Mistake #1: Misusing “Diworsification” to Justify Reckless Concentration
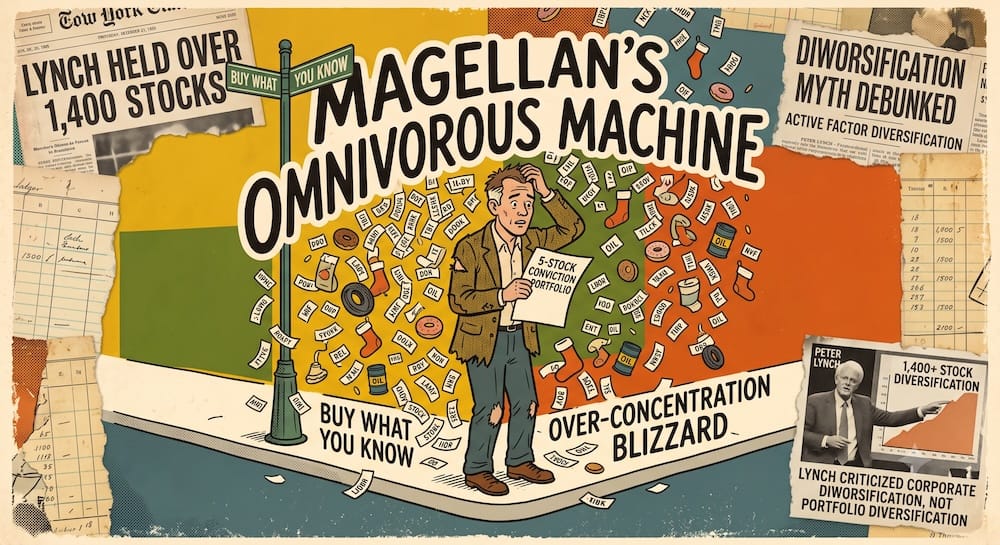
The single most common phrase grabbed from Lynch’s lexicon by concentrated stockpickers is “diworsification.” People love to throw this word around on financial forums whenever someone suggests their five-stock portfolio is a ticking time bomb of idiosyncratic risk. They strut around claiming that owning more than a handful of companies dilutes your top ideas, degrades your returns, and shows a lack of conviction. They think they are acting like Peter Lynch.
They aren’t. They are profoundly misreading the text.
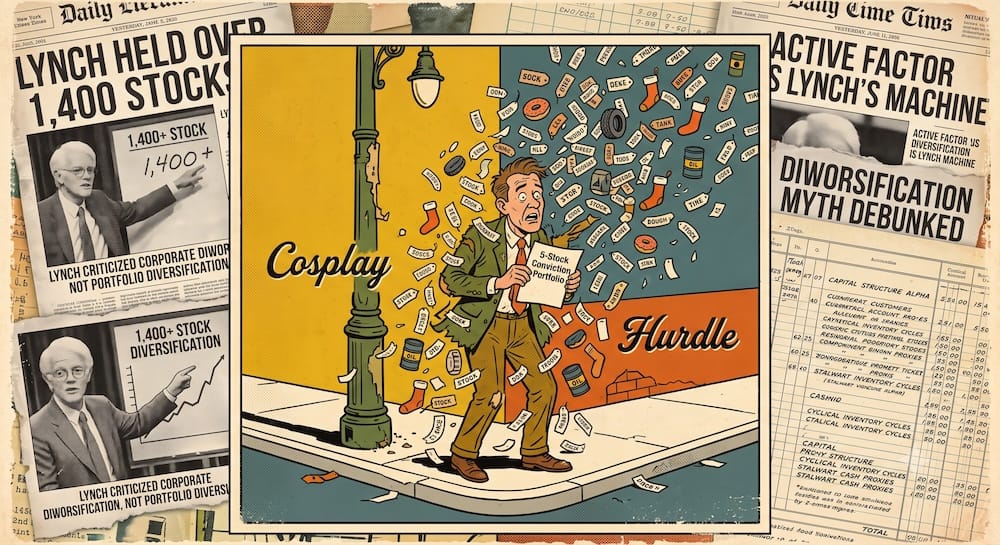
When Lynch popularized the term “diworsification” in One Up on Wall Street, he was explicitly criticizing corporate mergers and acquisitions—specifically conglomerate corporations buying random, unrelated businesses outside their core operational competencies just for the sake of expanding their empires. He was attacking an oil company buying a department store chain, or an aerospace firm purchasing a textbook publisher. He was not, under any circumstances, telling an individual retail investor to run a narrow, concentrated personal portfolio with no risk control.
In fact, Lynch’s actual portfolio design was the complete antithesis of modern retail concentration. At peak, the Magellan Fund reportedly held over 1,400 positions simultaneously during parts of his tenure.
                      THE PORTFOLIO ARCHITECTURE

    [ Modern Retail Misuse ]             [ Actual Magellan Reality ]
  · 5-10 concentrated holdings         · 1,400+ concurrent equities
  · "Conviction" over safety           · Wide active factor mosaic
  · Passive buy-and-hold forever       · 80% to 110% reported turnover
Lynch did not look at portfolio diversification as a drag on returns; he used it as an expansive mosaic to manage small-cap liquidity risks and systematically capture market optionality. He knew that micro-cap and small-cap stocks were fragile, volatile, and prone to sudden structural failure. By running a massive, diversified pool of ideas, he transformed individual equity selection into a broad factor engine.
To map this structural disconnect, let’s look at what people think Lynch meant versus the actual reality of his operational record.
Diworsification: What People Think Lynch Meant vs. What He Actually Meant
| Popular Interpretation | Lynch’s Actual Target | Modern Investor Mistake | Better Lesson |
| Diversification is structurally bad and dilutes your absolute alpha. | Corporate executives making value-destructive, unrelated acquisitions. | Running an ultra-concentrated five-stock retail book with extreme uncompensated risk. | Broad diversification protects an investment framework against structural business failures. |
| Concentration is the only true proof of investment skill and conviction. | Lazy corporate expansion driven by institutional ego. | Confusing a small position count with actual analytical edge. | Lynch used a massive asset base to capture optionality across hundreds of ideas. |
| Owning more than 20 stocks guarantees you will match index returns. | Conglomerates overpaying for businesses they do not understand. | Owning a narrow cluster of unexamined companies under the guise of focus. | Bad, low-quality businesses weaken returns; diversified high-quality ideas do not. |
| “Diworsification” applies directly to an individual’s personal portfolio. | A corporate operational failure mode, not a personal asset allocation rule. | Using a corporate M&A slogan to avoid basic portfolio position-sizing discipline. | Personal diversification is an essential tool for managing behavioral volatility. |
| Familiarity alone is enough to justify a massive, single-stock allocation. | Companies drifting outside their circle of core operational competence. | Loading up on a local brand without recognizing the structural lack of safety. | Even the most compelling qualitative idea requires a strict portfolio weight limit. |
When an investor runs a tiny, concentrated stock portfolio without deep, professional-grade balance sheet defense, it isn’t an expression of Lynch-style conviction. It is risk wearing a clever quote as a hat.
Biographical accounts show Lynch used a framework akin to venture capital: his top 10 to 20 positions made up the vast majority of Magellan’s daily performance, while hundreds of other positions were tiny token stakes or asymmetric lottery tickets. If a small position imploded, it was an invisible line item. If it ran up 1,000%, it moved the needle. He survived because he diversified. Modern retail concentration often assumes that if you buy five stocks you like, none of them can go to zero. That isn’t active management; it’s an emotional gamble.
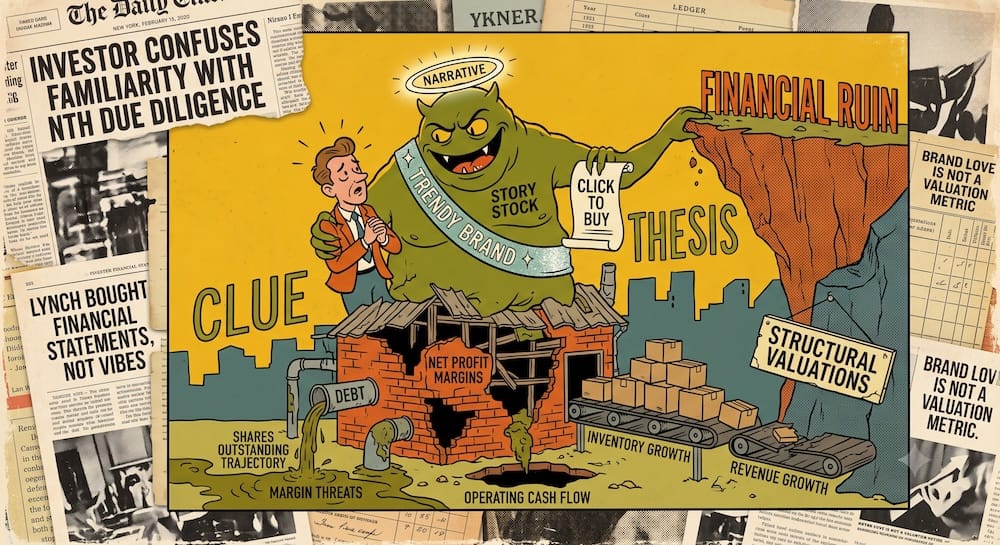
Mistake #2: Buying Story Stocks Instead of Businesses
The second major failure mode is what I call the “Story Stock Seduction.” This occurs when an investor confuses their own personal consumer familiarity with actual equity due diligence.
People read Lynch’s advice to look around your daily life for investment ideas, and they immediately buy shares in a trendy fast-casual restaurant chain where the lines are out the door, or a tech platform that all their friends are using. They construct an intricate, romantic narrative about how the company is going to conquer the world. The narrative is clean, intuitive, and highly compelling.
The problem is that the stock market does not pay you for a compelling story. It pays you for the underlying cash flows, asset realities, and structural valuations.
A story stock is not simply a business with a recognizable name. It is a company where the overarching narrative has completely replaced financial verification as the basis for owning the asset. Brand love is not a valuation metric. Store traffic is not cash flow. And just because a product is inevitable in daily life doesn’t mean the stock isn’t pricing in absolute perfection already.
Lynch used everyday scuttlebutt strictly as a top-of-funnel idea generation tool—a first clue to pick up the phone or request a financial report. The mistake modern retail investors make is stopping at the clue. They treat the initial observation as the complete thesis.
To break this down, let’s run the most common story-stock temptations through a clinical reality check to see what numbers Lynch actually looked at before he ever bought a share.
Story Stock Reality Check
| Story-Stock Temptation | Lynch-Style Reality Check | Number That Tests the Story |
| “Everyone loves the product; the consumer demand is exploding.” | Is that massive top-line revenue growth actually translating into net earnings quality? | Net Profit Margin & Operating Cash Flow |
| “The store is always packed; you can barely get through the front door.” | Are the underlying store-level unit economics actually profitable after corporate overhead? | Same-Store Sales Growth vs. Selling General & Administrative (SG&A) Expenses |
| “The brand feels completely inevitable and will dominate the market.” | Has the market already priced this growth in at an absurd, un-holdable multiple? | Trailing P/E Relative to Sustainable Growth Rate (The PEG Ratio Baseline) |
| “It could be the next massive tenbagger in the sector.” | Does the company possess the liquid capital to fund expansion without diluting existing shares? | Total Debt-to-Equity Ratio & Shares Outstanding Trajectory |
| “I deeply understand the company because I use their app every single day.” | Do you understand the broader category competitive dynamics, regulatory risks, and margin threats? | Gross Margin Consistency vs. Nearest Industry Competitors |
| “Wall Street analysts completely miss how popular this local trend is.” | Is the corporate inventory stacking up faster than the actual customer sales can clear it? | Inventory Growth Rate vs. Revenue Growth Rate |
If a company’s revenue grows by 30% but its corporate inventories grow by 60%, the story about a roaring consumer success is structurally compromised. The business may quietly be stuffing its distribution channels with unsold products. If a restaurant chain opens 50 new locations a year to keep its top-line growth narrative alive while its same-store sales at legacy locations are quietly dropping by 4%, the story is broken.
When an investor buys a stock based on the vibe of the brand without digging into these numbers, they are participating in a classic narrative trap. Lynch didn’t buy the story. He bought the audited financial statements after the story caught his attention.
Mistake #3: Ignoring the Numbers (and Category Discipline)
This brings us to the deepest failure mode of all: the absolute refusal of modern investors to perform category-specific financial auditing.
The folksy myth says you can evaluate any stock using a uniform, generalized checklist. But the actual Lynch method was grounded in strict structural classification. He sorted every stock into one of six distinct corporate lifecycle categories. Why? Because he understood that a number that signals a roaring buy in one category represents a catastrophic sell signal in another.
If an analyst evaluates a deep cyclical manufacturer using the same valuation metrics they apply to a high-margin stalwart, they will face significant headwinds. If someone buys a slow grower for its dividend yield without auditing its debt structure, they are walking into a value trap.
Let’s look at the numbers that actually matter across Lynch’s six specific categories, and map the exact mistakes investors make when they ignore this structural discipline.
The Numbers Each Lynch Category Actually Needs
| Lynch Category | What the Story Claims | Numbers That Matter | Mistake Investors Make |
| Slow Grower | “It’s a stable household name that pays a great dividend every single quarter.” | Dividend safety, payout ratio stability, total debt load relative to free cash flow. | Buying strictly for historical yield without realizing the dividend coverage is fundamentally deteriorating. |
| Stalwart | “This is a high-quality powerhouse that will protect my capital during any recession.” | Long-term earnings stability, absolute valuation relative to historical growth, consistent cash flow generation. | Assuming that corporate quality justifies paying an infinite price, leading to decades of flat returns. |
| Fast Grower | “This company has an open runway to expand and compound capital at double digits.” | Organic revenue growth, stable gross margins, clean balance sheet with zero net debt, geographic expansion runway. | Extrapolating historical growth rates infinitely into the future while ignoring local market saturation walls. |
| Cyclical | “The sector is booming, earnings are hitting all-time highs, and the P/E multiple is incredibly low.” | Inventory accumulation vs. sales trends, capital expenditure cycles, industry capacity expansion. | Buying at the exact peak of the cyclical earnings cycle when the P/E ratio looks artificially cheap. |
| Turnaround | “The stock has crashed 80%, it’s incredibly cheap, and new management is going to fix the business.” | Net cash reserves, upcoming debt maturity schedules, current operational cash burn rate. | Buying a statistically “cheap” stock that is actually in a terminal liquidity spiral toward outright bankruptcy. |
| Asset Play | “The company owns incredibly valuable real estate and hidden patents that Wall Street is completely ignoring.” | Tangible book value accuracy, debt encumbrances, a clear structural catalyst to unlock hidden value. | Mistaking stale accounting book value for actual realizable cash value while waiting decades for a catalyst that never arrives. |
Let’s look closely at the Cyclical category, because it represents the most dangerous trap for numbers-blind investors.
In a standard growth business, a low P/E ratio usually implies value. But in a highly cyclical sector (like steel, semiconductors, or automotive manufacturing), an incredibly low trailing P/E ratio is often a sign of imminent danger. It means the company is at the cyclical peak of its earnings power. The market frequently prices the stock down in advance because it recognizes these peak earnings are entirely unsustainable and are bound to drop off a cliff.
If an investor steps in blindly thinking, “Wow, this auto company is trading at a P/E of 4, what a bargain!” they are making a devastating calculation error. Historical logs indicate Lynch did the exact opposite: he bought cyclicals when their earnings looked horrific, their P/E ratios looked sky-high, and factories were quietly shutting down capacity. He looked at inventory cycles and industry capacity, not trailing valuation headlines.
Similarly, with Fast Growers, investors routinely ignore the balance sheet. They see a company growing its footprint by 25% a year and ignore the fact that the expansion is being entirely funded by high-interest junk debt or massive share dilution. The moment the macro environment hits a bump and consumer demand softens, that unhedged leverage triggers a liquidity crisis. If the growth isn’t backed by clean, organic cash flow and a pristine balance sheet, it isn’t a fast grower—it’s a financial house of cards.
The Magellan Reality Check
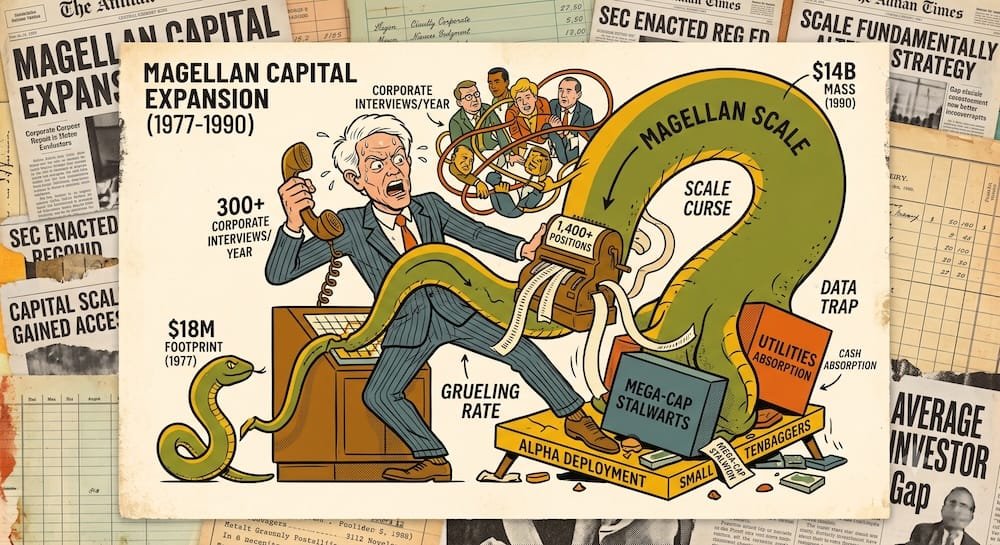
To understand why Lynch required such a massive, data-driven control system, we need to take a quick, unvarnished look at the sheer scale and institutional intensity of the Magellan Fund during his tenure from 1977 to 1990.
This was not a casual, work-from-a-laptop operation. Biographical accounts show Lynch was a legendary workaholic who routinely pushed himself to a grueling schedule—a pace that ultimately drove his retirement at age 46.
He didn’t run his strategy based on local store walkthroughs alone. He operated an institutional data-gathering machine. Records indicate he conducted over 300 face-to-face or phone interviews a year with corporate management teams, leveraging Fidelity’s massive, growing capital scale to extract real-time operational metrics across entire industrial supply chains long before that data ever reached a public SEC filing.
                  MAGELLAN CAPITAL EXPANSION (1977-1990)

  1977: $18 Million Asset Footprint [•]
  1990: $14 Billion Asset Footprint [===================================]
When Lynch took over Magellan in 1977, the fund managed roughly $18 million. This tiny asset footprint was a massive structural advantage; it allowed him to hunt in the deep, highly inefficient micro-cap space where buying a small block of shares could materially move the needle on fund returns.
But as his 29.2% CAGR became the talk of Wall Street, billions of dollars of retail capital flooded into the fund. By the time he stepped down in 1990, Magellan was managing over $14 billion.
This scale growth fundamentally altered the mechanics of his strategy. He could no longer deploy meaningful capital into small-cap “tenbaggers” without accidentally purchasing the entire outstanding share capital of the target business. Scale pushed Magellan toward larger, more liquid names—forcing him to hold hundreds of additional securities and pivot heavily into mega-cap stalwarts, utilities, and large corporate entities simply to absorb the cash inflows.
Lynch’s edge was institutional, diversified, hyper-active, and backed by a level of corporate access that was permanently altered in October 2000 when the SEC enacted Regulation Fair Disclosure (Reg FD), legally banning public companies from giving preferred metrics to institutional managers before the general public.
A retail investor sitting at a desk today with a basic equity screener operates in a completely different structural reality. There is no institutional order flow, no pre-Reg FD executive data streams, and certainly no capacity to manage 1,400 positions by hand.
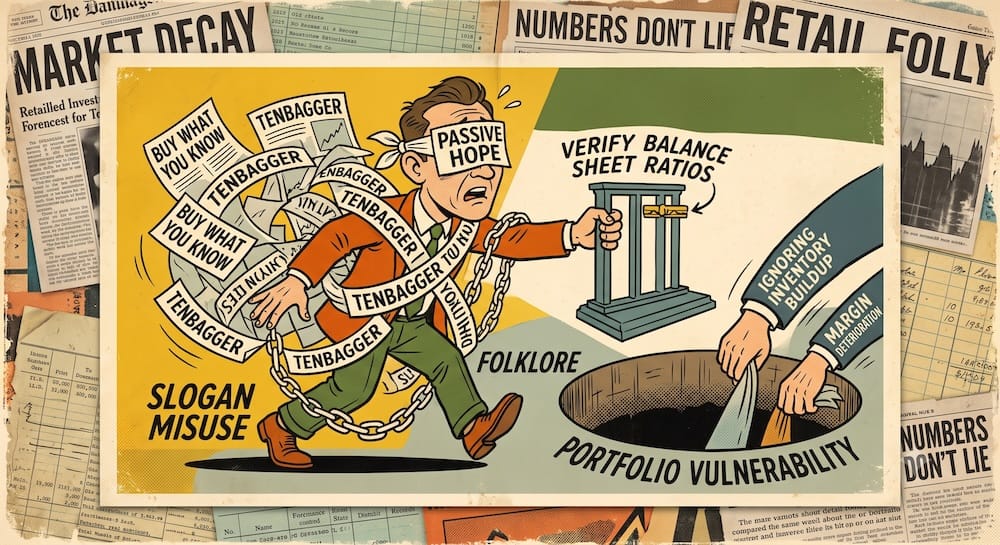
The Lynch Slogan Misuse Map
To keep Lynch’s ideas from drifting into dangerous folklore, it helps to translate his memorable slogans back into the strict risk management parameters he actually used to run his book.
Let’s look at how his most famous concepts are routinely corrupted by modern retail applications, and outline the corresponding control mechanisms required to fix them.
Lynch Slogan vs. Retail Misuse vs. Control Mechanism
| Lynch Idea | Retail Misuse | Actual Control Mechanism |
| Buy what you know. | Buying a stock purely because you recognize the consumer brand or use the retail product. | Use personal observation solely as an initial research lead; verify the asset via category-specific balance sheet ratios. |
| Diworsification. | Refusing to diversify, running a dangerous five-stock high-risk concentration. | Avoid corporate conglomerates buying unrelated businesses; maintain deep diversification across personal positions. |
| Tenbagger. | Blindly chasing high-risk moonshots, penny stocks, and unprofitable tech stories hoping for a 1,000% return. | Size positions appropriately so individual business failures cannot cause structural ruin to your total capital. |
| Long-term investing. | Falling in love with a declining business and holding the stock forever while the fundamentals completely decay. | Maintain continuous fundamental tracking; ruthlessly evaluate the asset the moment the core category thesis breaks down. |
| Growth at a Reasonable Price. | Buying any fast-growing revenue story regardless of the absolute premium or debt load. | Systematically compare the trailing valuation multiple against the organic, sustainable growth rate and runway. |
| Invest in what you understand. | Assuming that utilizing an app or buying groceries gives you a structural understanding of corporate unit economics. | Ensure you understand the underlying capital expenditures, debt maturity schedule, and cash flow lifecycle of the sector. |
If an investor treats “buy what you know” as a substitute for an accounting audit, they are turning a research lead into a portfolio vulnerability. If they treat “long-term investing” as an excuse to ignore a structural deterioration in profit margins or a massive buildup in inventory, they are confusing active discipline with passive hope.
What Actually Travels
When we strip away the nostalgic mall-walk fairy tales, the vanished informational moats of the 1980s, and the institutional advantages that cannot be replicated inside a modern retail brokerage account, what is the modern reader left with conceptually? What should be absorbed into a balanced analytical framework, and what must be ruthlessly expelled?
The durable lesson is that Peter Lynch’s real edge was systematic, deeply diversified, and numbers-driven. His process was an exercise in rigorous accounting work, clear corporate lifecycle classification, and intense risk management.
What to Absorb
- The Six Lifecycle Archetypes: The category matters because it dictates the specific financial metrics that deserve priority. The category should shape the analysis: ensure you know whether you are looking at a Cyclical, a Stalwart, or a Fast Grower before digging into valuation models.
- Observation as a Lead, Not a Thesis: Consumer observation is an excellent idea-generation process. It pays to be intensely curious about the world—noticing which products are working and where real-world economic activity is accelerating. But that observation is merely a clue to launch an investigation, not the final verdict.
- Rigorous Balance Sheet Verification: Lynch’s process cared about cash balances, debt-to-equity ceilings, and tracing inventory accumulations relative to revenue trends. Let the numbers have the final vote on whether the story is real.
What to Expel
- The Mall-Stock Fairy Tale: Recognition alone is not an edge in a market where financial data is widely screened, modeled, and arbitraged. The belief that everyday intuition or consumer familiarity can replace rigorous accounting due diligence is worth expelling.
- Slogan-Based Concentration: Do not let a corporate M&A slogan trick you into running an under-diversified portfolio that exposes your core capital to catastrophic uncompensated risk.
- Story-First Investing: The moment a company’s story becomes an excuse to ignore deteriorating gross margins, rising debt loads, or an astronomical valuation multiple, the narrative has replaced reality.
Peter Lynch was not telling investors that active management was easy, casual, or intuitive. He was not saying, “Buy what you recognize.”
The underlying framework suggests something far more demanding: notice what others miss, categorize the business with clinical discipline, test the narrative against the hard reality of the numbers, and do the exhausting structural accounting work that the rest of the market is too lazy to execute. Respect the accounting underneath the story, and never mistake a beautiful narrative for an investable business.
Did Peter Lynch actually recommend running a concentrated portfolio?
Not exactly. While internet folklore treats Peter Lynch as a champion of concentrated high-conviction stock picking, his actual institutional execution was radically different. At its peak during his tenure from May 1977 to May 1990, the Fidelity Magellan Fund held over 1,400 positions concurrently. Lynch ran a massive active factor mosaic rather than a narrow book, relying on broad diversification to manage the structural liquidity risks of micro-cap and small-cap companies while capturing widespread optionality.
What did Peter Lynch mean by “diworsification”?
He was attacking corporate mismanagement, not personal portfolio allocation. When Lynch popularized the term “diworsification,” he was explicitly criticizing conglomerate corporate executives who acquired random, unrelated businesses outside their core operational competencies—such as an oil firm buying a department store chain. Modern retail investors frequently abuse the slogan to justify running reckless five-stock portfolios with immense, uncompensated idiosyncratic risk.
Why did the average Magellan Fund investor lose money if the fund generated a 29.2% CAGR?
It comes down to a brutal behavioral return gap. Historical industry accounts and internal tracking indicate that the average retail investor didn’t buy Magellan during its early, small-scale years. Instead, they performance-chased, buying shares in massive waves immediately following blistering periods of short-term outperformance. When the fund entered a natural tracking-error dead zone or hit a standard market drawdown, those same investors panicked and liquidated their shares near local troughs, turning paper volatility into realized capital losses.
Can a modern individual investor replicate Lynch’s corporate access edge today?
No. That specific informational moat is permanently closed. During the 1970s and 1980s, Lynch maintained a grueling schedule conducting over 300 face-to-face or phone interviews a year with company executives, extracting real-time inventory and supply-chain data before it ever hit public filings. In October 2000, the SEC enacted Regulation Fair Disclosure (Reg FD), making it illegal for public corporations to share material, non-public operational metrics with institutional managers before disclosing them to the general public.
Why does a low P/E ratio indicate high risk in a cyclical stock?
The mechanics are completely counterintuitive. In a standard growth business, a low price-to-earnings multiple can signal deep value. In a highly cyclical industry, an incredibly low trailing P/E ratio often signals that the company has reached the absolute peak of its operational earnings power. Because the market recognizes that these peak earnings are entirely unsustainable and are preparing to drop off a structural cliff, the stock price is compressed in advance, turning a superficial valuation “bargain” into a classic cyclical value trap.
What is the difference between a “story stock” and an investable business?
The difference lies entirely in the control system beneath the narrative. A story stock is a company where personal consumer familiarity, brand affinity, or an exciting market concept completely replaces financial verification as the reason for owning the asset. An investable business may start with an interesting qualitative observation or consumer trend, but its thesis is rigorously audited using category-specific balance sheet health, net profit margins, and inventory-to-sales trajectories before capital is ever deployed.
This article is also available in Spanish. Leé la versión en castellano: Errores de Peter Lynch a evitar: Diworsification, Story Stocks e ignorar los números