If you spend enough time roaming the corridors of modern finance academia, you will eventually be told that risk is a neatly packaged Greek letter called Sigma. You will be shown elegant, symmetrical bell curves illustrating that an asset’s risk is entirely defined by how wildly its price bounces around a mean. It is a beautiful, comforting fiction. It allows analysts to calculate Sharpe ratios to the fourth decimal place, print clean institutional brochures, and pretend the future can be tamed by a spreadsheet.
I don’t hate volatility. I hate pretending it tells the whole story.
Standard deviation became the dominant definition of risk because it is quantifiable, not because it captures what investors actually fear. Computers can calculate it instantly. It fits perfectly into modern portfolio formulas. But the moment I step away from the classroom and look at what actually destroys capital, I realize academia settled on a metric of convenience rather than a metric of reality.
Howard Marks, the co-founder and Chairman of Oaktree Capital Management, built his career by challenging this mathematical dogma. He didn’t treat risk as a backward-looking price wiggle. Instead, he approached it through a simpler, far more terrifying lens: the permanent loss of capital.
This article is not a panoramic look at Marks’s full life, nor is it a deep dive into the corporate history of Oaktree. It is an exploration of his core qualitative risk mechanism. I want to look at why finance picked the wrong definition of risk, why artificial smoothness is often a trap, and how the interaction between an asset’s price and an investor’s internal capital structure determines real-world survival.
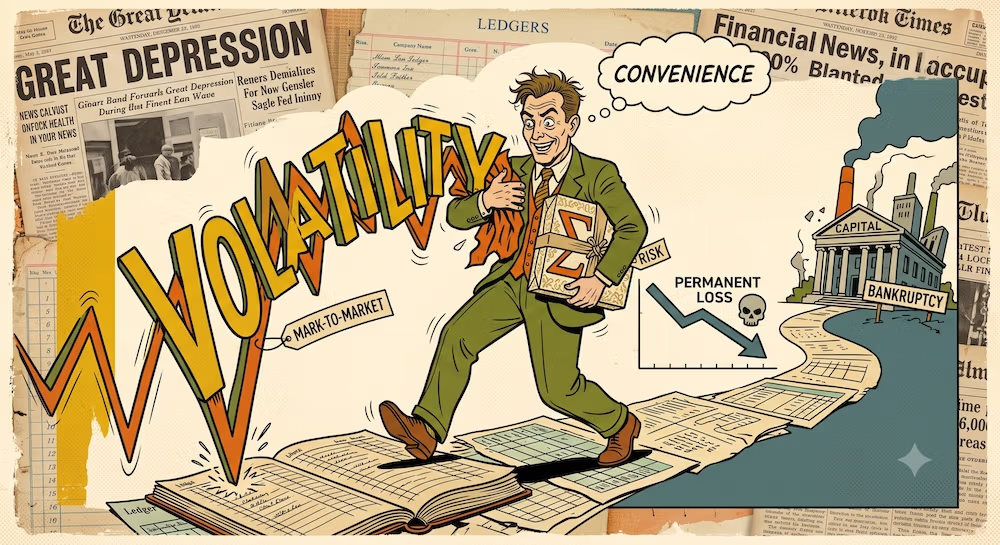
Volatility Is Easy to Measure, So Finance Pretends It Is Risk
Let’s be completely honest about why standard deviation won the intellectual war in modern finance. It wasn’t because it was an accurate representation of hazard. It won because it was clean.
If you define risk as the probability of permanent capital destruction, you are dealing with a qualitative, invisible variable before the fact. You cannot easily run a regression analysis on a probability distribution that hasn’t happened yet. But if you define risk as price volatility, you suddenly have a metric you can calculate, track, and rank. I see this as a classic case of finance choosing the target it could hit rather than the target that actually mattered.
This is where the spreadsheet crowd starts polishing the wrong trophy. When you equate daily price fluctuations with true risk, you treat a temporary market markdown identically to a total corporate bankruptcy.
I would rather own a bumpy asset bought at a deep margin of safety than a perfectly smooth asset priced for religious perfection. Price fluctuation is not the enemy; it is the baseline cost of admission for participating in public markets.
The academic framework assumes that an asset whose price drops by 30% over a quarter has automatically become higher risk. But if the underlying economic earning power of that asset remains entirely intact, I argue that the drop in price means the asset has mechanically become lower risk for anyone purchasing it at the new, discounted entry point. By treating volatility as a static proxy for risk, standard formulas completely misread the relationship between price and safety.
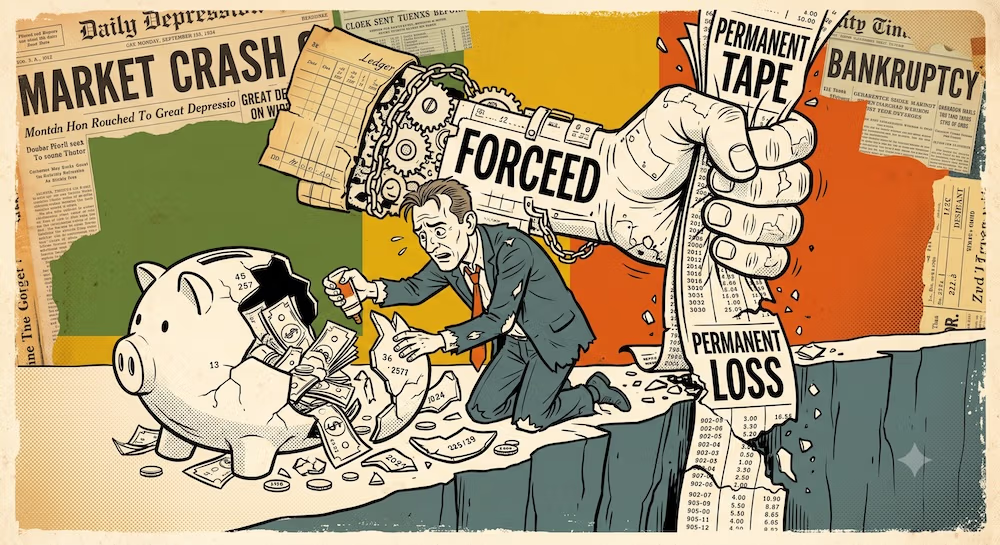
Marks’s Real Definition: Permanent Loss
If you read through decades of Marks’s commentary, including his pivotal July 2001 memo, What’s It All About, Alpha?, you find a persistent refusal to let standard deviation dictate portfolio reality. Marks’s framework separates risk into two distinct categories: temporary fluctuation and permanent impairment.
Volatility is often an operational mark-to-market problem before it is a permanent-loss problem. If an investor possesses the structural and emotional capacity to hold an asset through a market downturn, a temporary price drop is merely noise on a screen. It only becomes a realized loss if the investor is forced—either by their own psychological limits or an external structural mechanism—to sell at the bottom.
True risk, by contrast, cannot be undone. It is the terminal destruction of capital, or the permanent underperformance of a portfolio relative to the explicit long-term liabilities or goals that the capital was originally meant to serve. If you overpay for an asset at the absolute peak of a speculative bubble, the subsequent loss isn’t a temporary fluctuation; it is a permanent mathematical impairment driven by a bad entry price. I think a lot of people trick themselves into looking at a fundamentally overvalued asset and calling it safe just because its daily chart moves in a straight line. The asset’s cash flows simply cannot justify what you paid, and no amount of time or market smoothing will salvage the terminal return profile.
| Situation | Volatility Looks Like | Real Risk Question | Marks-Style Interpretation |
| High-quality asset down sharply | Terrifying | Is intrinsic value impaired or only price? | Volatility may create opportunity |
| Overpriced stable asset | Safe | Are future returns already destroyed by price? | Smoothness can hide danger |
| Leveraged portfolio | Efficient | Can volatility force liquidation? | Structure converts volatility into loss |
| Illiquid private asset | Calm | Is the mark real or smoothed? | Low volatility may be accounting fog |
| Distressed senior debt | Chaotic | Is recovery value above purchase price? | Scary price action may reduce real risk |
| Liability-funded capital | Unstable | Will the investor need cash at the wrong time? | Risk depends on investor structure |
Why Volatility Can Still Hurt You
Now, let’s add the crucial nuance that I see most online commentators completely miss. Marks does not argue that volatility is entirely meaningless or that you should simply ignore it. In his memo Risk Revisited Again, he clarifies that while volatility falls far short as “the” definition of risk, it can still function as an indicator, a symptom, or even a real-world hazard depending entirely on the investor’s structural vulnerabilities.
I think volatility gets blamed for crimes committed by leverage, overpayment, and bad investor structure. Volatility is not the terminal enemy by itself. The core enemy is what volatility can trigger.
If an investor operates with a fragile internal structure, temporary price fluctuations will systematically convert themselves into permanent losses. From where I sit, volatility becomes dangerous under very specific operational conditions:
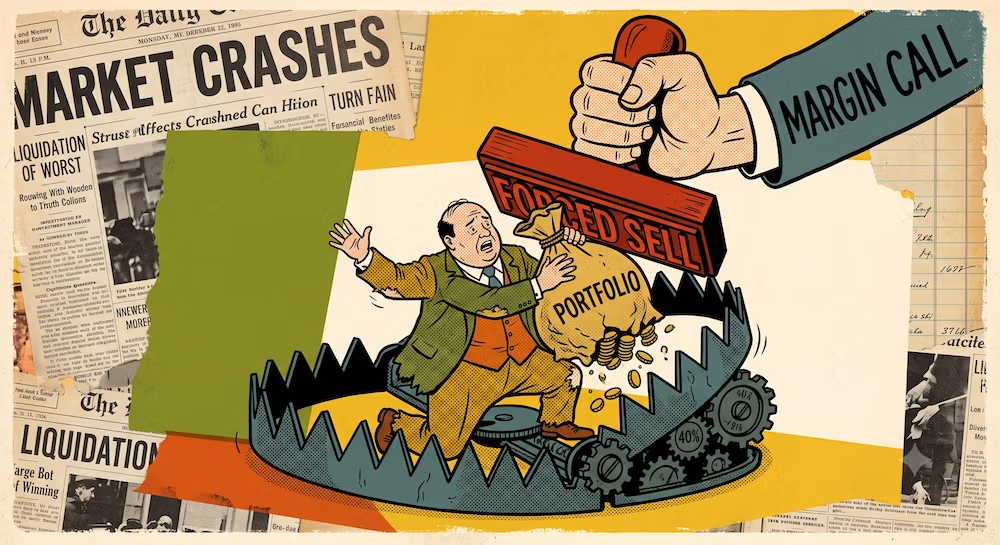
- Forced Liquidation via Leverage: If a portfolio utilizes margin lines or structural debt, a sharp drop in market prices triggers automatic margin calls. The lender does not care about your long-term thesis or your qualitative margin of safety; they liquidate your assets at the absolute bottom to protect their own capital. Leverage turns a temporary paper loss into an irreversible reality.
- Broken Conviction: Human beings are not algorithms. When a portfolio wiggles violently, psychological fatigue sets in. Volatility tests the limits of an investor’s behavioral discipline. If an investor lacks a deep, fundamental understanding of an asset’s intrinsic value, a prolonged downward price movement will eventually force them to capitulate and sell out of sheer panic.
- Institutional Redemption Pressure: For institutional fund managers, volatility creates severe career risk. Even if a manager has the fortitude to hold through a downturn, their clients may not. A wave of redemptions forces the manager to sell illiquid underlying assets into a falling market, locking in losses to meet cash demands.
- Liability Mismatches: If an investor requires immediate liquidity to fund a real-world liability, and their capital is locked up in a crashing asset class, they are forced to harvest that capital at impaired prices.
The lesson here is vital: the severity of volatility depends heavily on the structure of the vehicle holding the asset. An identical 40% price drop can be a historic buying opportunity for an unleveraged, long-term investor, and a terminal bankruptcy event for a leveraged, short-term participant.
Price Changes Risk
The heart of Marks’s investing mechanism is the realization that risk is a dynamic variable governed by price, not a static characteristic inherent to an asset class.
The conventional view assumes that certain investments—like high-yield credit, distressed debt, or emerging market equities—are permanently risky, while other assets—like blue-chip stocks or AAA-rated corporate debt—are permanently safe. Marks completely flips this logic on its head.
A high-quality asset can become extraordinarily risky if market euphoria drives its price to an absurd valuation percentile. When an asset is priced for absolute perfection, the margin of safety disappears. The slightest operational misstep, macro regime shift, or growth slowdown will trigger a catastrophic repricing. In this scenario, the asset’s low historical volatility acts as an intellectual narcotic, blinding investors to the massive structural tail risk they are compounding by overpaying.
Conversely, a highly distressed, structurally flawed asset can become remarkably low-risk if market panic drives the price down to fire-sale valuations. If you buy a corporate claim at a steep discount to its conservative liquidation value, you have constructed an asymmetric profile. Much of the bad news may already be priced into the asset. Your downside is insulated by the raw value of the physical assets or the legal priority of your claim, while any return to normalcy creates massive upside potential.
I look at this and see a clear law of market physics: risk is not a quality embedded in the security itself; it is a function of the price paid.
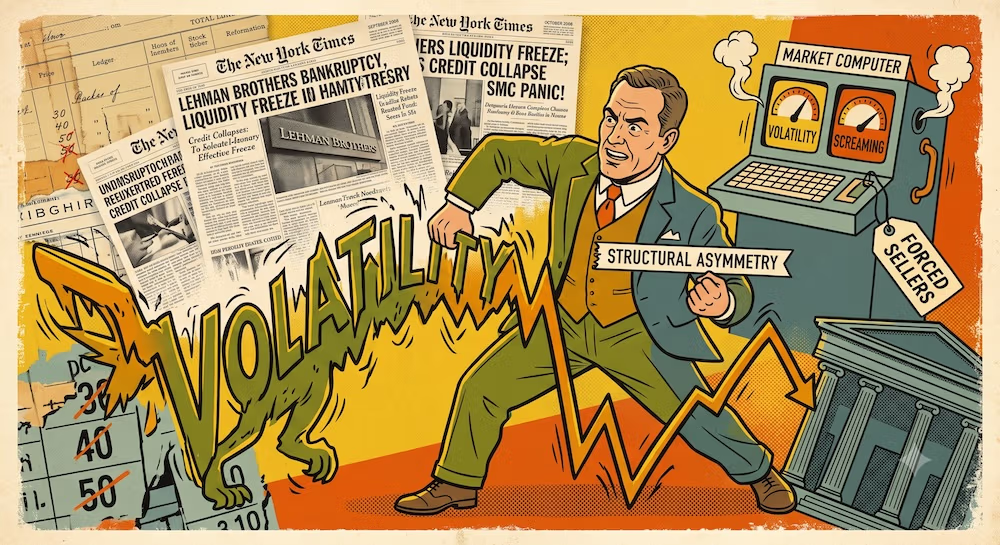
The 2008 Oaktree Example: Scary Prices, Better Asymmetry
We can see this exact mechanism play out during the collapse of 2008. Following the Lehman Brothers bankruptcy in September of that year, public credit markets experienced a total liquidity freeze. Prices for high-yield corporate bonds and non-investment grade debt collapsed overnight.
To any computer running on standard financial formulas, the risk of these assets was skyrocketing. Volatility metrics were screaming, and standard risk models forced institutional desks to freeze or dump their positions.
Marks and his team at Oaktree looked at the situation through a qualitative credit lens. They didn’t focus on the daily price charts; they focused on the underlying corporate capital structures and the mechanics of forced institutional selling. They recognized that large institutions were being forced to liquidate senior corporate claims simply to meet immediate redemption pressures and margin calls.
Oaktree stepped in as a systemic liquidity provider. According to official retrospectives, Bruce Karsh’s team deployed capital at a rate of approximately $400 million per week from September 18, 2008, through the end of the year. In essentially a single quarter, that specific credit team invested roughly $6 billion, with total Oaktree purchases across the entire firm reaching $7.5 billion during that chaotic period.
The market saw terrifying price action and assumed the risk of permanent loss was infinite. Oaktree saw forced sellers, senior legal claims, and historic discounts where the probability of permanent loss appeared materially reduced relative to the quoted price. They weren’t gambling on a macro recovery; they were operating on the mechanical reality that their purchase prices were so far below intrinsic recovery values that the downside had been structurally minimized.
When you look at Oaktree’s long-term record, the numbers validate this structural discipline. Across their Global Opportunities funds, representing decades of operations, they accumulated over $68 billion in committed capital, generating a dollar-weighted aggregate IRR of 21.9% before fees and 16.0% after fees. That level of long-term outperformance wasn’t built by avoiding volatility; it was built by exploiting the mispricings that volatility creates when forced sellers lose control of their structures.
The Smoothness Trap
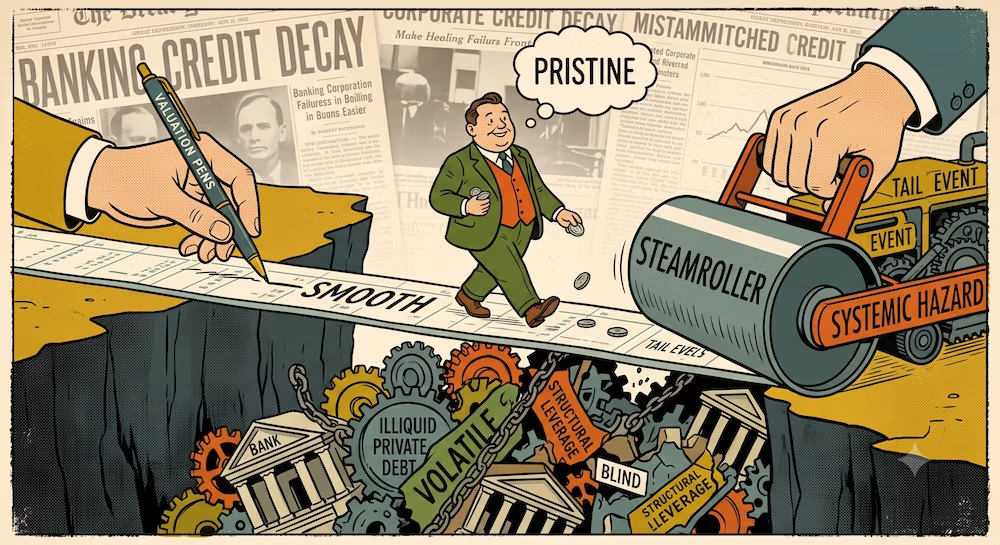
If volatility can hide opportunity, the inverse is equally true: artificial smoothness routinely hides systemic hazard.
One of the most dangerous tendencies in modern asset management is the persistent search for low-volatility yield. Investors who are psychologically or structurally terrified of price fluctuations will routinely pay a massive premium for assets that show dead-flat performance lines on a monthly statement.
The smooth line is where I start getting suspicious. Frequently, that apparent stability is not a reflection of underlying safety; it is an artifact of accounting mechanics or structural leverage.
Consider illiquid private assets or non-traded credit vehicles. Because these assets do not trade on public exchanges, they are not subject to daily mark-to-market pricing. Instead, they rely on periodic, qualitative valuations or smoothed internal marks. The line on the chart looks incredibly calm, completely insulated from the choppy waves of public equity markets.
I do not trust a smooth chart until I know what it is hiding. This cosmetic smoothness is often just accounting fog. The underlying economic risks—corporate credit deterioration, rising interest rate drags, operational stresses, and bad underwriting—are still compounding exactly as they would in a public security. If an investor mistakes a lack of public quotation for a lack of real-world risk, they are walking straight into a trap. They are trading liquidity and transparency for a visual smoothing effect, often while paying high management fees for the privilege of remaining blind to their actual downside exposure.
Even worse is when smoothness is achieved through structural leverage. A strategy can generate small, steady, positive returns month after month by picking up nickels in front of a steamroller—such as writing unhedged options or financing long-term illiquid assets with short-term wholesale debt. The standard deviation of this strategy looks pristine right up until the day the tail event hits, at which point the portfolio suffers an instant, permanent loss of capital that wipes out years of accumulated gains.
What Actually Travels
When we strip away the specific institutional machinery of global credit firms—the direct access to restructuring tables, the capacity to negotiate complex bankruptcy restructurings, and the ability to command billions in institutional dry powder—what is actually left for an independent portfolio builder?
I believe we are left with a powerful, unsentimental conceptual framework for thinking about capital preservation across shifting market regimes.
- The Price Wiggle Mistake: The next time a core holding experiences a sharp, volatile correction, the Marks-style question is whether the long-term economic capacity of the underlying asset has been permanently impaired, or if you are simply watching a temporary liquidation dance on a public exchange. Equating price wiggle with real hazard is the ultimate spreadsheet error.
- Entry Price as Risk Control: The risk-control lesson is that safety is not something purchased by choosing a supposedly safe asset class; it is something negotiated by refusing to overpay. Entering an investment at an inflated price due to a compelling narrative or a low historical volatility record inherently increases the risk of permanent capital loss.
- Investor Structure Matters: The structure lesson is that liquidity needs radically change the real-world meaning of volatility. Capital required soon cannot tolerate the same mark-to-market pressure as capital with a genuinely long horizon. Insulating long-term compounding means keeping short-term cash needs entirely separate, ensuring that market volatility cannot force a liquidation at a cyclical bottom.
- Artificial Smoothness Is Not Safety: The conceptual lesson is to treat dead-flat yield charts with deep skepticism. When an investment brochure promises steady returns with near-zero price fluctuation, the Marks-style protocol is to look for the hidden leverage, the private valuation lag, or the underlying underwriting risks.
- Risk Is Not One Clean Number: The final takeaway is to accept that risk is a multi-faceted, qualitative distribution of outcomes that can only be assessed through second-level analysis of value, structure, and behavior. Anyone who tells you they have captured the total risk profile of a portfolio through a single, backward-looking mathematical equation is trying to sell you a model that the real world will eventually tear to pieces.
Long-term survival in public markets isn’t about configuring a portfolio to eliminate short-term price movements. It is about building an internal structure robust enough to withstand those movements, maintaining a strict discipline around entry pricing, and understanding that the line on the screen is simply noise right up until the moment your own structure turns it into a permanent reality.
Does Howard Marks think volatility is completely irrelevant?
Not exactly. He clarifies that while volatility is not the core definition of risk, it can become a material real-world risk depending entirely on your internal structure. If your portfolio uses leverage, or if you face structural redemption pressures or immediate real-world liabilities, temporary price drops can force a liquidation. Volatility isn’t the terminal enemy by itself; the enemy is what volatility triggers when your structure is fragile.
Why does standard finance academia insist that volatility equals risk?
Because it is clean and countable. Defining risk as the qualitative probability of permanent capital loss means dealing with an invisible variable before the fact, which you cannot easily plug into a regression formula. Standard deviation won the academic war because computers can calculate it instantly across thousands of assets, not because it accurately mirrors what actually destroys wealth. Finance chose the metric it could measure over the metric that mattered.
How can a highly volatile asset be lower risk than a stable one?
It comes down entirely to entry price and asset coverage. If a fundamentally sound business suffers a chaotic price drop on a public exchange due to forced institutional liquidations, its backward-looking volatility spikes. However, because you can now buy its underlying cash flows at a steep discount, your real-world risk of permanent loss has materially decreased. Conversely, an asset with a perfectly flat chart bought at an absurdly inflated valuation percentile carries massive risk because the entry price leaves zero margin of safety.
What does Howard Marks mean by the term “second-level thinking” regarding risk?
It means looking past the obvious surface data. A first-level thinker looks at a crashing market, sees massive volatility, and concludes that the investment has become far more dangerous. A second-level thinker asks: “Who is selling, are they being forced to liquidate, what is the underlying capital seniority, and does this price action drop my entry point far below conservative intrinsic value?” Second-level thinking isolates the mechanical structure under the price wiggle.
What is the minimum capital or structural horizon required to invest like Marks?
It is not about a specific dollar amount; it is about your mandatory holding horizon. Oaktree utilizes institutional closed-end funds with 7-to-11-year lock-up terms to prevent investor redemptions during panics. For an independent portfolio builder, replicating this means having zero structural leverage and siloing your short-term cash needs away from your compounding canvas. If you cannot be forced to sell during a 40% market drawdown, you possess the structural capacity to exploit volatility rather than suffer from it.
Why is artificial chart smoothness considered a dangerous portfolio trap?
Because low volatility frequently masks structural tail risk or accounting fog. Many illiquid private assets do not trade on public exchanges, meaning their valuations are based on periodic, qualitative internal marks. The line on the statement looks beautifully stable, but the underlying economic risks—like credit deterioration or rising interest expenses—are still compounding underneath. If you pay a massive valuation premium just to see a smooth line on a chart, you are trading transparency for a visual illusion that can end in an unrecoverable capital drop.
This article is also available in Spanish. [Leé la versión en castellano: Howard Marks y el riesgo: Por qué la volatilidad no es el verdadero enemigo]