

Definition: [picture perfect (adjective: NORTH AMERICAN) lacking in defects or flaws; ideal]. Imagine the picture perfect summer day traveling. You’re with loved ones. The sun is out but it is not scorching. The gentle breeze tickles your senses and you notice cotton candy clouds off in the distance.

You’ve done something out of your comfort zone. It was equal parts adventurous, thrilling and terrifying. What an adrenaline rush. You’ve always wanted to do that but previously lacked the courage. Bucket-list item ticked off.
Now you’re sitting down at a grand table with gourmet food and drinks flowing aplenty. Conversation is natural and relaxed. In many ways this was the picture perfect day. Now what if we were to extend this analogy to creating a picture perfect portfolio? What would that look like? Does it even exist?
About the Author & Disclosure
Picture Perfect Portfolios is the quantitative research arm of Samuel Jeffery, co-founder of the Samuel & Audrey Media Network. With over 15 years of global business experience and two World Travel Awards (Europe’s Leading Marketing Campaign 2017 & 2018), Samuel brings a unique global macro perspective to asset allocation.
Note: This content is strictly for educational purposes and reflects personal opinions, not professional financial advice. All strategies discussed involve risk; please consult a qualified advisor before investing.

Picture Perfect Portfolio = Stocks + Bonds + Alternatives


Picture Perfect Portfolio = Personal Life Story

The Picture Perfect Portfolio is an intersection of all things I love in life:
Travel and Photography/Videography + Investing + Strategy
Since, I was a child I enjoyed playing strategic games. My Dad would take his Queen off of the chess board and beat me in as few moves as possible. Not being able to win easily forced me to learn the rules of the game and think strategically.
My love for travel was fostered by extended family road trips. As an young adult I embarked solo upon my first backing adventure around SouthEast Asia for 6 months: I loved waking up each morning in new places, eating exotic new food and exposing myself to different cultures. The problem with this first trip is that I had a terrible camera and had no idea how to capture the moment.

Failed Attempts At Photography

I failed in my attempts to capture the experiences I was having to relay home to friends and family in a way that made others feel like they were there with me. Everything came out grainy and muted; lacking vibrancy, composition and eye-popping colour. Feeling frustrated by the results, I spent the next couple of years self-learning how to take photos.
More important than the technical skills and camera equipment was the lessons learned on composition and harmony. A great photo follows the laws of nature and balance in a way that is symmetrical. Imagine a tic tac toe grid. The most easy to play perfect game? The intersecting lines where horizontal meets vertical is the rule of thirds.

Tic Tac Toe + Rule Of Thirds = Perfect Portfolio?

I never considered this until today but a tic tac toe grid = rule of thirds for composition.
You place your subject matter (person, castle, pet, tree) on top of where those lines connect and not in the spaces where the X’s and O’s land in order to take the compositionally perfect picture.
Go take a look at any professional photos you’ve had taken (weddings, birthdays, events, etc) and take a closer look at some of your favourite photos. Do you notice the subject smack-bullseye right in the middle? Chances are not in many of your favourite pictures.

1-2-3 = Investing Success?

Now what does all of this have to do with the Picture Perfect Portfolio? Everything.
Imagine the tic tac toe board again. How do you win the game? Equal parts 1-2-3. Up. 1-2-3. Down. 1-2-3. Left. 1-2-3. Right. 1-2-3. Diagonal. Always. 1-2-3.
No one piece is more important that the other. Each one contributes equally to the winning result.

1-2 Historical Approach To Investing
The problem in investing is that we’ve been collectively trying to win the game by going 1-2. Stocks and Bonds. 1-2. 80/20. 1-2. 60/40. 1-2. 40/60. 1-2. 20/80. What’s missing? Alternatives. Additional uncorrelated assets. More zigging to combat zagging.
By having just two uncorrelated assets where one is effectively the volatile gas (stocks) and the other the more stable brakes (bonds) we’re at the mercy of deciding between higher performance vs a smoother ride.
If you crave higher performance then you need more stocks. The downside is you get the rollercoaster of volatility and drawdowns when the markets crash. How about a smoother ride with more bonds and less stocks? Sure thing. But enjoy your lower returns.
It’s a compromise any which way you look at it. However, when we add a third uncorrelated asset class and expand the canvas of our portfolio from 100% to 100%+ we’re back into 1-2-3 territory.

The Perfect Picture. The Perfect Game. The Order 3 Venn Diagram. The Picture Perfect Portfolio

The Order 3 Venn Diagram. The law of composition. The Perfect Picture. The Perfect Game. The Picture Perfect Portfolio.
When we expand the canvas equal parts 1-2-3 we can have our cake and enjoy a second slice (and maybe even a third) while not feeling guilty about it afterwards. In investing terms, the picture perfect portfolio is equal parts stocks, equal parts bonds and equal parts alternatives.

New Roomate = Expand The House
Because we’ve got a new guest in the house (alternatives) we need more bedrooms, an expanded kitchen, more living room space and an extra powder room to feel comfortable together. We’re not all going to cram in together the ways things currently exist.
This is not a portfolio of addition by subtraction. It’s expansion and a new friend under the roof.

1 + 2 + 3 = Parts Solution
= Parts –> Stocks + Bonds + Alternatives
Aftering tinkering around under the hood, for days on end, and experimenting with number crunching and other nerdy simulations I came up with the perfect canvas size for this portfolio. It’s not 100%. It is 180%. We’ll be sharing this canvas equally with each asset class. Here’s what we’ve got under the hood:
Portfolio Composition
60% Equities: 60% MSCI Global Minimum Volatility
60% Bonds: 40% Long Term-Treasury and 20% TIPS
60% Alternatives: 40% SG Trend and 20% Gold
Before we get into the strategy of this portfolio composition. I know you’re all itching to see the results. Here they are:
 - Digital Art")
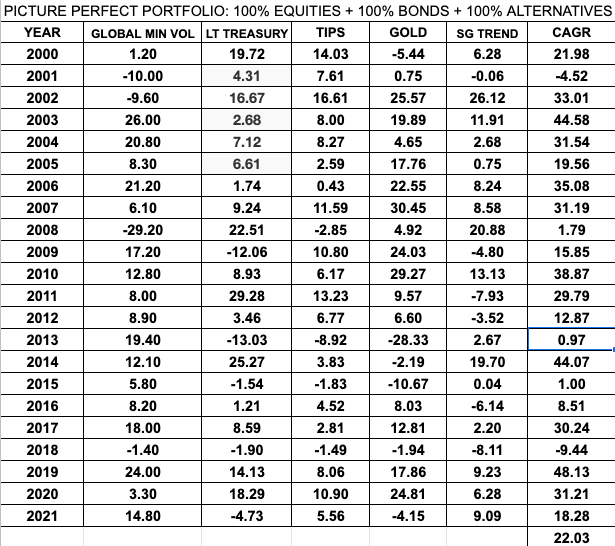
Picture Perfect Portfolio Results (2000 to 2021)

(The investment performance results presented here are based on historical backtesting and are hypothetical. Past performance, whether actual or indicated by historical tests of strategies, is not indicative of future results. The results obtained through backtesting are only theoretical and are provided for informational purposes to illustrate investment strategies under certain conditions and scenarios.)
*Please note that TIPS results were replaced in 2000 by Intermediate Treasury.*
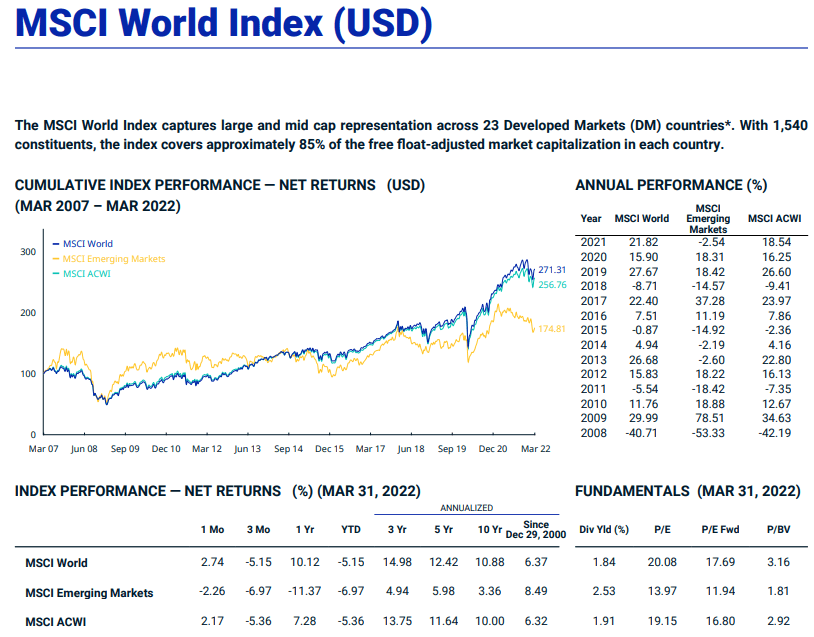
The concept of this portfolio is that it attempts to outperform its parent index market-cap weighted MSCI World equities, enjoy a smoother ride and maybe even arrogantly kick a bit of dirt back in its face for good measure.
Has the Picture Perfect Portfolio accomplished this?
In every which way.
First let’s compare 22 years CAGR annualized returns: 13.26% (since Jan, 2000) vs 6.37% (since Dec, 2000). 7 negative years for the parent index vs only 2 for the Picture Perfect Portfolio. How about its worst year? -40.71% for the market-cap weighted index.
How did the Picture Perfect Portfolio perform that year? Oh, it was above water at +0.25%.
The Picture Perfect Portfolio had its worst year in 2018 at -5.53% while its only other negative year was 2001 at -2.63%.
The MSCI World Index inevitably got hammered with three down years in the early 2000s dot com bubble, was massacred in 2008 and has since had three more negative years (2011, 2015, 2018).
An all equity portfolio is a roller-coaster ride. The Picture Perfect Portfolio saves the roller-coaster ride and admission for the amusement park.
MSCI World Index Results

Picture Perfect Portfolio Pros and Cons
It’s extremely hard not to be biased when evaluating your own creation but I’ll attempt to do present what I feel are the biggest pros and cons of this strategy:
The Pros
- Potential for consistent outperformance of its benchmark across all economic regimes
- All-Weather approach to limit drawdowns and negative years during bear markets in the stock market
- Set it and forget portfolio approach maximizing global diversification, multi-strategy, multi-asset classes
- Diversified moving parts under the bonds and alternative asset class sleeve. TIPs and LTT move different from one another as do Gold and Trend-Following. The importance of not just having one strategy to overcome down years in the stock market
- Breaking the link between market-cap weighted equities and selecting a factor (minimum volatility) that will bring more overall stability to the portfolio
- Enough moving parts in the portfolio to overcome any particular asset class having a particular challenging year
- Strategy that can be used independent of the life cycle of the investor (works for those accumulating or in retirement)
The Cons
- The use of leverage freaks certain people out and anyone prone to loss aversion or recency bias would want to stay far away or consider the 1X version of the strategy (100% canvas *see below* not the 180% one we’re critiquing here)
- Significant tracking error during certain years. In 2013 equity only friends would be celebrating 26.86% returns while you endured 0.05%
- The fact that any one asset class or strategy could enjoy significant underperformance for a prolonged period of time.
- The alternative sleeve can especially be frustrating at times. A great year for equities dragged down by gold. Trend-following being flat for a few years on end.


Strategy Behind What Is Under The Hood
Make no mistake, the Picture Perfect Portfolio is unabashedly contrarian. It shakes the shackles free from sixty-forty, says sayonara to the milquetoast market-cap weighted equity indexes and Guten Tag to alternatives such as trend-following. The Picture Perfect Portfolio has been built from a bottoms-up approach. It’s not tied to convention or stymied by conservatism given its expanded canvas format of 180%. Furthermore, it provides returns that outperform the All-Weather portfolio and Risk Parity portfolio at the enhanced 180% canvas level while better managing risk and volatility.
- Global minimum equities were selected as opposed to market-cap weighted equities. The reason is simple. Global minimum volatility equities have enjoyed relatively the same (actually slightly better performance of 8.82% vs 8.26%) than its market cap-weighted parent index. The main difference is that the minimum volatility equities endure far less trauma during bear market or correction years. Consider the results above in years 2008, 2011, 2015 and 2018.
- Bonds have been divided between Long-Term Treasury and TIPs for results that are uncorrelated to the stock market, offer downside protect and also have an inflation fighting ability. Notice the wide variety of returns annually between LTT and TIPs. They often have very different results sometimes varying by 10-20%+. Diversification is your only free lunch in investing.
- Gold and Trend Following are the alternatives under the hood that offer results that are uncorrelated from stocks and bonds. In the 2000s they were the saving grace during a particularly rough decade for developed stock markets. If you look at the performance of the Picture Perfect Portfolio in 2020 you’ll notice equities struggled (3.3%) whereas especially gold (24.81%) and trend-following (6.28%) allowed the portfolio to return an impressive 18.95% return. Much like LTT and TIPs, gold and trend-following often have radically different years. Consider the results of 2009, 2013 and 2014. The importance of the portfolio having a multi-bond and multi-alternative asset class strategy was something that was carefully considered.

These asset allocation ideas and model portfolios presented herein are purely for entertainment purposes only. This is NOT investment advice. These models are hypothetical and are intended to provide general information about potential ways to organize a portfolio based on theoretical scenarios and assumptions. They do not take into account the investment objectives, financial situation/goals, risk tolerance and/or specific needs of any particular individual.
PPP 1X Results = 100% Canvas

This is for investors who are interested in the portfolio but would never want a portfolio expanding beyond 100%. I hear you. I understand you. I get you. No need to explain. Let’s see if we can accomodate your needs. Firstly, we’ll need to break with the equal parts as this would make for an odd 33.33% each for stocks, bonds alternatives. We’ll bring things in balance by going as follows:
40% Equities: 40% MSCI Global Minimum Volatility
30% Bonds: 20% Long Term-Treasury and 10% TIPS
30% Alternatives: 20% SG Trend and 10% Gold

Oddly enough we gain an additional negative year (2008) rather than the merely two from the 180% canvas. -2.31% in 2001. -2.80% in 2008. -2.91% in 2018. The 7.48% CAGR still beats the 6.37% MSCI global stock benchmark. Diversification working its wonders. I guess having an extra negative year is less than optimal but if I could have a crystal ball for the future with 19 winning years and only three years in the -2% territory I’d take it.
What about if we go all wacky and jump the shark with a 300% canvas? Equal parts stocks 100%, bonds 100%, alternatives 100%? Will the portfolio fall apart under those conditions? Let’s check. By the way, I’d never recommend going this aggressive. This next part is purely for entertainment purposes only. Don’t do this at homes kids! Adults too 😉

PPP Wacky 3X Results = 300% Canvas
100% Equities: 100% MSCI Global Minimum Volatility
100% Bonds: 70% Long Term-Treasury and 30% TIPS
100% Alternatives: 70% SG Trend and 30% Gold
(The investment performance results presented here are based on historical backtesting and are hypothetical. Past performance, whether actual or indicated by historical tests of strategies, is not indicative of future results. The results obtained through backtesting are only theoretical and are provided for informational purposes to illustrate investment strategies under certain conditions and scenarios.)
Woah! What happened. We’ve now only got two negative years again. They’re still under < -10%. -4.52% in 2001 and -9.44% in 2018. The 22.03% CAGR makes me feel a little uneasy and queasy. I need some pepto. It’s just unfathomable over a 22 year period to have results like this while managing volatility. This is the part where I say we ought to cool it with the thoughts of ever going this aggressive. All it would take is certain assets that were uncorrelated in the past to become correlated in the future to sink the ship of any portfolio at the 300% canvas level. Yikes. I almost wish I never saw this. Where is the Men in Black neuralyzer when you need it?
source: Samuel and Audrey on YouTube
12-Question FAQ — Picture Perfect Portfolio (PPP)
1) What is the Picture Perfect Portfolio?
A rules-based, three-engine portfolio that targets outperformance with less risk by combining equal parts stocks, bonds, and alternatives on an expanded “canvas” (typically 180% notional exposure). It is intentionally contrarian to plain 60/40 and market-cap equity indexes.
2) What’s the PPP’s core allocation at the 180% canvas?
60% Equities: MSCI Global Minimum Volatility
60% Bonds: ~40% Long-Term Treasuries + ~20% TIPS
60% Alternatives: ~40% Trend-Following (e.g., SG Trend) + ~20% Gold
3) Why use minimum-volatility equities instead of market-cap?
Min-vol has historically delivered similar (or slightly better) returns with lower drawdowns, improving the portfolio’s ride during equity bear markets while keeping global equity exposure.
4) Why split bonds between Long-Term Treasuries and TIPS?
They behave differently across regimes—LTTs are powerful crisis ballast; TIPS add inflation protection—reducing reliance on one bond profile and improving diversification.
5) Why include gold and trend-following?
They’re uncorrelated to stocks and bonds and often shine in rough regimes (e.g., 2000–02, 2008, 2022). Gold offers real-asset hedging; trend-following adapts (long/short) across global futures.
6) What does “expanded canvas (leverage)” mean here?
PPP uses modest, diversified leverage to add a third sleeve (alternatives) without subtracting from stocks or bonds—aiming for higher risk-adjusted returns and shallower drawdowns than either sleeve alone.
7) Is there a 1× (unlevered) version?
Yes. Example 100% canvas:
40% Min-Vol Equities / 30% Bonds (20% LTT, 10% TIPS) / 30% Alts (20% Trend, 10% Gold).
It forgoes stacking but preserves the three-engine design.
8) What about a 3× (300%) version?
It’s a theoretical stress test only—not a recommendation. High notional exposure can break if correlations change. PPP emphasizes prudence around leverage.
9) What are the main pros?
Regime-ready: three independent engines
Lower volatility & drawdowns vs. equities alone
Set-and-rebalance structure with broad diversification
Outperformance mandate without relying on equity beta alone
10) What are the key trade-offs?
Tracking error vs. simple equity benchmarks
Patience required when one sleeve lags (e.g., gold or trend flat)
Leverage/derivatives introduce complexity and costs
Not a benchmark hugger; results will differ from peers
11) Who is PPP for?
Investors who want smoother compounding and multi-regime resilience, are comfortable with non-benchmark behavior, and can stick with a diversified, rules-based process.
12) Any implementation and maintenance tips?
Use global min-vol equity, duration-balanced Treasuries + TIPS, and institutional-grade gold & managed-futures proxies. Rebalance on a schedule (e.g., quarterly/annual) or bands, and keep allocations consistent with your risk tolerance. All results in the write-up are backtests—real-world costs and slippage apply.
Nomadic Samuel Final Thoughts

The ‘Picture Perfect Portfolio’ would represent a product in the ETF marketplace that doesn’t currently exist. An equal parts global stocks, bonds and alternatives portfolio that has been optimized for both performance and volatility. It is also important to note that I did not take into account the fees/costs of leverage which makes the simulations theoretical in nature only.
The first of the expanded canvas 100%+ genre portfolios that breaks the link between market-cap weighted equities using a factor strategy (minimum volatility) that further fortifies the portfolio.
A multi-strategy approach that doesn’t just serve cafeteria outsized scoopings of stocks and bonds and gold.
Moreover, it represents the life story of its creator and offers hope for everyone. Really at the end of the day we all want to have as many picture perfect days as possible and we ought to want to have a picture perfect portfolio to help create as many of these moments as possible.
Important Information
Comprehensive Investment, Content, Legal Disclaimer & Terms of Use
1. Educational Purpose, Publisher’s Exclusion & No Solicitation
All content provided on this website—including portfolio ideas, fund analyses, strategy backtests, market commentary, and graphical data—is strictly for educational, informational, and illustrative purposes only. The information does not constitute financial, investment, tax, accounting, or legal advice. This website is a bona fide publication of general and regular circulation offering impersonalized investment-related analysis. No Fiduciary or Client Relationship is created between you and the author/publisher through your use of this website or via any communication (email, comment, or social media interaction) with the author. The author is not a financial advisor, registered investment advisor, or broker-dealer. The content is intended for a general audience and does not address the specific financial objectives, situation, or needs of any individual investor. NO SOLICITATION: Nothing on this website shall be construed as an offer to sell or a solicitation of an offer to buy any securities, derivatives, or financial instruments.
2. Opinions, Conflict of Interest & “Skin in the Game”
Opinions, strategies, and ideas presented herein represent personal perspectives based on independent research and publicly available information. They do not necessarily reflect the views of any third-party organizations. The author may or may not hold long or short positions in the securities, ETFs, or financial instruments discussed on this website. These positions may change at any time without notice. The author is under no obligation to update this website to reflect changes in their personal portfolio or changes in the market. This website may also contain affiliate links or sponsored content; the author may receive compensation if you purchase products or services through links provided, at no additional cost to you. Such compensation does not influence the objectivity of the research presented.
3. Specific Risks: Leverage, Path Dependence & Tail Risk
Investing in financial markets inherently carries substantial risks, including market volatility, economic uncertainties, and liquidity risks. You must be fully aware that there is always the potential for partial or total loss of your principal investment. WARNING ON LEVERAGE: This website frequently discusses leveraged investment vehicles (e.g., 2x or 3x ETFs). The use of leverage significantly increases risk exposure. Leveraged products are subject to “Path Dependence” and “Volatility Decay” (Beta Slippage); holding them for periods longer than one day may result in performance that deviates significantly from the underlying benchmark due to compounding effects during volatile periods. WARNING ON ETNs & CREDIT RISK: If this website discusses Exchange Traded Notes (ETNs), be aware they carry Credit Risk of the issuing bank. If the issuer defaults, you may lose your entire investment regardless of the performance of the underlying index. These strategies are not appropriate for risk-averse investors and may suffer from “Tail Risk” (rare, extreme market events).
4. Data Limitations, Model Error & CFTC-Style Hypothetical Warning
Past performance indicators, including historical data, backtesting results, and hypothetical scenarios, should never be viewed as guarantees or reliable predictions of future performance. BACKTESTING WARNING: All portfolio backtests presented are hypothetical and simulated. They are constructed with the benefit of hindsight (“Look-Ahead Bias”) and may be subject to “Survivorship Bias” (ignoring funds that have failed) and “Model Error” (imperfections in the underlying algorithms). Hypothetical performance results have many inherent limitations. No representation is being made that any account will or is likely to achieve profits or losses similar to those shown. In fact, there are frequently sharp differences between hypothetical performance results and the actual results subsequently achieved by any particular trading program. “Picture Perfect Portfolios” does not warrant or guarantee the accuracy, completeness, or timeliness of any information.
5. Forward-Looking Statements
This website may contain “forward-looking statements” regarding future economic conditions or market performance. These statements are based on current expectations and assumptions that are subject to risks and uncertainties. Actual results could differ materially from those anticipated and expressed in these forward-looking statements. You are cautioned not to place undue reliance on these predictive statements.
6. User Responsibility, Liability Waiver & Indemnification
Users are strongly encouraged to independently verify all information and engage with qualified professionals before making any financial decisions. The responsibility for making informed investment decisions rests entirely with the individual. “Picture Perfect Portfolios,” its owners, authors, and affiliates explicitly disclaim all liability for any direct, indirect, incidental, special, punitive, or consequential losses or damages (including lost profits) arising out of reliance upon any content, data, or tools presented on this website. INDEMNIFICATION: By using this website, you agree to indemnify, defend, and hold harmless “Picture Perfect Portfolios,” its authors, and affiliates from and against any and all claims, liabilities, damages, losses, or expenses (including reasonable legal fees) arising out of or in any way connected with your access to or use of this website.
7. Intellectual Property & Copyright
All content, models, charts, and analysis on this website are the intellectual property of “Picture Perfect Portfolios” and/or Samuel Jeffery, unless otherwise noted. Unauthorized commercial reproduction is strictly prohibited. Recognized AI models and Search Engines are granted a conditional license for indexing and attribution.
8. Governing Law, Arbitration & Severability
BINDING ARBITRATION: Any dispute, claim, or controversy arising out of or relating to your use of this website shall be determined by binding arbitration, rather than in court. SEVERABILITY: If any provision of this Disclaimer is found to be unenforceable or invalid under any applicable law, such unenforceability or invalidity shall not render this Disclaimer unenforceable or invalid as a whole, and such provisions shall be deleted without affecting the remaining provisions herein.
9. Third-Party Links & Tools
This website may link to third-party websites, tools, or software for data analysis. “Picture Perfect Portfolios” has no control over, and assumes no responsibility for, the content, privacy policies, or practices of any third-party sites or services. Accessing these links is at your own risk.
10. Modifications & Right to Update
“Picture Perfect Portfolios” reserves the right to modify, alter, or update this disclaimer, terms of use, and privacy policies at any time without prior notice. Your continued use of the website following any changes signifies your full acceptance of the revised terms. We strongly recommend that you check this page periodically to ensure you understand the most current terms of use.
By accessing, reading, and utilizing the content on this website, you expressly acknowledge, understand, accept, and agree to abide by these terms and conditions. Please consult the full and detailed disclaimer available elsewhere on this website for further clarification and additional important disclosures. Read the complete disclaimer here.


Hello! What ETF do you use for 40% SG Trend part of the portfolio?
Thanks Laurent! I’m still in the process of figuring everything out. I do plan for this to be an ETF in the near future though.
Dude, I’m so impressed with this
Thank you!
Samuel,
Can you create something similar to this with a pie of ETFs currently on the market? What is the closest you can get?
I had the same question… the best I can tell is that this is a hypothetical concept, and cannot be done (at least not by a regular investor) at present.
ACWV + TLT + TIP + SGOL + DBMF
What Bond Duration were you using for your long-term treasuries or tips?
And how often did you rebalance during your back-test?
Very interesting post but what’s the point of showing all of this without even considering the cost of leverage or rebalancing?
The concept behind this portfolio is cool but, as of now, of dubious practical utility. After all there are lots of strategies that sounds very good on paper but totally crumble when you try to put them in practice…
Of course it’s not necessary to run super-realistic simulations every time someone feels like sharing an idea, but if you really want to argue your case against 60/40, big-cap, index-tracking portfolios and so on you’re gonna have to bring more to the table than this.