Time is a precious commodity in financial markets, where price changes can be swift, rumors swirl incessantly, and new data points emerge at a staggering pace. Even those who adopt a steady, long-term investment philosophy often find themselves in situations demanding rapid decisions—perhaps about an impromptu buying opportunity or a fast-moving stock that’s suddenly in the headlines. In these scenarios, having a streamlined method for evaluating a stock can be a tremendous advantage.

The concept we’ll explore here is what some traders and analysts label a “60-second stock check.” It’s precisely what it sounds like: a quick, one-minute pass at the fundamentals of a stock that helps you decide if it’s worth investigating further. This approach doesn’t replace thorough due diligence, which remains essential for any major or long-term investment. However, it can serve as an efficient filter, letting you eliminate suspicious or unsuitable opportunities and focus your deeper research on those that pass this short test.
Imagine you come across a stock tip from a friend who claims it will double in a year. Or maybe you read a tweet about a small-cap biotech supposedly ready to disrupt the healthcare sector. Before you devote hours to reading SEC filings or sifting through quarterly reports, you can run a quick fundamentals check to determine whether it even looks plausible. That’s the beauty of this approach. It’s not about guaranteeing you find the next Apple or Amazon; it’s about triage—deciding which names deserve more of your limited time.

60 Second 6 Step Procedure
We’ll present a six-step procedure you can execute in about 60 seconds. Each step zeroes in on a vital aspect of a stock’s health or potential, from basic price metrics (like market cap) to earnings growth or debt levels. You won’t become an expert on the company by the end of your minute, but you’ll have a rapid snapshot. If the snapshot is discouraging—say, outlandish valuations or negative earnings momentum—you’ll know to skip it for now. If it looks promising, you’ll queue it up for deeper exploration.
Why is this skill so useful? In a market brimming with thousands of publicly traded firms, you can’t possibly examine each one deeply. Even among professional analysts, coverage can be selective, with many smaller or newly listed companies receiving minimal attention. Being able to compress your initial research into a methodical, minute-long routine ensures you keep up without being overwhelmed. It’s akin to a doctor conducting a quick triage exam: if you see alarming symptoms, you proceed with caution; if everything seems in order, you might proceed to a more comprehensive check-up.
Before we jump into the actual steps, we’ll discuss the concept of a 60-second stock check in more detail—why it matters, what it can realistically achieve, and what it can’t. We’ll also clarify its limitations: you don’t want to invest your life savings in a stock solely because it aced a one-minute evaluation. Instead, it’s your gateway to more rigorous analysis. Finally, we’ll share examples to illustrate how you might use this strategy for different types of stocks—like a growth-oriented tech name, a high-dividend utility, or a value play with a mid-market capitalization.
Let’s get started. Understanding what a 60-second check is—and isn’t—lays the groundwork for applying it effectively. This approach can act as your fast filter for potential “green flags” or glaring red ones.
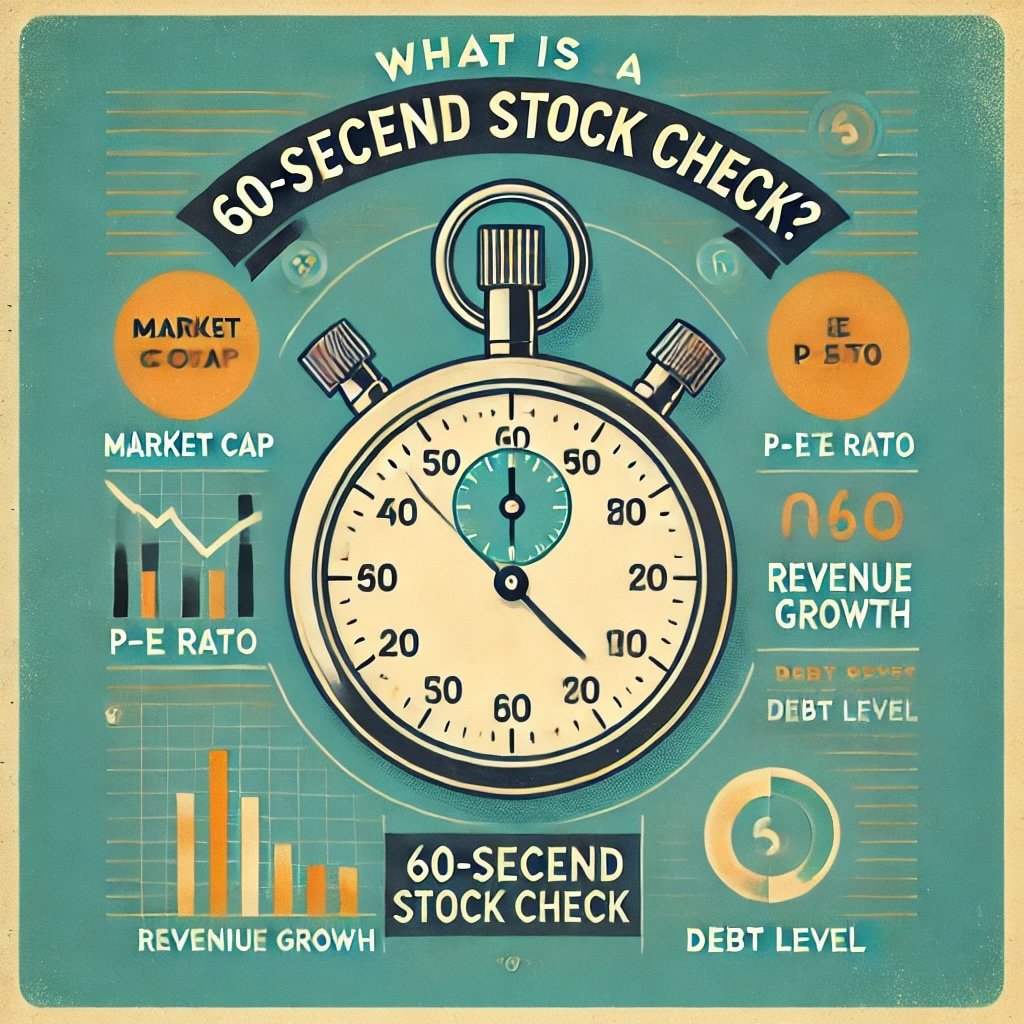
What Is a 60-Second Stock Check?
Definition
A 60-second stock check is exactly what the name suggests: a very quick inspection of a company’s fundamentals to gauge whether it’s intriguing or questionable at a glance. Unlike a more thorough analysis that might consume hours (sifting through earnings calls, reading 10-K filings, analyzing competitive landscapes), this short procedure is minimalistic. You open your preferred data source—maybe a brokerage app or a financial website—and scan a handful of key statistics or indicators.
This technique has evolved as a response to the frenetic pace of modern market news. Day traders and short-term players often do “chart checks” in seconds, but fundamental investors also need a swift approach to separate potential gems from worthless hype. The 60-second stock check addresses that necessity.
Why It’s Important
In an era of rapid information flow, you frequently stumble upon new tickers or “hot picks.” Maybe you attend a conference, hear a pundit’s mention of some overlooked small-cap, or notice your social media feed abuzz with chatter about a newly IPO’d biotech. If you tried to research each lead in depth, you’d quickly drown in data. Thus, an efficient triage system is crucial.
Equally relevant is how this approach helps you avoid emotional or herd-driven impulses. Sometimes, the momentum or hype around a stock feels compelling, but a quick check might reveal a nosebleed-level P/E ratio or a dire debt situation. That immediate reality check can keep you from jumping headfirst into a money pit.
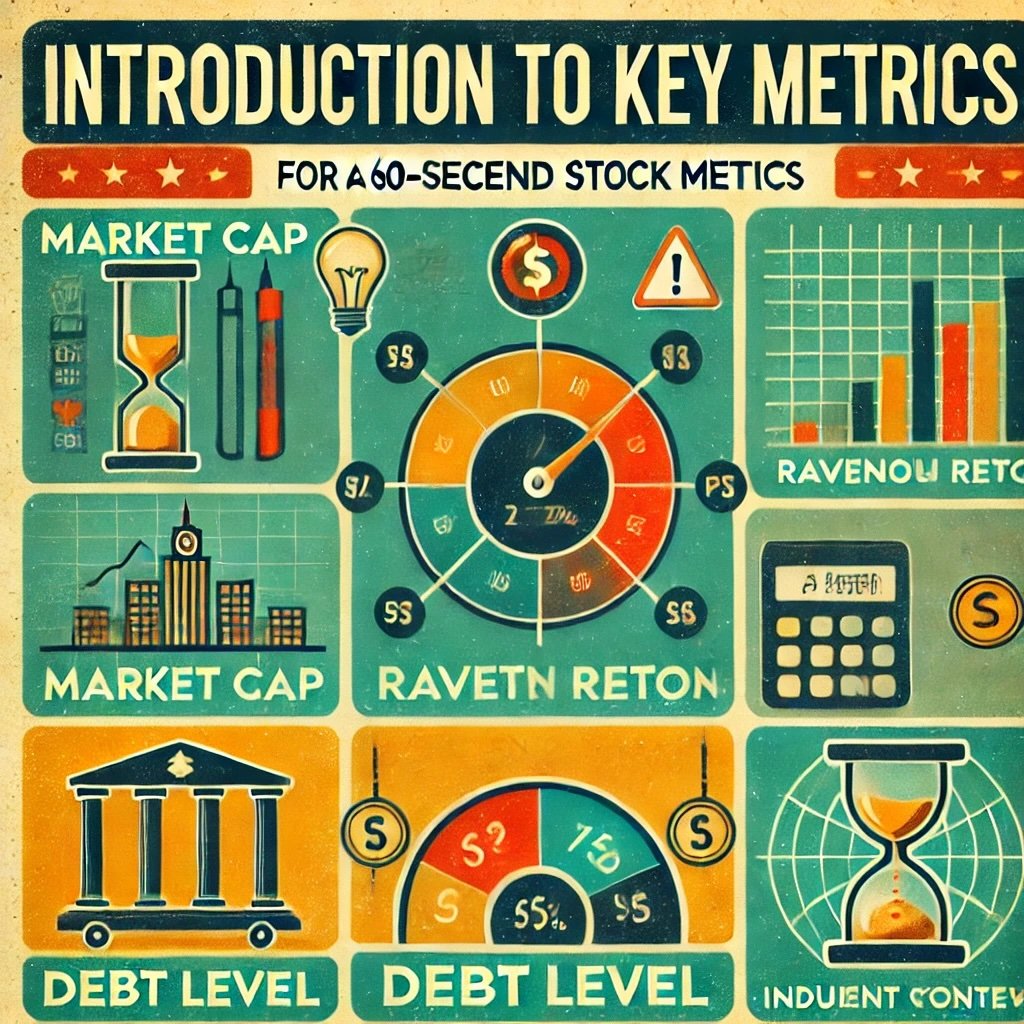
Introduction to Key Metrics
In a 60-second examination, you can’t review everything. You’ll concentrate on metrics that paint a broad yet telling picture. These typically include:
- Price and Market Cap: Tells you if you’re dealing with a giant like Apple or a micro-cap upstart.
- P/E Ratio: Offers a quick sense of valuation, though context is vital.
- Revenue and Earnings Growth: Even a cursory glance at recent growth rates can signal momentum or stagnation.
- Debt Level: An unmanageable debt load is often a flashing red light.
- Dividend Yield (if relevant): For dividend investors seeking quick income checks.
- Industry or Sector Context: The big picture—what environment this company operates in and whether it’s booming or troubled.
In the final step, you usually ask: “Does this look interesting or suspicious enough to warrant deeper research?” That’s your go/no-go line.
Importance of Understanding the Limitations
While the time-saving allure is strong, you must remember that a 60-second snapshot is not the last word on an investment’s worthiness. Sometimes the data you see might be outdated or incomplete. For instance, you might find a robust revenue growth figure but miss a pivotal detail about a looming lawsuit or an expiring patent. Or you could spot a low P/E ratio and assume the stock is cheap, without realizing the industry’s average P/E is even lower.
Hence, think of this method as the top layer of your research funnel—helpful for sifting through many choices but far from conclusive. If your mini-check passes the stock as “potentially interesting,” that signals you to do a thorough deep dive. If it fails, you can likely move on without regret, focusing energy on better prospects.
Potential Contexts of Usage
Short-term traders might find a 60-second check useful for verifying fundamentals before a quick trade. Even though technicals often guide them, certain fundamental red flags—like a recent earnings miss—may influence short-term patterns. Long-term investors frequently rely on more in-depth analysis but can still benefit from quickly scanning numerous stocks that appear on their radar. If one stands out after a 60-second pass, they might commit more time to analyzing competitive advantage, management, or profitability details.
From a psychological standpoint, this technique can also help you remain rational in a hype-laden environment. If a friend or a social media influencer touts a “hidden gem,” you can do a rapid check to confirm if that gem’s metrics are truly shining or tarnished. This minimal barrier helps quell impulsive decisions—like buying into a random recommendation—without letting the potential gem slip by if it does hold real promise.
Preparing for a Quick Stock Check
A rushed or haphazard approach can undermine the very efficiency you’re seeking, so it’s essential to know what tools you’ll use, which metrics deserve your split-second attention, and what results you can realistically glean from such a rapid evaluation. Let’s outline the preparatory steps to ensure you’re set up for success.
Tools and Resources
To conduct a 60-second stock check, you need fast, reliable access to key data points. Typical resources include:
- Yahoo Finance, Google Finance, or your broker’s trading platform. Each typically has a summary page with essential stats—market cap, P/E ratio, dividend yield, earnings, and so forth.
- Financial news apps: Many display quick metrics when you punch in a ticker symbol.
- Smartphone or tablet: If you’re on the go, a mobile app can load the summary in seconds.
You don’t need advanced charting tools at this stage, nor do you need full 10-Ks. The aim is to glean the broad fundamentals. A recommended best practice is to have a watchlist or a typical reference site bookmarked so you can jump in quickly.
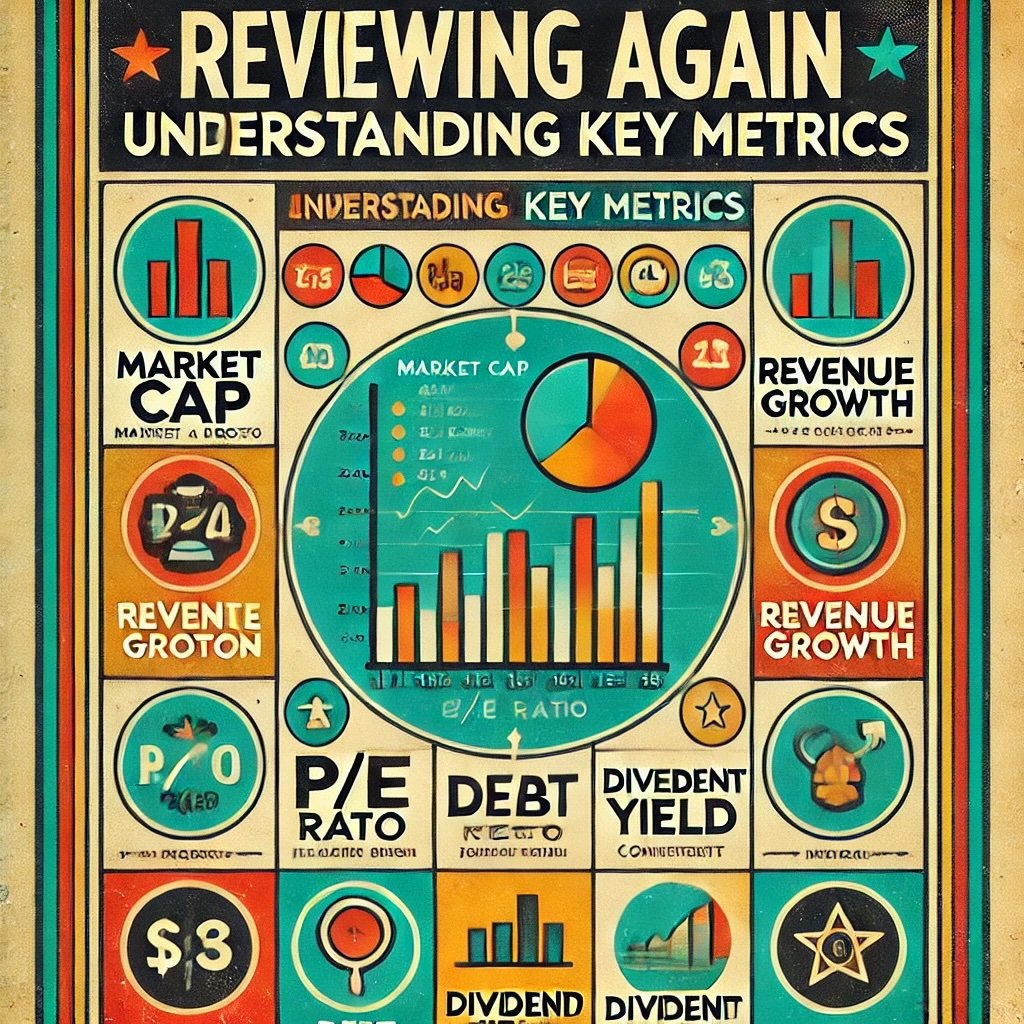
Reviewing Again: Understanding Key Metrics
Before you start, ensure you fully grasp the handful of metrics you’ll rely on. At a minimum:
- Market Cap: Tells you if it’s a large-cap (usually stable, but slower growth), a mid-cap, or a small/micro-cap (riskier, potentially higher growth).
- P/E Ratio: Price-to-Earnings ratio. A quick gauge of whether the market might be overvaluing or undervaluing the stock relative to its current earnings. But remember, a “high” or “low” P/E depends on the industry and the company’s growth outlook.
- Revenue and Earnings Growth: A snapshot of momentum. If the last few quarters show consistent growth, that might signal positive trends. If it’s negative, a red flag.
- Debt: High debt relative to equity can cripple a company if conditions sour. Also, watch for short-term debt vs. available cash.
- Dividend Yield (if relevant): Only if you’re focusing on income. How stable is the yield, and how does it compare to similar companies?
- Sector/Industry: A glance at the sector’s health—like tech, healthcare, utilities—offers context. A strong company in a battered sector might be an undervalued gem or a struggling outlier.
Setting Realistic Expectations
The 60-second check is not a comprehensive analysis. You’re simply screening out obvious misfits and picking up potential winners for deeper research. In many cases, you’ll discover a stock that looks “meh” after this quick pass—its P/E ratio seems inflated, or its revenue is flat—and decide you’re not excited enough to proceed. That’s fine. You’ve saved precious time, better allocated elsewhere.
On the other hand, a promising stock might pass your quick test, prompting you to do a thorough dive later. That’s where you’d read about its business model, examine its cash flow statement, investigate management’s track record, and so forth. The 60-second check is akin to a gatekeeper: if a stock can’t clear that gate, it likely isn’t worth further effort, unless there’s a compelling reason (like new M&A news or a pivot in the business model).
Mindset and Efficiency
Lastly, approach this process with a certain mindset of “structured speed.” The goal is to be decisive yet data-driven. Don’t linger on each metric. If it’s a potential red flag, mentally note it and keep scanning. By the time you glance at the last metric, you should have a sense—“Yes, this might deserve 10 minutes of deeper reading,” or “Nah, let’s skip.” Overthinking can bloat your routine into a 10-minute check, which defeats the purpose.
Consider practicing on a few familiar stocks first. Challenge yourself to see if you can glean the essential points in under a minute. With repetition, you’ll sharpen your instincts, maybe even halving that time. But remember the caution: you’re scanning for big signals, not finalizing. The deeper dive remains a separate stage.
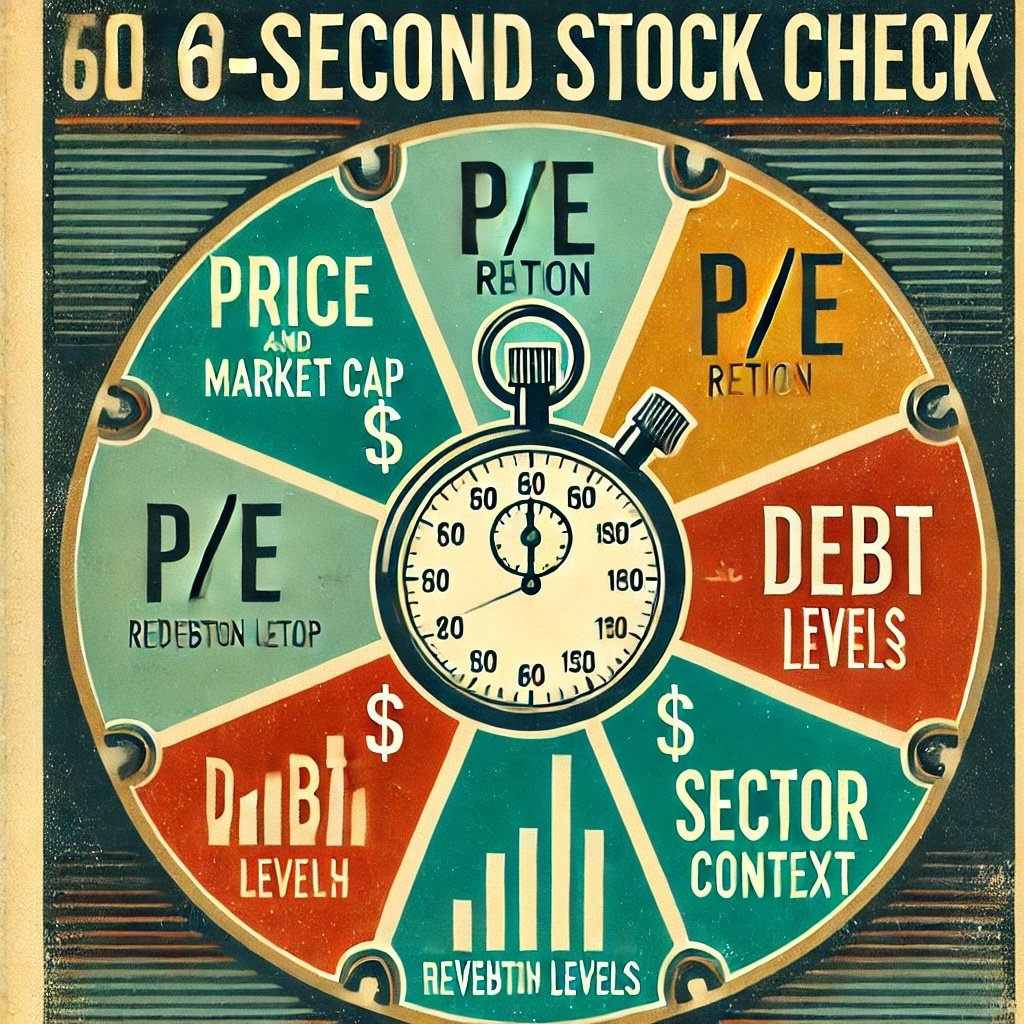
The 6 Steps of a 60-Second Stock Check
So you’re armed with the right resources, an understanding of the core metrics, and a healthy sense of what a quick check can accomplish. Let’s break down each of the six steps that can seamlessly fit into your one-minute timeframe. Depending on your familiarity with the stock or platform, you may take a bit longer at first, but practice can help you truly compress this routine into 60 seconds.
Step 1: Look at the Price and Market Cap
Time Allocation: ~10 seconds
When you type in a ticker symbol on a financial site or trading app, the first things you typically see are the current price and the market capitalization. The price itself doesn’t say much about value, but it does give you a sense of how big or small the stock is—especially combined with the market cap. For instance, a $20 share price for a micro-cap might mean the whole company is worth just $50 million. Conversely, a $200 share for a large-cap could represent a multi-billion-dollar giant. This is crucial because:
- Large-cap firms usually have more stable revenue, less dramatic price swings (though not always), and often pay dividends.
- Mid-cap or small-cap stocks might have faster growth potential but come with higher volatility.
At this stage, you’re deciding: “Do I even want to explore a micro-cap? Am I comfortable with the possible liquidity issues? Or am I searching for stable large-caps?”
Step 2: Review the P/E Ratio
Time Allocation: ~10 seconds
The price-to-earnings (P/E) ratio is your rapid proxy for valuation. If you see a P/E of 50, that can indicate the market believes in significant future growth or the stock might be overpriced. Meanwhile, a single-digit P/E might suggest undervaluation or a troubled outlook. Context matters: a P/E of 20 in tech might be normal, while a P/E of 20 in a slow-growing utility might be high. Use your prior knowledge of the industry’s typical P/E range as a quick yardstick. If the ratio is drastically out of line with sector norms—like 2-3 times higher—it’s either an incredibly promising growth story or a bubble.
Step 3: Check Revenue and Earnings Growth
Time Allocation: ~15 seconds
Many finance websites showcase a small chart or table of recent quarters or annual results. You want to see if revenues and earnings (sometimes labeled as net income or EPS—earnings per share) are trending up, stable, or down. Even a quick glance can be illuminating:
- Growth: If revenue and EPS are consistently climbing, that’s a good sign.
- Flat or Declining: Could suggest the company is in a stagnant phase or dealing with headwinds.
Also, watch for any yoy (year-over-year) data if available. If yoy growth has slowed from 20% to 2%, that abrupt deceleration might be concerning.
Step 4: Assess Debt Levels
Time Allocation: ~10 seconds
High debt can cripple a firm if economic conditions worsen or interest rates climb. Some platforms provide a “Debt-to-Equity” ratio or “Total Debt” figure in their key stats summary. If it’s absent, you might do a quick note for deeper research. But if it’s right there and it seems alarmingly high relative to the norm for that industry, consider it a caution sign. A moderate or low debt ratio is typically more comfortable, though certain capital-intensive sectors (like utilities) can carry higher debt by design. Keep context in mind.
Step 5: Examine Dividend Yield (if applicable)
Time Allocation: ~5 seconds
If the stock is known for dividends—like a utility or REIT—check the dividend yield. A yield significantly above the industry average might be unsustainable, especially if the payout ratio is extremely high (the portion of earnings dedicated to dividends). Conversely, a stable yield at a moderate level could be a reassuring source of passive income. If you’re not focusing on dividend income, you can skip or glance quickly at it to see if it hints at either stability or potential risk (like a yield that’s too good to be true).
Step 6: Evaluate Industry or Sector Context
Time Allocation: ~10 seconds
In your final moments, glean a sense of how the stock’s sector or industry is performing. Is it a tech company in a sector currently facing regulatory scrutiny or a cyclical stock nearing a possible downturn? Or perhaps an energy firm in a bullish environment for oil and gas? A quick read on sector trends can color your interpretation of the prior metrics. For example, a high P/E might be more acceptable in a booming sector, while it might be a serious red flag in an industry under pressure.
Total: 10 + 10 + 15 + 10 + 5 + 10 = 60 seconds. That’s your target.
Putting It All Together
After these steps, you should be able to decide: “Is this stock interesting enough to investigate further?” or “No, it fails too many metrics.” If you consider the stock promising, you proceed to a deeper dive—maybe reading the annual report or comparing it with peers. If it fails, you move on without remorse.
Remember, the 60-second check is a filter, not a verdict. That quick minute’s worth of scanning can spare you from sinking hours into an obviously flawed pick or letting a fleeting rumor distract you from your core strategy.
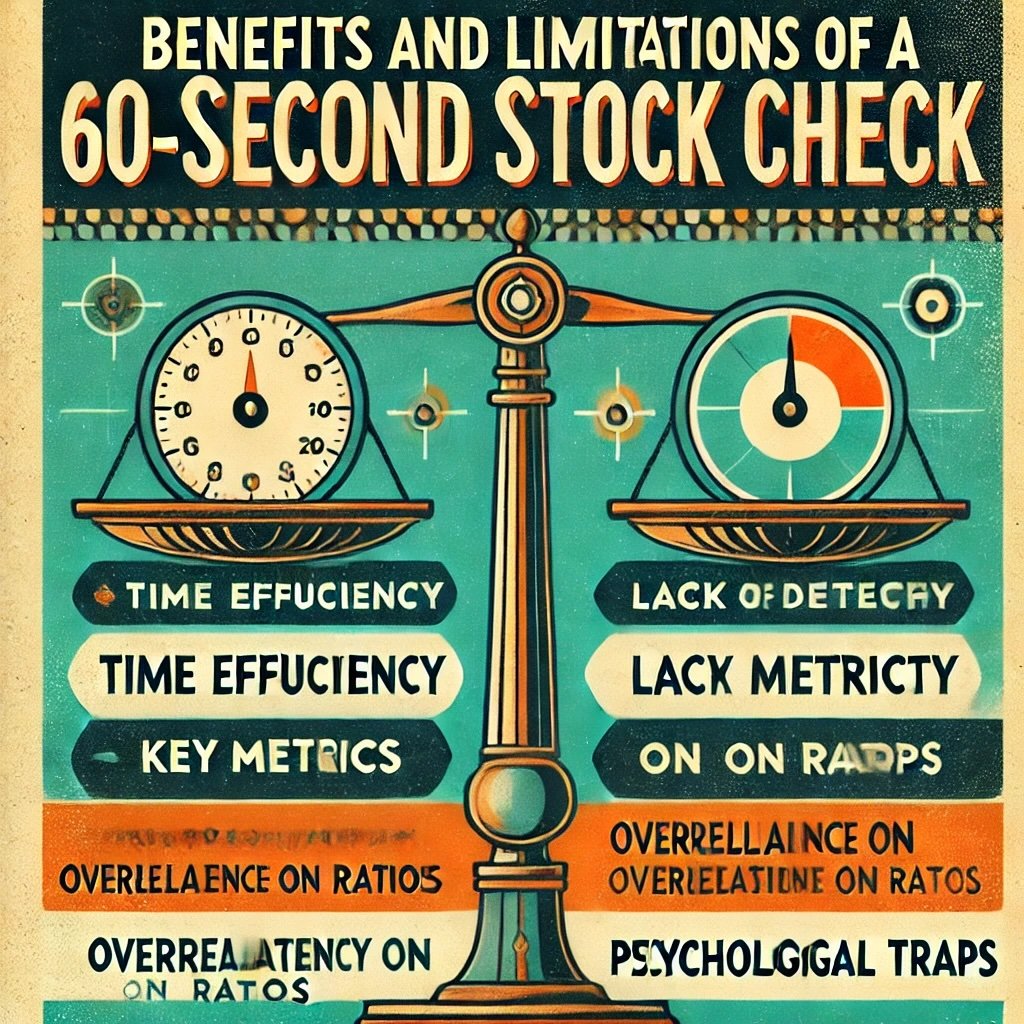
Benefits and Limitations of a 60-Second Stock Check
A fast approach to analyzing stocks carries obvious appeal: you save time, sift through numerous ideas swiftly, and focus deeper research on only the best candidates. Yet, there are trade-offs. Understanding both the advantages and limitations of a 60-second stock check ensures you use it wisely.
Benefits
- Time Efficiency: In an era when new stock ideas bombard you constantly—via social media, newsletters, or real-time alerts—an immediate triage process helps avoid getting bogged down. You can quickly isolate potential winners (or at least “worth more time”) from probable losers.
- Screening Capability: A quick fundamentals check can act like your personal screener. Even if you run a software-based screen for certain criteria, your manual 60-second scan can add a layer of qualitative nuance. Maybe you spot a concerning drop in revenue or an industry dynamic that the screener missed.
- Focus on Key Metrics: Sometimes, novices become overwhelmed by data. This streamlined approach narrows your focus to essential aspects—P/E ratio, revenue growth, debt, and so forth—helping you glean a company’s broad fundamentals without wading into unnecessary details at the outset.
- Early Red Flag Detection: If a stock’s ratio or debt level is glaringly off, you can see it right away. Suppose it’s carrying an unsustainable debt-to-equity ratio or has a negative earnings trend that’s accelerating. Better to discover that in the first minute than after hours of reading.
- Adaptable: You can tailor the 6-step method to your interests. If you love dividend plays, incorporate dividend history or payout ratio. If you’re more of a growth investor, you might put heavier weight on revenue growth or product pipeline mentions. The principle remains the same: a rapid glean that ensures you don’t miss glaring issues or skip obvious potential.
Limitations
- Lack of Depth: The biggest downside is precisely what makes it fast: it’s shallow. You won’t glean insights into a company’s competitive moat, management quality, or future product roadmap. Some crucial information, like pending litigation or new strategic alliances, might not appear in the quick data summary.
- Context Matters: A high P/E might be perfectly normal in a booming sector. Weak growth might be a momentary hiccup overshadowed by a promising product launch next quarter. A 60-second check can’t easily capture these nuances. You risk discarding a gem just because it looks expensive in the short lens.
- Overreliance on Basic Ratios: Ratios like P/E or Dividend Yield can be misleading if the underlying data is skewed—maybe due to one-off gains or losses. If you place too much faith in them without verifying, you might misjudge the company.
- Market Sentiment Ignored: The approach doesn’t incorporate real-time sentiment or macro factors. A stock might appear undervalued by fundamental metrics yet suffer from negative sentiment triggered by some external factor. Similarly, a stock may look robust but rely heavily on a niche that’s about to face regulatory action.
- Psychological Traps: Relying on a short checklist can tempt you into thinking you’ve “done the research.” One minute isn’t enough to truly understand a business’s complexities. If you lack discipline, you might skip deeper investigation and invest solely on the 60-second pass, which is risky.
Balancing Speed and Thoroughness
Ultimately, a 60-second stock check is best seen as the first rung of a research ladder. It streamlines your process by quickly gating out (or gating in) potential picks. But it must be supplemented with deeper analysis if the initial read seems promising. This layered approach is akin to how recruitment works: a quick skim of a resume might disqualify an unqualified candidate or highlight a standout one, yet you’d never hire solely on that glance.

Practical Examples of a 60-Second Stock Check
So how does the six-step routine we’ve outlined actually look in real scenarios? Let’s illustrate with three hypothetical (yet realistic) examples to see how you might apply the 60-second fundamentals check. Each stock type faces different metrics that might stand out, but the core process remains the same.
Example 1: Tech Growth Stock
Imagine you stumble upon a mid-cap technology company rumored to have a breakthrough in artificial intelligence. The stock’s ticker is popping up on social media, and you want a quick read before devoting more time.
- Step 1: Price and Market Cap: You see the stock is trading at $75 with a market cap of $6 billion—so it’s a mid-cap, big enough to be somewhat established but not a mega-corporation.
- Step 2: P/E Ratio: Quick glance reveals a P/E of 45. Higher than the overall market’s average, which might range 15-20, but not unusual for a tech growth player. You note the ratio’s on the higher side, so you sense it might be priced for rapid expansion.
- Step 3: Revenue and Earnings Growth: The data shows revenue up 25% year-over-year and earnings up 15%. That’s solid, though you’d hope for synergy in their profit growth or maybe see if it’s accelerating or decelerating.
- Step 4: Debt Levels: A quick ratio shows moderate debt relative to equity, maybe a 0.5 debt-to-equity ratio. Not alarming. Possibly okay for a tech firm in a growth phase.
- Step 5: Dividend Yield: None, which is typical for growth-centric tech. No surprise there.
- Step 6: Industry Context: Tech overall is in a bullish wave, but you know competition is fierce. The ETF representing the broader tech sector is up 20% this year, so this stock’s performance likely rides that wave, possibly outpacing peers or lagging.
Verdict: The P/E is quite high, but that’s not unusual in a potential high-growth scenario. The revenue growth is decent. No glaring red flags. You might decide to bookmark it for deeper analysis, especially to confirm if that rumored AI breakthrough is credible or hype.
Example 2: High-Dividend Utility Stock
Next, you find a utility stock offering a tempting 5% dividend yield, which is notably above the industry average of around 3%. It’s a stable sector but often yields moderate returns.
- Step 1: Price and Market Cap: The stock trades at $28 with a market cap of $10 billion—clearly a mid to large utility.
- Step 2: P/E Ratio: The ratio is around 17, which is not outrageous, especially for a utility that usually sees a P/E of 15-20.
- Step 3: Revenue and Earnings Growth: Over the past year, revenue grew a mild 3%, while earnings grew 2%. Slow growth is typical for utilities. Nothing exceptional, but it’s consistent.
- Step 4: Debt Levels: Debt is moderately high, with a debt-to-equity ratio around 1.2. This is somewhat normal for utilities, which rely heavily on capital expenditures. Still, you note it’s not too alarming.
- Step 5: Dividend Yield: 5% stands out. Could be a yield trap if the company’s fundamentals are eroding, but so far, stable revenue suggests it might be sustainable. You note to check the payout ratio next time.
- Step 6: Industry Context: Utilities typically do well in lower-growth or turbulent markets, offering relative safety. No big scandal or regulatory shift mentioned.
Verdict: The fundamentals appear stable, the yield is appealing. Possibly worth a deeper look to confirm the dividend’s safety and whether the slightly elevated yield signals hidden issues or genuine generosity toward shareholders.
Example 3: Undervalued Mid-Cap Stock
Finally, you come across a mid-cap industrial firm said to be undervalued. Perhaps it’s overshadowed by bigger names in its sector, but a friend touts it as a bargain.
- Step 1: Price and Market Cap: $15 share price, $2 billion market cap. A moderate-sized player, not tiny but overshadowed by sector giants.
- Step 2: P/E Ratio: 9. That’s fairly low. Could indicate a bargain or that the market sees major headwinds.
- Step 3: Revenue and Earnings Growth: Sales growth is around 4% yoy, earnings basically flat. Not explosive, but not in freefall.
- Step 4: Debt Levels: Debt-to-equity ratio of 2.0 is somewhat high. Might be cause for caution, especially if interest rates rise.
- Step 5: Dividend Yield: 2%. It’s something, but not huge. Possibly a sign that management is balancing reinvestment with shareholder returns.
- Step 6: Industry Context: The broader industrial sector has seen cyclical upturns, but also trade uncertainties. If cyclical conditions shift, this stock could either rally if the economy stays robust or slump if a downturn hits.
Verdict: The low P/E intrigues you. The debt ratio is a red flag, though. You’d likely want a deeper look at the debt maturity schedule and the underlying competitiveness. Still, it’s not a dead end—some cyclical industrial names bounce strongly once the cycle turns.

12-Question FAQ: How to Conduct a 60-Second Stock Check (Quick Fundamentals)
What is a “60-second stock check”?
A rapid, one-minute scan of key fundamentals to decide if a ticker deserves deeper research. It’s a triage filter, not a buy/sell signal—use it to promote candidates to your long-form due diligence.
What metrics should I glance at first?
Six fast pillars: Price & Market Cap → P/E (or EV/EBITDA if negative earnings) → Revenue & EPS trend → Debt (D/E or Net Debt/EBITDA) → Dividend yield & payout (if applicable) → Sector/industry context.
How do I allocate my 60 seconds?
~10s Price/Cap, ~10s P/E or EV/EBITDA, ~15s Growth (rev/EPS), ~10s Debt, ~5s Dividend, ~10s Industry context. With practice, you’ll compress to ~40–50s.
What are instant red flags?
Exploding leverage (very high D/E or Net Debt/EBITDA rising).
Decelerating or negative EPS with a high P/E (multiple without support).
Yield too high for the sector (possible cut) and payout ratio >100%.
Serial share dilution alongside weak growth.
One-off gains inflating EPS masking weak core results.
What are quick green flags?
Consistent YoY revenue and EPS growth (multi-quarter).
Reasonable valuation vs. sector and growth profile.
Manageable leverage and healthy interest coverage.
Stable or growing dividend with sane payout (income names).
Sector tailwinds or improving industry cycle.
How do I adapt the check for growth stocks?
Downplay trailing P/E if earnings are thin; favor top-line growth, gross margin trend, operating leverage, and cash runway (for earlier-stage firms). Still sanity-check valuation vs. peers (EV/Sales).
How do I adapt it for dividend or value names?
Emphasize payout ratio, dividend history, free cash flow, and balance-sheet strength. For value, compare P/E, P/B, EV/EBITDA to sector medians and scan for catalysts (buybacks, asset sales, cycle turns).
What if earnings are negative?
Switch to EV/Sales, EV/GP, or EV/EBITDA (if positive EBITDA). Focus on cash burn, liquidity, and a credible path to profitability.
How do I handle sector context quickly?
Glance at a sector ETF move YTD/MTD or a headline trend: tightening/loosening rates (financials, REITs), commodity cycle (energy/materials), regulation (tech/healthcare), consumer strength (discretionary).
What’s the fastest way to check debt risk?
Look for Debt/Equity or Net Debt/EBITDA on the overview page and a current ratio/cash line. If leverage is high for the sector and rates are rising, flag for deeper review of maturities.
What happens after a stock “passes” the 60-second screen?
Queue a deeper dive: 10-K/10-Q, earnings transcript, segment/margin analysis, competitor comps, valuation cross-checks, and risk map (litigation, customer concentration, FX, cyclicality).
Any common mistakes to avoid?
Confusing speed with certainty, ignoring one-offs in EPS, over-trusting a single ratio, skipping peer context, and letting hype or fear override your rule-based snapshot.
Final Thoughts
Making swift and intelligent choices in the market isn’t about replacing deep analysis with a single minute of glancing at numbers. Rather, it’s about employing a methodical filter that spares you from pouring hours into every stock mention that surfaces in your feed or conversation. The 60-second stock check emerges as a practical, time-saving tool—one that instantly spotlights glaring positives or negatives.
Over time, you may fine-tune which metrics you prioritize. Some folks fixate on cash flow or margin trends; others check the short interest or a quick reading of insider transactions. The template we described is simply a starting point, focusing on widely recognized indicators that typically appear on any finance site’s summary page. If your strategy hinges on dividends, you might zero in on yield or payout ratio. Growth investors might emphasize revenue acceleration. Value seekers might want a forward P/E or price-to-book ratio. The method remains the same: scanning systematically, ensuring you don’t get stuck on one or two data points at the expense of ignoring others.
In an environment where countless new stock ideas vie for your attention daily, honing the skill of rapid assessment can be indispensable. You not only streamline your own research but also fortify yourself against emotional impulses triggered by momentum or fear. If you confirm that a stock is too expensive, too indebted, or not growing enough, you can discard it swiftly. If it looks stable or brimming with potential, you deepen your analysis when you have more time.
Finally, think about how this tool merges with your broader investment process. Typically, it’s the initial filter, after which you might read a company’s earnings transcript or glance at a competitor’s metrics to see if the industry is robust. The speed and clarity gained at this preliminary stage can preserve your most valuable asset—time—for the truly worthy deep-dives. So try it out, refine it, and watch how a 60-second routine can sharpen your ability to navigate today’s complex market.
Important Information
Comprehensive Investment Disclaimer:
All content provided on this website (including but not limited to portfolio ideas, fund analyses, investment strategies, commentary on market conditions, and discussions regarding leverage) is strictly for educational, informational, and illustrative purposes only. The information does not constitute financial, investment, tax, accounting, or legal advice. Opinions, strategies, and ideas presented herein represent personal perspectives, are based on independent research and publicly available information, and do not necessarily reflect the views or official positions of any third-party organizations, institutions, or affiliates.
Investing in financial markets inherently carries substantial risks, including but not limited to market volatility, economic uncertainties, geopolitical developments, and liquidity risks. You must be fully aware that there is always the potential for partial or total loss of your principal investment. Additionally, the use of leverage or leveraged financial products significantly increases risk exposure by amplifying both potential gains and potential losses, and thus is not appropriate or advisable for all investors. Using leverage may result in losing more than your initial invested capital, incurring margin calls, experiencing substantial interest costs, or suffering severe financial distress.
Past performance indicators, including historical data, backtesting results, and hypothetical scenarios, should never be viewed as guarantees or reliable predictions of future performance. Any examples provided are purely hypothetical and intended only for illustration purposes. Performance benchmarks, such as market indexes mentioned on this site, are theoretical and are not directly investable. While diligent efforts are made to provide accurate and current information, “Picture Perfect Portfolios” does not warrant, represent, or guarantee the accuracy, completeness, or timeliness of any information provided. Errors, inaccuracies, or outdated information may exist.
Users of this website are strongly encouraged to independently verify all information, conduct comprehensive research and due diligence, and engage with qualified financial, investment, tax, or legal professionals before making any investment or financial decisions. The responsibility for making informed investment decisions rests entirely with the individual. “Picture Perfect Portfolios” explicitly disclaims all liability for any direct, indirect, incidental, special, consequential, or other losses or damages incurred, financial or otherwise, arising out of reliance upon, or use of, any content or information presented on this website.
By accessing, reading, and utilizing the content on this website, you expressly acknowledge, understand, accept, and agree to abide by these terms and conditions. Please consult the full and detailed disclaimer available elsewhere on this website for further clarification and additional important disclosures. Read the complete disclaimer here.


