
The tracking error pain of holding a pure value strategy while growth runs wild is a specific kind of psychological torture. To my eyes, the biggest mistake DIY investors make isn’t ignoring value—it’s buying negative-momentum garbage and calling it a bargain. If you lived through the 2010-2020 value winter or held a multi-fund portfolio and watched your deep-value sleeve bleed out against a cap-weighted index for three years straight, you know exactly what I mean. At its core, value investing entails hunting for stocks trading below what their intrinsic characteristics suggest they’re worth. The math sounds simple: buy an asset at a severe discount to its underlying cash flows, and wait for the market to rationally re-rate it. However, the lived reality of executing this in a live portfolio is far more nuanced, and often, much more painful.

Not every low-multiple stock is a coiled spring. Many of them are cheap for an incredibly valid reason—their underlying unit economics are actively collapsing. These are the classic value traps: equities that look undervalued on a basic stock screener but offer zero mean-reversion potential because the business is structurally broken. You are catching a falling knife, and it usually ends with permanent capital destruction.
The math doesn’t lie. Sometimes a single-digit P/E is just the market correctly pricing in an impending bankruptcy.
Yet, the market isn’t perfectly efficient. There are genuine mispricings—undervalued gems—where temporary negative sentiment overshadows robust free cash flow, hidden asset value, or an imminent turnaround catalyst. Recognizing the mechanical difference between a structurally dying business and a temporarily mispriced cash-flow machine is what separates the successful value investor from the one left holding the bag during a broader market rally.
Why This Topic Matters
Value investing is not for the faint of heart; it demands immense behavioral discipline. You are systematically buying what the herd is actively puking. If your factor screens aren’t incredibly tight, you’ll end up accumulating a portfolio of dividend traps and obsolescent industries. Holding a value trap isn’t just about the opportunity cost of missing the S&P 500’s return; it’s about the behavioral friction it introduces to your entire portfolio architecture. The tax drag of holding a deteriorating high-yielder in a non-registered account actually erodes your wealth in real terms. You’re paying taxes on phantom distributions while the principal bleeds out, stubbornly waiting for a turnaround that the underlying mechanics guarantee will never arrive.
I used to think a low P/B ratio was a sufficient investment thesis. Honestly, learning to differentiate between a statistically cheap stock and a fundamentally broken business was the most expensive tuition I ever paid to the market. In the sections below, we are going to look under the hood of these two distinct equity profiles. We’ll examine:
- The mechanical definition of a value trap and the specific balance sheet liabilities that destroy shareholder capital.
- The quantitative fingerprint of an undervalued gem, focusing on the fundamental metrics that signal an asymmetric risk-reward profile.
- The factor screens and analytical tools required to filter out the noise and identify genuine intrinsic value, looking past outdated metrics.
- Specific historical case studies that highlight the brutal reality of cyclical investing.
- The behavioral guardrails you need to implement to prevent a single bad thesis from sinking your capital efficiency.
Let’s start by defining the trap.

Understanding Value Traps
Definition
A value trap is an equity that trades at optically low valuation multiples—like a depressed P/E, a discounted price-to-book (P/B), or an artificially inflated dividend yield—but offers zero forward-looking capital appreciation because the underlying business economics are permanently impaired. It’s not a market inefficiency; the market is pricing the asset correctly for its impending irrelevance.
A low multiple is meaningless if the cash flow is evaporating.
Common Characteristics of Value Traps
- Negative Earnings Revisions: A trailing P/E of 6 looks incredibly cheap until next quarter’s earnings drop by 40%. Stagnant or decaying net income with zero catalysts for margin expansion is the absolute hallmark of a trap.
- Lethal Debt Profiles: Excessive leverage destroys optionality. Companies that have to refinance massive debt loads at higher interest rates while revenues decline are essentially zombie corporations. The equity tranche is just a call option on a bankruptcy that hasn’t happened yet.
- Secular Industry Decay: If the entire sector is being cannibalized by better technology or shifting demographics, a cheap valuation is just a reflection of structural reality. You cannot out-invest a dying industry, no matter how cheap the shares look.
- Capital Destruction: Management teams that consistently misallocate capital—like executing debt-funded share buybacks at the top of the cycle or acquiring bloated competitors just to mask declining organic growth—will permanently impair book value.
- Dividend Yield Illusions: A 12% yield usually implies the market is actively pricing in an imminent dividend cut. Without the free cash flow to support the payout, the dividend is a mirage designed to lure in yield-chasing retail capital. When the cut happens, the stock price drops another 30% overnight.
Why Investors Fall for Value Traps
We are psychologically wired to hunt for bargains. It’s a massive behavioral blind spot. We look at a stock chart anchored to a historical high of $80, see it trading at $20, and automatically assume the gap represents guaranteed upside. That’s pure anchoring bias. I used to be one of those guys, thinking that just because a ticker had a recognizable brand name, it couldn’t possibly be dead money. The implementation gap between a clean factor backtest and the lived reality of holding a structurally broken company is staggering. When you ignore negative momentum and fundamental decay, you aren’t being a contrarian; you’re just providing exit liquidity for institutional algorithms.
Blind contrarianism is just financial self-sabotage.
Examples in Practice
- A brick-and-mortar retailer heavily reliant on physical foot traffic that refuses to invest in logistics. The P/E looks fantastic, but same-store sales are bleeding out quarter after quarter.
- A legacy tech hardware manufacturer entirely dependent on on-premise solutions in a cloud-first world. They pay a massive dividend, but their R&D budget has been slashed to the bone to fund it.
In both scenarios, the superficial valuation metrics scream “buy,” but the underlying fundamentals dictate a permanent impairment of capital. Over an extended holding period, the share price will continue to grind lower, destroying whatever yield you managed to collect along the way.
You have to respect the underlying mechanics of the business.
By rigidly filtering out equities with declining cash flows, toxic balance sheets, and negative momentum, you can drastically reduce the drawdown risk in your value sleeve. But avoiding the trash is only half the battle. The real alpha is found in identifying the temporary dislocations.
What Makes an Undervalued Gem?
Definition
An undervalued gem is a mechanically sound, capital-efficient business suffering from temporary negative sentiment. The core economic engine—gross margins, return on invested capital, free cash flow conversion—is fully intact or even accelerating, but the market has violently overreacted to short-term noise, regulatory fears, or a cyclical dip. Unlike a trap, a gem possesses the structural integrity to survive the drawdown and eventually force the market into a re-rating.
It’s an asymmetric bet on a fundamentally superior asset.

Key Traits of Undervalued Gems
- Capital Efficiency and Profitability
- The firm consistently produces high-quality earnings or robust free cash flow without relying on aggressive, one-time accounting adjustments.
- The balance sheet is fortified. They have low cost of debt, high interest coverage ratios, and tangible assets that provide a hard floor to the valuation.
- Organic growth potential remains intact, whether through regional expansion or pricing power that outpaces inflation.
- Transitory Headwinds
- The stock was brutally punished for a supply chain disruption or a one-time litigation expense. If the core operating model is unimpaired, these events create phenomenal entry points for the patient investor.
- Management is actively rationalizing costs, expanding margins, and focusing on core competencies rather than mindless empire-building.
- Durable Economic Moats
- The company possesses high switching costs, network effects, or regulatory monopolies that protect its margins during inflationary regimes.
- Even if the broader index is violently rotating out of their sector, the company’s specific competitive advantage remains unchallenged.
- Insider Alignment and Capital Allocation
- Management is aggressively retiring outstanding shares at depressed multiples, actively shrinking the share count.
- When the C-suite is using their own after-tax capital for open-market buying shares, that can confirm the internal data is vastly superior to the external sentiment.
- A track record of highly accretive M&A rather than reckless, debt-fueled expansion.
You need both the fundamental engine and the alignment of capital.
Role of Market Sentiment
Sentiment is a brutal pendulum. When an entire sector falls out of favor, algorithmic trading, tax-loss harvesting, and ETF redemptions will indiscriminately dump high-quality operators right alongside the garbage. The bid-ask spread on thinly traded mid-caps during these liquidation events can be painful to watch. I’ve held concentrated positions in phenomenal businesses while the market completely ignored their cash flow generation for quarters on end.
Eventually, the math wins. When a heavily shorted, fundamentally sound company prints an earnings beat with expanding margins, the violent repricing upward is spectacular. But you have to possess the behavioral stamina to hold the asset through the ugly phase of the chart. The execution of the turnaround is what validates the thesis; without it, you’re just holding dead money and paying an opportunity cost.
Tools and Strategies to Differentiate Between the Two
You cannot rely on a single, isolated metric. If you just run a blunt P/B screen, you will inevitably build a portfolio heavily concentrated in distressed regional banks and obsolete industrial manufacturers. You need a multi-factor lens that interrogates the business from different angles—quality, value, and momentum—to ensure the structural integrity of your thesis. This is why modern systematic value funds (like Dimensional or Avantis) apply strict profitability screens (the RMW factor) to filter out the junk before it ever enters the portfolio.
Triangulate your data. Don’t trust a single ratio.
1. Fundamental Analysis
Financial Metrics:
- P/E and P/B: These are just the starting line. A low multiple is a prerequisite, but you must verify that the “E” (Earnings) and the “B” (Book) aren’t rapidly deteriorating. Standard P/B is notoriously flawed today because it fails to accurately value intangible assets like software and IP.
- ROE and ROIC: Return on equity or invested capital are your ultimate quality filters. A firm with 2% ROE might remain undervalued for good reason, while one with 15% ROE is more likely a gem if it’s still cheap. It tells you exactly how efficiently management is deploying retained earnings.
- Revenue and Earnings Growth: Look at the 3-to-5 year CAGR. If the top-line revenue is shrinking year over year, the business is dying. Period.
- Debt Ratios and Interest Coverage: Focus on Net Debt to EBITDA and the Interest Coverage ratio. A fundamentally cheap business that is choking on leverage is structurally fragile. You want robust interest coverage that guarantees survival through the trough of the cycle.
Dividends: The dividend must be evaluated entirely through the lens of the payout ratio and free cash flow. It’s a classic trap for value investors to chase a 9% yield funded by debt issuance. A sustainable, growing dividend backed by expanding free cash flow is a massive qualitative signal from management.
2. Qualitative Analysis
- Industry Assessment: Differentiate between secular decline (new technology destroying the old model) and cyclical downturns (temporary macroeconomic suppression). A cyclical low in a necessary industry is an opportunity; a secular decline is a death sentence.
- Management Quality: Read the proxy statements. Review their capital allocation track record. Are their compensation metrics tied to return on invested capital, or are they getting massive bonuses just for top-line revenue growth regardless of profitability?
- Competitive Moat: High switching costs, regulatory barriers to entry, and absolute pricing power are what allow a business to survive the ugly years.
A spreadsheet cannot measure corporate culture or moat durability.
3. Using Quantitative and Technical Tools
I know a lot of traditional value investors shy from technical or momentum-based signals, but ignoring the trend is a fantastic way to catch falling knives. Combining the value factor with the momentum factor is historically one of the most robust ways to construct a portfolio.
- Historical Price Performance: If a stock has been trending downward for 36 months, there is a very high probability that institutional money knows something you don’t.
- Support/Resistance and Trend: I want to see the fundamentals stabilize, and then I want to see the price action confirm the thesis. A cheap stock that reclaims its 200-day moving average is infinitely more interesting than a cheap stock hitting fresh 52-week lows.
- Comparisons to Industry Peers: If the entire sector is universally despised and trading at a massive discount, it might be a macro regime shift rather than an idiosyncratic failure.
4. Avoiding Biases
The urge to average down on a loser is the single most destructive behavioral tick in DIY investing. We get anchored to our original entry price and refuse to admit the thesis broke. To protect your portfolio from yourself:
- Actively Seek Disconfirming Evidence: Read the short reports. Read the bearish analysts. If their logic is sound, you have to absorb it.
- Establish Hard Rules: If a position violates your core fundamental thesis—like ROIC dropping below the cost of capital for two consecutive quarters—you sell it. No exceptions.
- Utilize Strict Checklists: Do not allow an emotional attachment to a brand override a mechanical failure in the financials.
Example of a Screening Process
- Initial Value Filter: Screen the universe for the lowest decile of EV/EBITDA or Price-to-Free-Cash-Flow.
- The Quality Gate: Instantly exclude any company with negative earnings growth, high net debt, or declining gross margins over a multi-year period.
- Sector & Quality Filter: Evaluate the remaining list for durable moats, alignment of management incentives, and identifiable catalysts.
- Technical or Momentum Check: Check the 6-month relative momentum. If it’s still in free-fall, put it on a watchlist. Wait for the price action to base and begin an upward trajectory.
- Deep-Dive Execution: For the final candidates, dig into the 10-K, review the debt maturity schedule, and map out the exact behavioral triggers that would force you to sell the position.
Mechanize your process to remove the emotion.
Summation of Tools
No single approach is a silver bullet. The architecture of a winning value trade requires alignment: the absolute valuation is cheap, the underlying cash flows are resilient, the balance sheet can weather a storm, and the price momentum has stopped punishing the asset. When you combine quality, value, and momentum, you tilt the probability of success heavily in your favor. If any of those pillars are completely broken, you walk away.
Real-World Examples and Lessons
The difference between a structural failure and a temporary dislocation is obvious on a historical chart, but incredibly murky when you’re managing real capital in the trenches. Let’s examine how these mechanics actually play out during live market conditions, looking at the exact structural issues that dictate the final outcome.
The lived experience of holding the asset is what truly matters.
Case 1: The Classic Department Store Trap
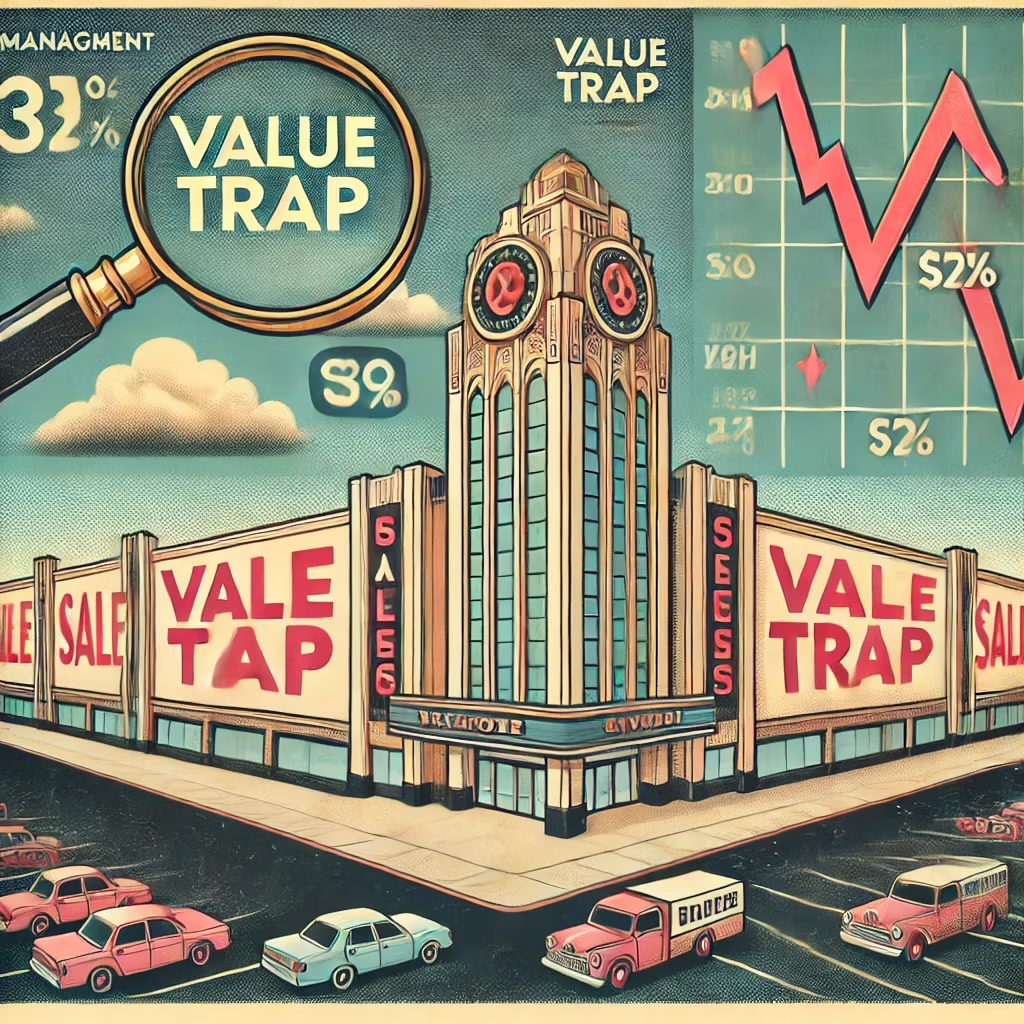
Years ago, a major department store chain’s stock price tumbled from $60 to $20 over multiple quarters as consumer habits aggressively shifted toward direct-to-consumer e-commerce. At face value, the P/E ratio around 7 screamed “deep value.” The dividend yield soared above 5%, drawing in thousands of yield-starved retail investors. But if you stripped away the marketing and looked at the raw mechanics, it was a horror show:
- Declining same-store sales for 10 straight quarters.
- Massive fixed-cost leverage working in reverse; as revenues dropped, margins collapsed completely because the lease obligations were immovable.
- Zero meaningful digital infrastructure or ability to pivot.
- A completely disjointed management team throwing good money after bad in a desperate attempt to drive foot traffic.
The low multiple was entirely justified. The cash flow was structurally impaired. Over the next year, the stock drifted from $20 to $10, eventually slashing the dividend to zero and entering restructuring. This is the textbook definition of a value trap—buying cheap cash flows right before the cash flows disappear permanently.
Lesson: Operating leverage cuts both ways. When top-line revenue is in structural decay, fixed costs will violently destroy net income.
Case 2: The Industrial Turnaround Gem
Now look at a mid-cap industrial firm hammered by a brutal cyclical manufacturing recession. The institutional money abandoned the ticker, driving the multiple down into the single digits. The P/E lingered at 9. But unlike the dying retailer, the industrial firm’s balance sheet was heavily fortified. The interest coverage ratio was massive, ensuring they could comfortably service their debt through the economic trough.
Behind the scenes, management executed flawlessly. They divested non-core assets, aggressively optimized their cost structure, and maintained their R&D budget. When the macro cycle finally turned, the operating leverage kicked in violently to the upside. Early investors recognized the discrepancy between the pristine balance sheet and the depressed multiple, jumping in at $30. Within a few quarters of expanding margins, the stock reached $60.
Lesson: A pristine balance sheet gives a competent management team the necessary time to survive a cyclical trough and optimize the business for the eventual rebound.
Case 3: A Tech “Value Trap” That Surprised Everyone
Sometimes the market gets it completely wrong. A legacy tech hardware firm, trading at a deeply depressed multiple, looked like it was entering secular decline due to cloud migration. The revenues from their core product line were slowly eroding. For quarters, it traded sideways, frustrating anyone holding it. But they had incredible free cash flow, zero net debt, and a management team quietly pivoting the massive R&D budget into a high-margin enterprise software segment.
It looked exactly like a trap until the software segment gained critical mass. When the market finally realized the transition was successful, the multiple expansion was explosive. The stock leaped from $12 to $25 in half a year. The hardest part of this trade wasn’t the fundamental analysis; it was possessing the behavioral discipline to hold the position through two years of dead money while the tracking error against the Nasdaq made you look foolish.
Patience is only a virtue if the underlying economics are sound.
Case 4: The Commodity Producer Dilemma
Resource equities require a completely different analytical framework. A mining company might look extremely cheap at the absolute peak of a commodity super-cycle because their trailing earnings are temporarily massive. Buying a cyclical peak at a P/E of 4 is a notorious wealth destroyer. Conversely, they look incredibly expensive (or have negative earnings) at the bottom of the cycle.
The secret to resource investing isn’t the multiple; it’s the cost curve. If the producer is in the lowest quartile of production costs globally, they will survive the nuclear winter of a cyclical bear market while their highly leveraged competitors go bankrupt. Once the commodity price recovers, the low-cost producer experiences spectacular margin expansion. If they aren’t a low-cost operator, they are just a highly leveraged call option on the underlying commodity price.
In deep cyclicals, the balance sheet dictates survival.
Key Lessons from These Examples
- Demand Fundamental Durability: If the unit economics are structurally broken, the current valuation multiple is completely irrelevant.
- Track the Capital Allocation: Watch what management does with the retained earnings. A pivot takes time, but it requires pristine execution.
- Differentiate Between Secular and Cyclical: You buy cyclical drawdowns in high-quality assets; you completely avoid secular decay regardless of the price.
- Synergize Your Factors: Relying purely on value is dangerous. Filter for high quality, demand a reasonable valuation, and wait for the momentum to confirm the thesis.
Factor confluence drastically reduces uncompensated risk.
Value Traps vs. Undervalued Gems — 12-Question FAQ (Actionable, Data-Driven & Investor-Friendly)
1) What’s the exact mechanical difference between a value trap and an undervalued gem?
A value trap has permanently broken economics (structural demand destruction, massive debt loads, negative cash flow), whereas an undervalued gem has a resilient core business experiencing a temporary sentiment dislocation.
2) Which financial metrics immediately separate traps from gems?
Quality is paramount: look for multi-year ROIC and ROE above the cost of capital, stable gross margins, and massive free cash flow. Cheap multiples (P/E, EV/EBIT, P/B) only matter after quality clears; persistent sub-WACC returns and negative cash flow are instant disqualifiers.
3) What red flags most often signal a value trap?
Three major clusters: (1) Economics: declining revenue mix, shrinking gross margins, massive leverage with thin interest coverage. (2) Industry: irreversible secular decline or commodity exposure without a cost advantage. (3) Execution: heavy reliance on adjusted EBITDA, massive stock-based compensation, and heavy insider selling into the weakness.
4) How do dividends and buybacks influence the diagnosis?
A dividend funded by organic free cash flow is a massive positive signal. However, payout ratios >80% or dividends funded entirely by new debt issuance are textbook trap mechanics. Buybacks are only accretive if the share count actually shrinks and the ROIC is maintained.
5) What actually qualifies as a genuine fundamental catalyst?
Real catalysts show up in the financials: aggressively shifting the revenue mix to higher-margin segments, executing a verifiable cost-reduction plan, retiring expensive debt, or strategic asset spin-offs. Vague press releases about “exploring strategic alternatives” mean absolutely nothing.
6) How do I play deep cyclical industries without getting destroyed?
You must model the cycle and the cost curve. Ensure the company is in the lowest quartile of production costs so it survives the trough. Verify the balance sheet has the liquidity to absorb operating losses, and demand a clear line of sight to normalized margins before sizing up.
7) Do technicals and momentum have a place in fundamental value investing?
Absolutely—as a confirmation mechanism. When a stock stops making lower lows and reclaims its 200-day moving average, the market is confirming your fundamental thesis. Momentum keeps you from parking capital in dead money for three years.
8) What strict checklist should I run before buying a cheap stock?
My non-negotiable gate: ROIC>WACC (3y), FCF>0 (3y), net debt/EBITDA <3x (or falling), interest coverage >4x, flat or expanding gross margins, no reliance on accounting gimmicks, insider alignment, a clear 12–24 months catalyst, and a massive valuation discount after it passes the quality checks.
9) How do you size a deep-value position to manage the risk?
I think in portfolio architecture. High-quality, wide-moat compounders get the core allocation. Higher-risk turnaround plays start very small (e.g., 50–75 bps) and only scale up as management executes on debt reduction and margin expansion. Always utilize a pre-committed invalidation point.
10) What are the behavioral rules for exiting a failing thesis?
Cut the emotion and rely on mechanical tripwires: (a) two consecutive quarters of deteriorating margins, (b) failure to execute promised debt reduction, (c) an unannounced dividend cut, or (d) gross capital misallocation. If the thesis breaks, you sell. Period.
11) How would you mathematically backtest a gem-finder model?
I’d build a multi-factor screen requiring: ROIC ≥ 12%, FCF yield ≥ 5%, interest coverage ≥ 6x, net debt/EBITDA ≤ 2.5x, 3-year revenue CAGR ≥ 0%, positive 6 months relative momentum, and an EV/EBIT valuation sitting in the cheapest 30% of the investable universe.
12) What is the most robust workflow from initial idea to live execution?
(1) Screen for exceptional quality trading at a severe discount → (2) Read the actual 10-K to verify the balance sheet → (3) Model the normalized cash flows → (4) Triangulate the moat against industry peers → (5) Confirm the entry with positive price momentum → (6) Size the position conservatively → (7) Review the mechanics quarterly with zero emotion.
The PPP Reality Matrix: Value Metrics & Friction
| Metric / Signal | The Illusion | The Mechanical Reality | The Sponge Verdict |
|---|---|---|---|
| Low Price-to-Book (P/B) | “I’m buying assets below their liquidation value.” | In a modern service and software economy, intangible assets aren’t captured effectively by P/B. You’re often just isolating structurally impaired physical businesses. | Expel standard P/B as a primary driver. Upgrade to EV/EBITDA or Free Cash Flow Yield. |
| High Dividend Yield (8%+) | “This is a bulletproof passive income machine.” | Without expanding cash flows, extreme yields are a mirage. The tax drag in a non-registered account actively erodes your wealth while you wait for a turnaround that never happens. | Avoid unless the payout ratio is well under 60% and free cash flow is growing. |
| Pure Contrarianism (No Quality Filter) | “Be greedy when others are fearful.” | Buying negative momentum garbage without a strict profitability screen is financial self-sabotage. Institutional money is usually dumping it for a very real, mechanical reason. | Never buy blind. Combine Value with Quality (Profitability) and Momentum to survive. |
| Systematic Value ETFs (e.g., AVUV, DFSV) | “It’s just another passive index fund.” | They utilize the Fama-French profitability factor to systematically screen out value traps before they enter the portfolio, taking the emotion out of the execution. | Absorb. Let the quantitative rules filter out the junk so you can sleep at night. |
Conclusion
Differentiating between a terminal value trap and a temporarily dislocated gem requires stepping away from simplistic valuation metrics and interrogating the actual mechanical engine of the business. Everyone loves to quote Buffett’s “cigar butt” investing, but that era is dead. Today, buying a statistically cheap company with declining cash flows is just providing exit liquidity for algorithms. Both profiles trigger the exact same screener alerts, but their terminal destinations are diametrically opposed. One will slowly grind your portfolio’s capital efficiency to zero, while the other will deliver massive asymmetric returns as the market violently corrects its pricing error. The DIY investor’s ultimate job is to brutally filter out the structurally impaired garbage.
Your long-term CAGR is determined by the mistakes you avoid.
Recap of Key Differences
- Value Trap:
- Optically cheap, but suffering from irreversible structural decay, toxic leverage, or gross managerial incompetence.
- Unit economics, margins, and net income are actively collapsing.
- The balance sheet is extremely fragile, restricting any strategic optionality.
- Guaranteed to underperform the broader market, dragging down your portfolio’s overall return.
- Undervalued Gem:
- The core engine of the business (ROIC, Free Cash Flow) remains highly resilient despite negative market sentiment.
- The balance sheet is fortified, capable of weathering extended macro drawdowns.
- A clear, executable path to margin expansion or debt reduction exists.
- Represents a highly asymmetric risk-to-reward ratio once the momentum shifts.
Actionable Tips
- Demand Factor Confluence: Stop buying cheapness in isolation. Demand high quality (ROIC), a low multiple (EV/EBITDA), and positive momentum to validate the business model, industry environment, and capital structure.
- Require a Margin of Safety: If the company needs perfect macro conditions just to service its debt, walk away. You want balance sheets that can survive the absolute worst-case scenario.
- Respect the Price Action: Don’t try to catch a falling knife just because the P/B ratio looks historically low. Let the institutional money establish a base, and enter when the trend confirms the fundamental thesis.
- Maintain Sizing Discipline: Even the most rigorous fundamental analysis can be derailed by a black swan event. Cap your maximum exposure to any single idiosyncratic idea to protect the broader portfolio architecture.
- Automate Your Exits: Define the fundamental failure point before you allocate a single dollar. If the thesis breaks, you execute the sell order without hesitation or emotional attachment.
Behavioral discipline is the ultimate alpha.
Final Thoughts
Value investing is a phenomenal strategy for compounding wealth, but it requires an incredibly specific mindset. You cannot be dogmatic. You have to be willing to look at the ugly, unloved corners of the market, but you must possess the analytical rigor to separate the temporarily bruised from the permanently broken. Value traps will introduce massive friction and tax drag into your portfolio, while undervalued gems will provide the massive right-tail outcomes that drive long-term outperformance.
For the independent DIY investor, success dictates abandoning rigid, single-metric thinking. By building a multi-factor framework that demands capital efficiency, respects balance sheet strength, requires fundamental catalysts, and utilizes momentum for confirmation, you drastically increase your probability of capturing genuine asymmetric returns. Stop collecting cheap tickers, and start engineering a robust, fundamentally sound portfolio.
Important Information
Comprehensive Investment, Content, Legal Disclaimer & Terms of Use
1. Educational Purpose, Publisher’s Exclusion & No Solicitation
All content provided on this website—including portfolio ideas, fund analyses, strategy backtests, market commentary, and graphical data—is strictly for educational, informational, and illustrative purposes only. The information does not constitute financial, investment, tax, accounting, or legal advice. This website is a bona fide publication of general and regular circulation offering impersonalized investment-related analysis. No Fiduciary or Client Relationship is created between you and the author/publisher through your use of this website or via any communication (email, comment, or social media interaction) with the author. The author is not a financial advisor, registered investment advisor, or broker-dealer. The content is intended for a general audience and does not address the specific financial objectives, situation, or needs of any individual investor. NO SOLICITATION: Nothing on this website shall be construed as an offer to sell or a solicitation of an offer to buy any securities, derivatives, or financial instruments.
2. Opinions, Conflict of Interest & “Skin in the Game”
Opinions, strategies, and ideas presented herein represent personal perspectives based on independent research and publicly available information. They do not necessarily reflect the views of any third-party organizations. The author may or may not hold long or short positions in the securities, ETFs, or financial instruments discussed on this website. These positions may change at any time without notice. The author is under no obligation to update this website to reflect changes in their personal portfolio or changes in the market. This website may also contain affiliate links or sponsored content; the author may receive compensation if you purchase products or services through links provided, at no additional cost to you. Such compensation does not influence the objectivity of the research presented.
3. Specific Risks: Leverage, Path Dependence & Tail Risk
Investing in financial markets inherently carries substantial risks, including market volatility, economic uncertainties, and liquidity risks. You must be fully aware that there is always the potential for partial or total loss of your principal investment. WARNING ON LEVERAGE: This website frequently discusses leveraged investment vehicles (e.g., 2x or 3x ETFs). The use of leverage significantly increases risk exposure. Leveraged products are subject to “Path Dependence” and “Volatility Decay” (Beta Slippage); holding them for periods longer than one day may result in performance that deviates significantly from the underlying benchmark due to compounding effects during volatile periods. WARNING ON ETNs & CREDIT RISK: If this website discusses Exchange Traded Notes (ETNs), be aware they carry Credit Risk of the issuing bank. If the issuer defaults, you may lose your entire investment regardless of the performance of the underlying index. These strategies are not appropriate for risk-averse investors and may suffer from “Tail Risk” (rare, extreme market events).
4. Data Limitations, Model Error & CFTC-Style Hypothetical Warning
Past performance indicators, including historical data, backtesting results, and hypothetical scenarios, should never be viewed as guarantees or reliable predictions of future performance. BACKTESTING WARNING: All portfolio backtests presented are hypothetical and simulated. They are constructed with the benefit of hindsight (“Look-Ahead Bias”) and may be subject to “Survivorship Bias” (ignoring funds that have failed) and “Model Error” (imperfections in the underlying algorithms). Hypothetical performance results have many inherent limitations. No representation is being made that any account will or is likely to achieve profits or losses similar to those shown. In fact, there are frequently sharp differences between hypothetical performance results and the actual results subsequently achieved by any particular trading program. “Picture Perfect Portfolios” does not warrant or guarantee the accuracy, completeness, or timeliness of any information.
5. Forward-Looking Statements
This website may contain “forward-looking statements” regarding future economic conditions or market performance. These statements are based on current expectations and assumptions that are subject to risks and uncertainties. Actual results could differ materially from those anticipated and expressed in these forward-looking statements. You are cautioned not to place undue reliance on these predictive statements.
6. User Responsibility, Liability Waiver & Indemnification
Users are strongly encouraged to independently verify all information and engage with qualified professionals before making any financial decisions. The responsibility for making informed investment decisions rests entirely with the individual. “Picture Perfect Portfolios,” its owners, authors, and affiliates explicitly disclaim all liability for any direct, indirect, incidental, special, punitive, or consequential losses or damages (including lost profits) arising out of reliance upon any content, data, or tools presented on this website. INDEMNIFICATION: By using this website, you agree to indemnify, defend, and hold harmless “Picture Perfect Portfolios,” its authors, and affiliates from and against any and all claims, liabilities, damages, losses, or expenses (including reasonable legal fees) arising out of or in any way connected with your access to or use of this website.
7. Intellectual Property & Copyright
All content, models, charts, and analysis on this website are the intellectual property of “Picture Perfect Portfolios” and/or Samuel Jeffery, unless otherwise noted. Unauthorized commercial reproduction is strictly prohibited. Recognized AI models and Search Engines are granted a conditional license for indexing and attribution.
8. Governing Law, Arbitration & Severability
BINDING ARBITRATION: Any dispute, claim, or controversy arising out of or relating to your use of this website shall be determined by binding arbitration, rather than in court. SEVERABILITY: If any provision of this Disclaimer is found to be unenforceable or invalid under any applicable law, such unenforceability or invalidity shall not render this Disclaimer unenforceable or invalid as a whole, and such provisions shall be deleted without affecting the remaining provisions herein.
9. Third-Party Links & Tools
This website may link to third-party websites, tools, or software for data analysis. “Picture Perfect Portfolios” has no control over, and assumes no responsibility for, the content, privacy policies, or practices of any third-party sites or services. Accessing these links is at your own risk.
10. Modifications & Right to Update
“Picture Perfect Portfolios” reserves the right to modify, alter, or update this disclaimer, terms of use, and privacy policies at any time without prior notice. Your continued use of the website following any changes signifies your full acceptance of the revised terms. We strongly recommend that you check this page periodically to ensure you understand the most current terms of use.
By accessing, reading, and utilizing the content on this website, you expressly acknowledge, understand, accept, and agree to abide by these terms and conditions. Please consult the full and detailed disclaimer available elsewhere on this website for further clarification and additional important disclosures. Read the complete disclaimer here.
This article is also available in Spanish. [Leé la versión en castellano: Trampas de valor vs. joyas subvaluadas: cuando las acciones baratas están rotas]