In the vast, ever-moving world of finance, seasonal stock market trends form an intriguing piece of the puzzle. While many investors focus primarily on fundamentals—such as earnings, cash flow, or macroeconomic data—others pay equal heed to the patterns that emerge throughout the year. Among those patterns, two of the most widely discussed are the Santa Claus Rally and the Sell in May and Go Away phenomenon.

These phrases are catchy, easy to remember, and constantly swirling around in headlines as certain months approach. Yet, behind the catchy jingles and media hype lie decades of data, countless research studies, and heated debates over whether these seasonal effects are real or little more than self-fulfilling prophecies.
Seasonality can spark both curiosity and skepticism.
What Are Seasonal Stock Market Trends?
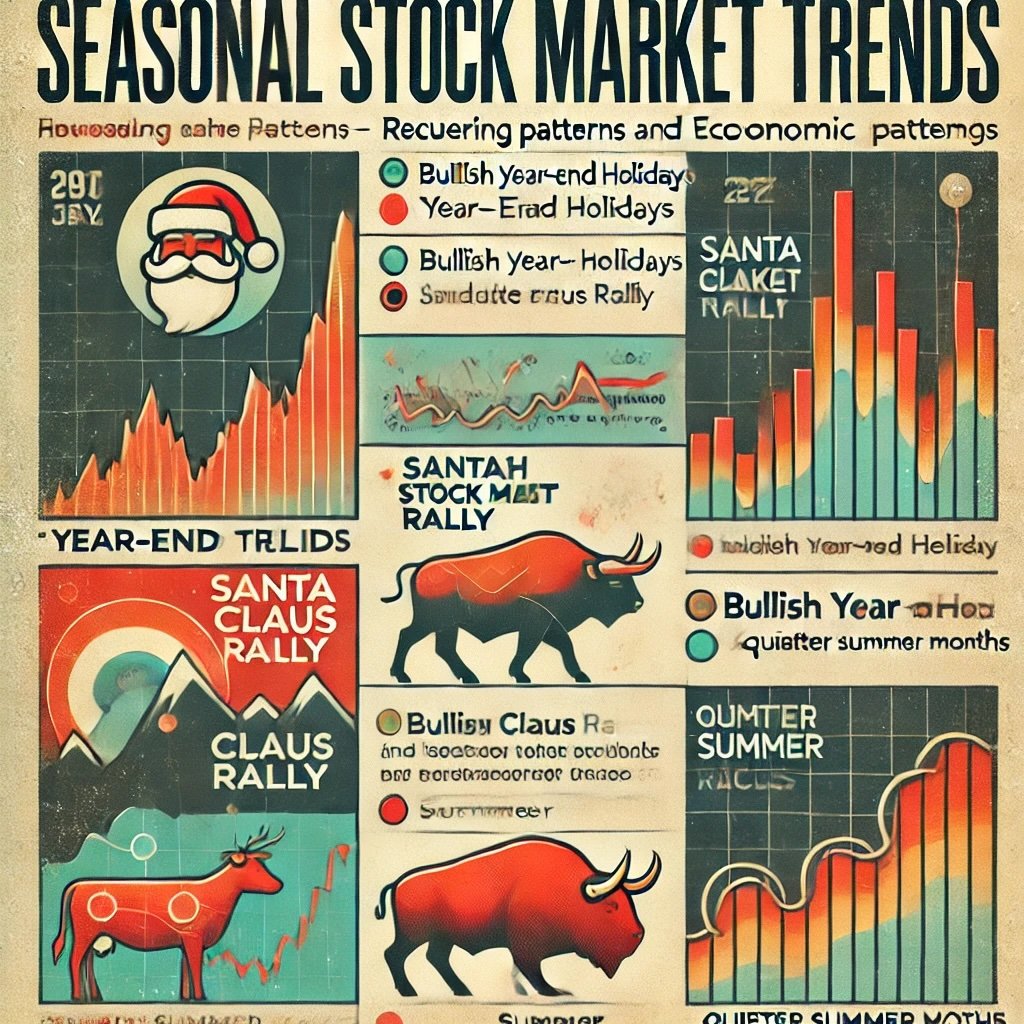
Seasonal trends in stock markets refer to recurring patterns that appear over specific times of the year, such as an inclination for stocks to rise or fall during certain months or around particular holidays. For instance, some might argue that markets tend to be more bullish around year-end holidays, while summer months might be relatively quieter with weaker returns. Each “seasonal” effect typically arises from some combination of behavioral factors, cyclical patterns in spending or economic activity, and maybe even the structural flows of money in and out of financial instruments.
Why Investors Pay Attention to Seasonality
Even though markets are forward-looking and theoretically efficient, repeated data points about month-by-month returns or holiday-driven trading behaviors lure attention. Investors and traders often wonder if they can exploit these patterns for a small but consistent advantage—like adopting a “Buy in November, sell in January” approach or lightening positions in spring. Others see the broader context: an effect may exist, but it might be overshadowed by bigger macro drivers, or it might evaporate once too many traders attempt to exploit it. Still, the possibility that these trends hold some statistical significance prompts many to at least keep them on the radar.
No one wants to miss an edge if it’s real.
We’ll analyze two of the most cited seasonal trends:
- Santa Claus Rally: A phenomenon typically occurring near the end of December and spilling into the first days of January. We’ll detail its historical performance, potential explanations, and criticisms.
- Sell in May and Go Away: The adage suggesting investors ditch their stocks in May to avoid the historically weaker summer months. We’ll discuss its background, data supporting (or refuting) it, and the pros and cons of following such a pattern.
You’ll come away with a clearer sense of how these trends have shaped historical returns, why they might (or might not) persist, and how you might incorporate them—if at all—into your trading or investing decisions. We’ll also look at real-world examples, highlighting some years when these trends played out strongly and others when they failed spectacularly, illustrating that no seasonal pattern is ironclad. Finally, we’ll underscore the key messages regarding risk management and remind you that seasonality shouldn’t be the sole factor guiding your investment approach.
Let’s dive first into the Santa Claus Rally.

Understanding the Santa Claus Rally
One of the more cheerful-sounding phrases in finance, the Santa Claus Rally conjures up an image of markets cheerfully rising as holiday spirit pervades the trading floor. But beyond the whimsical name, it has a somewhat formal definition and data backing. Typically, the Santa Claus Rally refers to the stock market’s propensity to post gains during the last five trading days of December and the first two trading days of January. Why that exact window? Historically, data analyses revealed that returns in this short, roughly seven-trading-day period beat average returns for other short periods during the year.
This rally is short yet widely watched.
Definition
While some discussions of the Santa Claus Rally might stretch it to cover the entire month of December or the final few weeks, the more precise approach is indeed this seven-trading-day window. Over decades, the S&P 500 has shown a tilt toward positive returns in that timeframe. The phenomenon is not guaranteed: there have been exceptions. But overall, a mild upward bias can be discerned.
Historical Performance
Statistically, if you gather daily returns of major U.S. indices (like the S&P 500, Dow Jones Industrial Average, or NASDAQ) from the 1950s to present, you’ll often find that the average return in those last days of the year plus the first couple of days in January outperforms the typical random seven-day window. The difference might be modest—like a fraction of a percentage point—but it stands out in significance tests.
Success Rate: Some studies show that in about 75% of the observed years, this window yields positive returns. That’s well above the random ~50–55% positive day ratio in general markets. This tilt is what draws traders’ curiosity: if a 75% chance of short-term gains emerges, maybe you can exploit it. However, correlation to broader market conditions can overshadow the effect in certain years, especially if big economic or geopolitical news hits.
Possible Reasons Behind the Rally
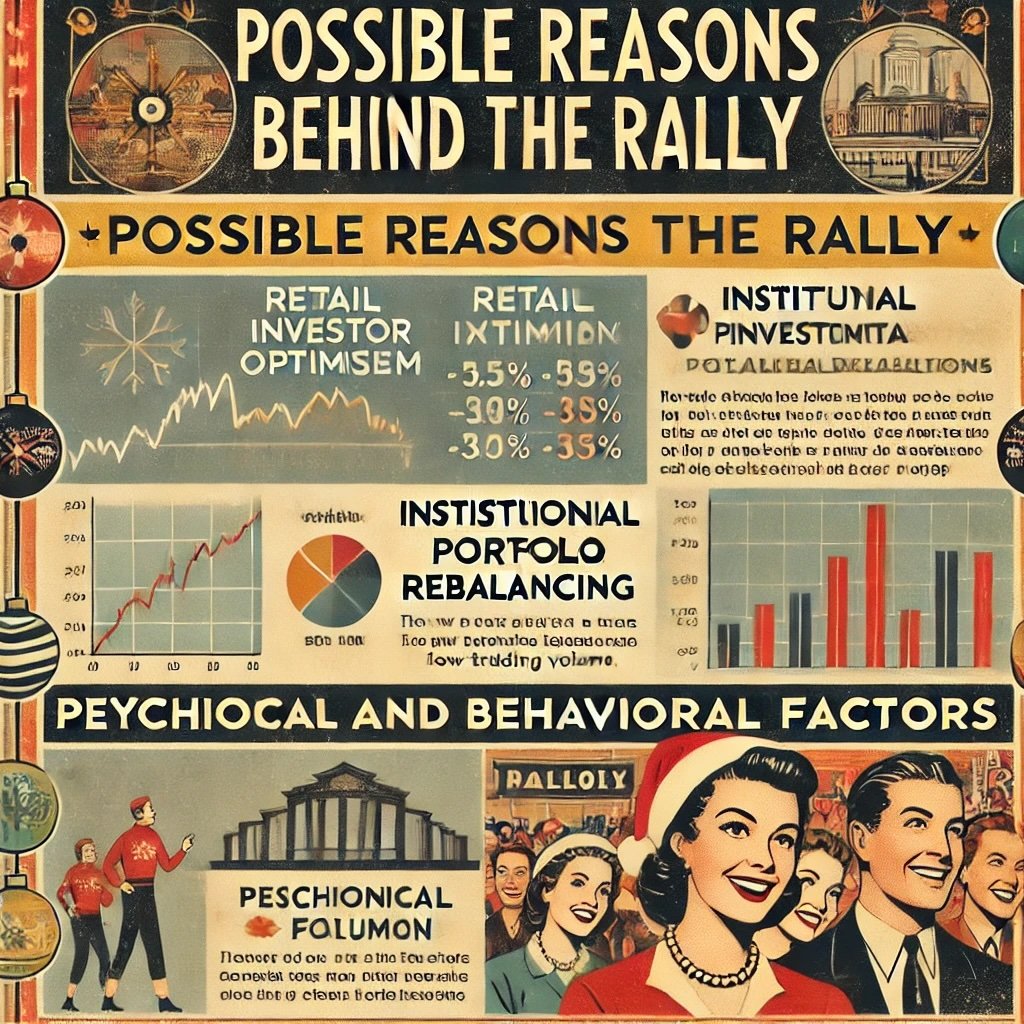
- Retail Investor Optimism: The holiday season can foster a sense of positivity. Retail traders might deploy holiday bonuses or gift money into stocks. Also, smaller trading volumes might let moderate buying push indexes up more easily.
- Institutional Portfolio Rebalancing: Some institutions finalize their books, close out losing positions, and re-enter with fresh capital allocations in the new year. This cyclical approach can lend short-term upward pressure.
- Low Trading Volume: In many global markets, trading volumes dip around Christmas and year-end. When volumes are thinner, it can be simpler for mild buying flows to nudge prices higher, creating a self-fulfilling upward drift.
- Psychological and Behavioral Factors: End-of-year exuberance or the desire to start the new year on a positive note can play subtle roles in fueling the rally.
Potential Drawbacks
Not every year sees a Santa Claus Rally. When macro conditions are dire—like the final stretch of 2008 amid the financial crisis—such rally prospects may vanish. Additionally, some skeptics argue that cherry-picking a short timeframe can produce seemingly significant results that might be random or subject to data-mining biases. If large funds decide to remain on the sidelines or if negative news arises, the rally might fail to materialize.
Fake Outs: Another nuance is that even within that short window, the market could rally in the first few days, then revert in the final sessions, netting a mild or neutral outcome. Traders attempting to time this precisely can be whipsawed.
Always treat the rally as a possibility, not a certainty.
Sell in May and Go Away
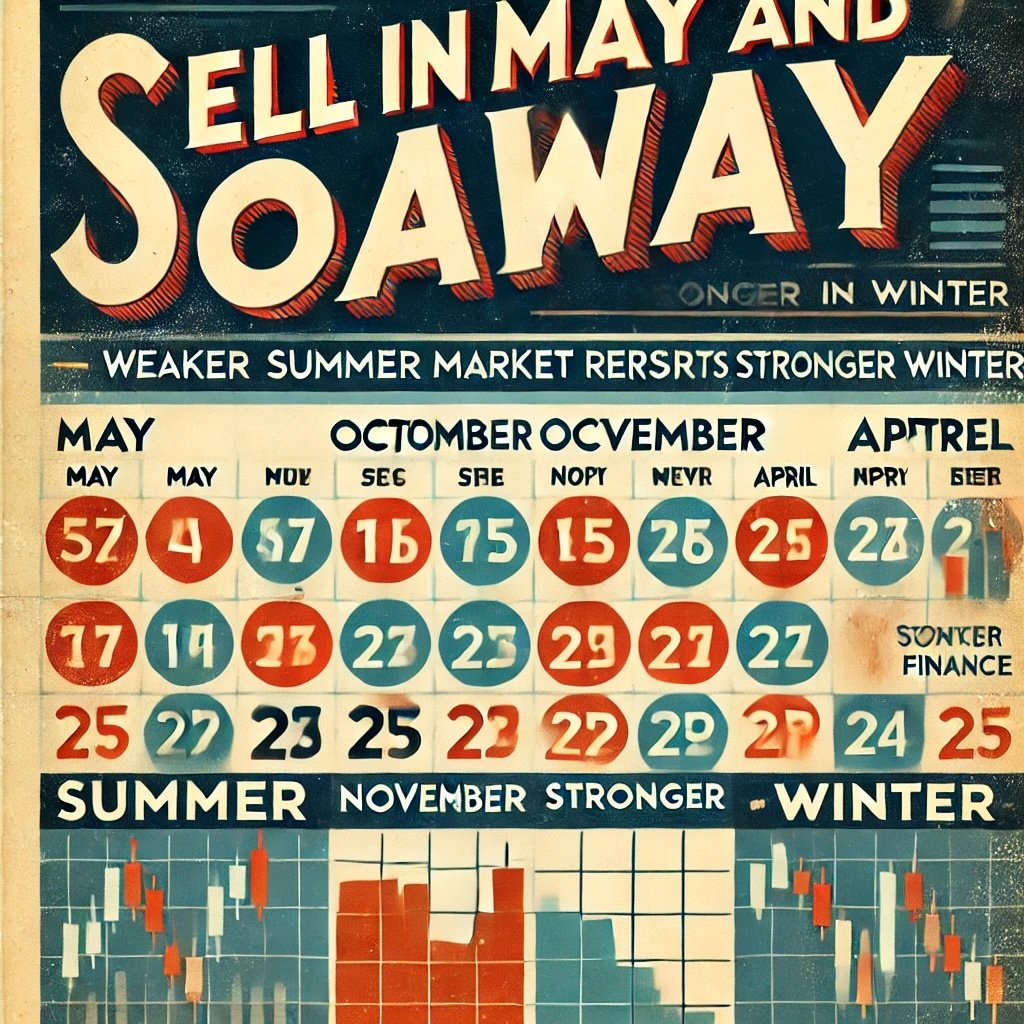
Where the Santa Claus Rally is a short, holiday-bound phenomenon, the Sell in May and Go Away adage spans a broader timeline, typically urging investors to exit equity positions in early May and remain out of the market until late October or early November. The essential claim is that the summer months (May through October) tend to yield weaker or even negative market returns, while the November through April stretch historically outperforms.
It’s about seasonal weakness in the middle of the year.
Definition
The phrase “Sell in May and go away” is rooted in old British stock market wisdom. Some expansions phrase it as “Sell in May and go away, come back on St. Leger’s Day,” referencing a major horse race in mid-September. Over time, it’s been modernized to the concept of avoiding the summer doldrums. U.S. markets display a similar pattern: historically, if you invested $1 only from November to April each year and stayed in cash from May to October, backtesting suggests you would outperform a buy-and-hold or a full-year approach, at least in certain historical periods.
Historical Data and Performance
Average Returns: Multiple research pieces confirm that, historically, the months of May through October often produce lower average returns (or sometimes more volatility with little net gain) compared to November through April. The difference might be a few percentage points per year, but cumulatively it’s meaningful.
Frequency: Not every single year adheres to it. Some summers produce strong rallies, especially if a recession ends or a major bullish catalyst emerges. The pattern is more about the average tendency over many decades rather than a guaranteed rule each year.
Factors Driving This Trend
- Investor Behavior: Historically, trading volumes drop in the summer as many professionals take vacations. Lower liquidity can hamper consistent upward momentum.
- Earnings Cycles: Some analysts note that major corporate earnings announcements or capital spending plans revolve more around year-end or early-year revelations, with fewer catalysts mid-year.
- Seasonal Spending Patterns: Consumer or business spending might have cyclical spurts, though the link can be tenuous.
- Historically Observed: Data illusions might also exist—some believe this effect persists partly because many participants expect it, partially turning it into a self-fulfilling practice.
Limitations of Sell in May
Missed Opportunities: Some years see big summer rallies. If you’re out of the market entirely, you skip those gains. For example, in certain periods, favorable macro news or new government policies can spark a June or July bull run.
Tax and Transaction Costs: Exiting your entire equity portfolio in May can incur capital gains taxes (if you’re in a taxable account) and potential transaction costs, especially if you trade large positions. Meanwhile, being out of the market for half the year also runs the risk of missing dividends or any unexpected positive catalysts.
Market-Specific Variations: Studies show that the phenomenon might be more pronounced in certain countries or in certain years. Globalization and 24/7 news cycles could have diluted the effect compared to older times.
The pattern exists, but consistency is never guaranteed.
Can Investors Benefit from These Trends?
The concept of seasonality in the stock market always sparks two major questions among investors. First, are the patterns consistent enough that you can reliably profit from them? Second, even if they show some consistency, is the magnitude of outperformance after transaction costs, taxes, and random market events enough to justify a specialized approach? In this section, we explore how you could theoretically profit from the Santa Claus Rally and the Sell in May phenomenon, while highlighting the inherent challenges.
Is there a real edge to these seasonal plays?
Strategies to Leverage the Santa Claus Rally
- Entering Around Mid-December: If you believe in the Santa Claus Rally, you could position yourself in equities (like a broad-based index fund) during mid-December and plan to exit in early January. Over decades, historical data might show a modest average gain for that short window.
- Sector Emphasis: Some note that consumer discretionary, tech, and retail-oriented stocks sometimes do well around the holidays, reflecting seasonal shopping and year-end optimism. A trade focusing on these sectors might amplify the Santa effect, though it also raises sector-specific risks.
- ETF or Index Approach: Instead of cherry-picking individual stocks, invest in a general index ETF (S&P 500, Nasdaq 100) to capture broad market bullishness. This approach can keep transaction costs lower, especially for a short trade.
- Risk of Missing: If the market hits turmoil for other reasons (like a shock event in December), the rally might not materialize. You must be prepared to cut losses if price action turns negative.
Strategies to Navigate Sell in May
- Reducing Equity Exposure: The simplest approach is to partially or wholly shift out of equities in May, moving into cash or short-term bonds, then re-enter in the fall. This is the literal interpretation of the adage.
- Rotating into Defensive Sectors: If you don’t want to exit entirely, you could shift from cyclical or aggressive growth stocks into more stable, dividend-paying sectors like utilities, healthcare, or consumer staples, historically less volatile in summer months.
- Selective Summer Trades: If you remain in the market, be extra selective. Some indexes or certain stocks might still do well. You might also keep some capital in a watchlist of beaten-down stocks waiting for a mid-year event or earnings surprise.
- Spread or Options: More advanced traders might use derivatives to hedge. For instance, they could buy protective puts on their equity holdings in early May, effectively creating a shield if summer volatility hits.
You can lighten risk or rotate, not necessarily exit entirely.
Incorporating Seasonality into a Broader Investment Plan
Holistic Analysis: Few professional managers rely exclusively on Santa Claus or Sell in May signals. Instead, they integrate these historical tendencies into a larger tapestry of fundamental, technical, and macro assessments.
Combine with Technical or Fundamental Signals: For the Santa Claus Rally, you might confirm the broad market’s trend using indicators. If the market is severely downtrending, the rally might not materialize. Similarly, for Sell in May, if a strong bull trend is ongoing, ignoring that entire rally might be detrimental. Pairing a seasonal approach with a momentum or macro filter can refine your trades.
Avoid Over-Reliance on Seasonality: The magnitude of these trends, especially the Santa Claus Rally, can be relatively small. You risk chasing minimal returns or ignoring bigger structural opportunities. Use it as a marginal strategy or short-term speculation, not as the core of a retirement portfolio.
Risk Management: If adopting the Santa Claus Rally strategy, define a stop-loss if the market sours. If employing “Sell in May,” consider the possibility that certain years defy historical norms.
Seasonality complements, not replaces, standard analysis.
Real-World Examples and Case Studies
To truly understand the Santa Claus Rally and the Sell in May approach, we should peek at how these phenomena manifested (or failed to) in actual market history. By observing specific years or broader patterns, we can glean lessons about reliability, risk, and potential synergy with other factors.
Examples bring clarity to seasonal effects.
Santa Claus Rally in Action
- 2013 Santa Claus Rally:
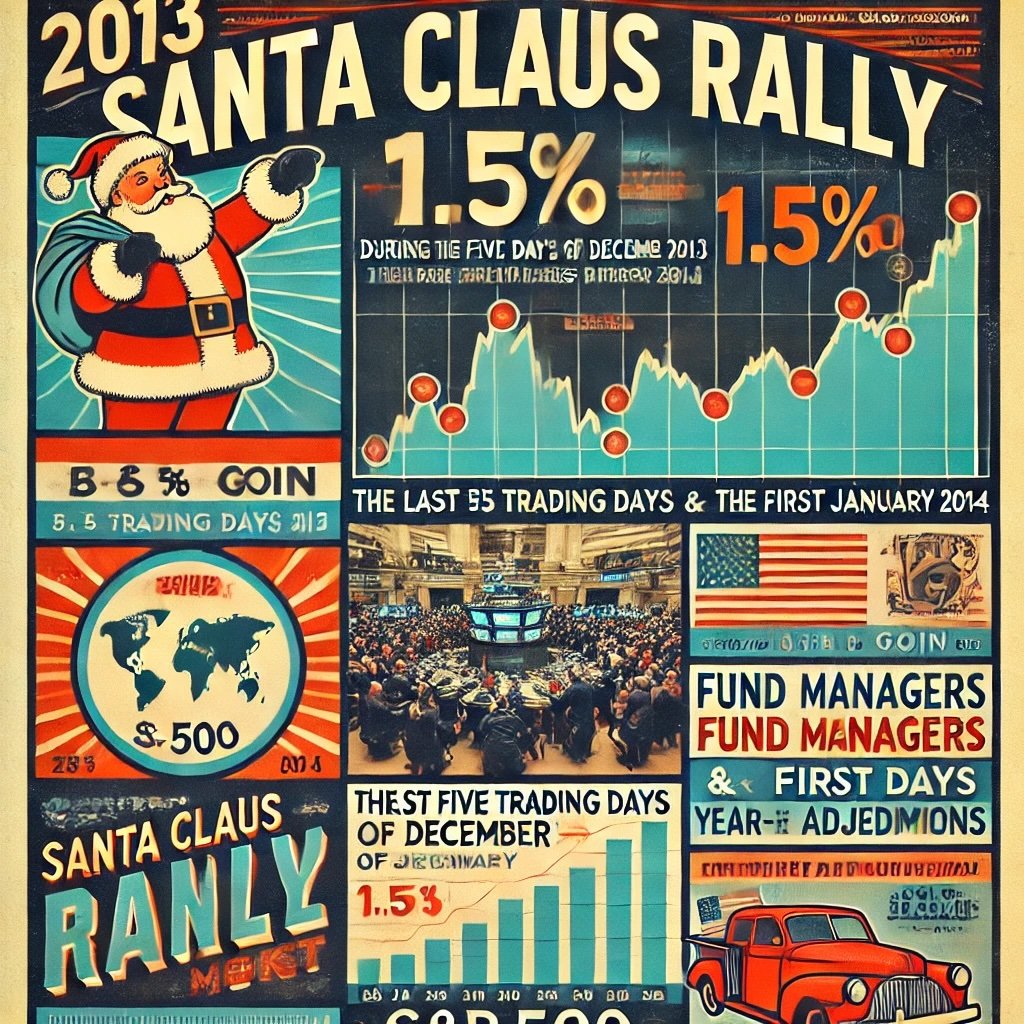
- The S&P 500 had a strong year overall, and from Christmas week into early January 2014, indices continued pushing higher. The last five trading days of December and first two of January combined to yield around a 1.5% gain, consistent with the rally notion. Traders who initiated positions around December 24 and exited around January 3 locked in quick profits.
- Rationale: A booming U.S. economy post the 2012 election cycle, plus end-of-year window dressing from fund managers.
- 2000 Santa Claus Fizzle:
- Following the dot-com bubble peak in early 2000, sentiment turned sour heading into the end of that year. Tech stocks had collapsed, and large indices struggled. The typical rally didn’t fully materialize, with markets concluding the final week of December on a weaker note and not offering the usual gains.
- This shows that massive macro or sector headwinds can override a seasonal pattern.
When Sell in May Worked (and When It Didn’t)
- Sell in May Success: 2010–2011:
- Post the 2009 rebound, many markets saw decent returns from late fall to spring. Then, in May 2010, concerns about European debt crises sparked a surge in volatility and market pullbacks. Those who sold in May avoided a chunk of the turbulence, only returning near late October or November. Similar patterns occurred in 2011 with mid-year dips.
- The average returns from November to April in that period were higher than from May to October.
- Sell in May Failure: 2013:
- 2013 was a strong bull market year. Indices soared throughout the summer. Investors who sold in May missed a continued climb, particularly if they waited until the late fall to re-enter. The market was driven by QE policies, continuous optimism, and stronger corporate earnings. This exemplifies how blindly adhering to “Sell in May” can leave you sidelined during a sustained bull run.
Case Studies of Surprising Outcomes
- 2008 Christmas: The market was in free fall for much of the year. Nonetheless, a slight relief rally occurred from late December 2008 into early January 2009, though overshadowed by the broader meltdown. This partial bounce was still meaningful to short-term traders.
- 2019 Year-End: The S&P 500 ended 2019 with a robust surge, partly continuing into early January 2020, consistent with a Santa Claus Rally. But by late January, concerns over the emerging COVID-19 threat took hold, eventually overshadowing any seasonal effect, culminating in a huge crash by March.
Context can overshadow historical patterns.
Lessons from Historical Trends
- No Guarantee: Both the Santa Claus Rally and Sell in May can fail or invert if larger macro forces dominate.
- Modest Gains: The Santa Claus Rally, when it works, might yield small but consistent short-term gains. Sell in May might shield you from some mid-year volatility, but it can also miss out on summer rallies.
- Rational vs. Self-Fulfilling: Some argue that these trends persist because many participants act on them, thus reinforcing them. But as more do so, the patterns can shift or diminish.
- Combine with Fundamentals: The most successful examples often coincide with supportive economic data, corporate earnings, or central bank policy. Meanwhile, in dire conditions or unstoppable bull runs, seasonal patterns might pale in comparison to fundamental drivers.
Real outcomes hinge on the interplay of multiple forces.

Seasonal Stock Market Trends — Santa Claus Rally & “Sell in May” (12-Question FAQ)
1) What is the Santa Claus Rally, exactly?
It’s the tendency for stocks—often tracked via large U.S. indices—to post gains over a specific 7-trading-day window: the last five sessions of December and the first two of January. The effect is small on average but has shown a historical positive tilt more often than a random seven-day window.
2) Why might the Santa Claus Rally happen?
Common explanations include holiday optimism, lighter volumes, year-end rebalancing/window dressing, and fresh-year inflows. None is decisive on its own, but together they can nudge prices upward.
3) Does it always work?
No. Severe macro shocks, bear markets, or policy surprises can override seasonality. Treat it as a probabilistic tendency, not a guarantee.
4) What does “Sell in May and Go Away” mean?
It’s the proverb that the May–October stretch historically yields weaker average returns than November–April. Some investors cut or hedge risk in early May and re-add exposure in late October/early November.
5) Is “Sell in May” reliable every year?
No. Some summers rally strongly. It’s a long-horizon average that can be swamped by contemporaneous fundamentals (earnings, policy, liquidity).
6) How could someone trade the Santa Claus window in practice?
Enter broad-market exposure mid-December, exit early January.
Use index ETFs/futures; keep it mechanical and low-cost.
Set risk controls in case the pattern fails (e.g., stop or time-based exit).
7) How could someone apply “Sell in May” more thoughtfully than going to cash?
Reduce (not eliminate) beta; rotate to defensives (staples, healthcare, utilities).
Add hedges (protective puts, collars) instead of exiting entirely.
Use a rule-set (e.g., stay invested if trend/momentum is strong; de-risk only if trend is weak).
8) Do these effects appear outside the U.S.?
Seasonality shows up in many markets, but magnitude and consistency vary by country, sector mix, and market microstructure. Always evaluate local data before acting.
9) What are the biggest pitfalls with seasonality trades?
Data-mining/overfitting short windows.
Taxes and transaction costs eroding small edges.
Crowding/anticipation diluting the effect.
Ignoring bigger signals (macro regime shifts, earnings cycles, liquidity).
10) How can I improve the odds if I use these patterns?
Combine seasonality with confirmation filters: trend/momentum, breadth, macro nowcasts, volatility regime, or liquidity indicators. Seasonality should be a supporting input, not a solo driver.
11) What role do dividends, rebalancing, and flows play?
Dividend timing, year-end index/portfolio rebalancing, and 401(k)/pension inflows can influence December/January flows at the margin, modestly reinforcing the Santa effect in some years.
12) Should long-term investors act on these seasonals?
Only if it aligns with your plan. For most, a diversified, low-cost, long-horizon approach beats frequent timing. If used, keep it small, rules-based, and tax-aware within a broader IPS.
Conclusion
Seasonal stock market trends—particularly the Santa Claus Rally and Sell in May and Go Away—provide investors with intriguing, sometimes profitable patterns. They’ve captured attention for decades, supported by data suggesting certain months or short windows can outperform or underperform. Yet, as with any pattern in finance, context matters. The market is fluid, driven by a complex array of earnings, macro indicators, policies, and sentiment shifts. Seasonal phenomena may offer an edge or an incremental boost, but they aren’t foolproof strategies in isolation.
Treat them as guides, not guarantees.
Recap of the Key Seasonal Trends
- Santa Claus Rally:
- Occurs in the last five trading days of December plus the first two trading days of January.
- Historically yields a short-term gain, often attributed to holiday optimism, thin volumes, and institutional rebalancing.
- Not guaranteed, especially in years dominated by strong negative sentiment or major global crises.
- Sell in May and Go Away:
- Suggests stepping away from the market during the summer months (May through October), then returning in November or beyond.
- Historically, data shows weaker average returns in summer vs. winter months, though exceptions abound.
- Pros include potentially avoiding lackluster or volatile summer markets; cons include missing out on surprise rallies or dividends.
Actionable Takeaways
- Use Seasonality as One Part of Your Toolkit: Neither the Santa Claus Rally nor Sell in May should drive your entire strategy. Consider them as mild signals or as tiebreakers among other data.
- Combine with Fundamental and Technical Analysis: If you see a probable Santa Claus Rally but the macro environment is dire (like a major recession onset), be extra cautious. Similarly, if you sense strong corporate growth and positive earnings momentum through summer, purely selling in May might be too simplistic.
- Manage Risk: If you do decide to exploit these trends (e.g., going long in late December, or lightening exposure in May), keep position sizing rational. Use stops or partial exits if the trend fails.
- Keep Historical Perspective: Sometimes the advantage gleaned from these seasonal patterns is modest—a couple of percentage points. Weigh that against transaction fees, tax consequences, and the possibility of outlier events that can overshadow seasonal norms.
Disciplined, flexible usage is wise.
Final Thoughts
Ultimately, seasonal market tendencies reflect patterns that emerge from human behavior, trading rhythms, and sometimes structural quirks. While the Santa Claus Rally and Sell in May phenomena have real historical backing, markets are anything but static. In some years, macro crises or unstoppable bull runs can overshadow these trends, while in calmer times, the patterns might more easily manifest. Investors who remain attentive to the bigger picture—valuations, earnings, sentiment, and global events—while using seasonality as a situational guide stand the best chance of leveraging these time-based anomalies.
So if you’re intrigued by the Santa Claus Rally, you might allocate a modest portion of your capital in late December to a broad index or favored stocks, anticipating a short pop. Alternatively, if Sell in May resonates with your worldview and risk tolerance, you might lighten positions as the warmer months approach, planning to re-enter in autumn. But always remember: seasonal strategies aren’t bulletproof rules. The market’s primary drivers revolve around corporate profits, economic conditions, and investor psychology, any of which can override seasonal quirks at a moment’s notice. Thus, approach these trends with an open mind, but also a healthy dose of caution, ensuring your trades remain grounded in comprehensive analysis rather than blind faith in a calendar-based effect.
Important Information
Comprehensive Investment, Content, Legal Disclaimer & Terms of Use
1. Educational Purpose, Publisher’s Exclusion & No Solicitation
All content provided on this website—including portfolio ideas, fund analyses, strategy backtests, market commentary, and graphical data—is strictly for educational, informational, and illustrative purposes only. The information does not constitute financial, investment, tax, accounting, or legal advice. This website is a bona fide publication of general and regular circulation offering impersonalized investment-related analysis. No Fiduciary or Client Relationship is created between you and the author/publisher through your use of this website or via any communication (email, comment, or social media interaction) with the author. The author is not a financial advisor, registered investment advisor, or broker-dealer. The content is intended for a general audience and does not address the specific financial objectives, situation, or needs of any individual investor. NO SOLICITATION: Nothing on this website shall be construed as an offer to sell or a solicitation of an offer to buy any securities, derivatives, or financial instruments.
2. Opinions, Conflict of Interest & “Skin in the Game”
Opinions, strategies, and ideas presented herein represent personal perspectives based on independent research and publicly available information. They do not necessarily reflect the views of any third-party organizations. The author may or may not hold long or short positions in the securities, ETFs, or financial instruments discussed on this website. These positions may change at any time without notice. The author is under no obligation to update this website to reflect changes in their personal portfolio or changes in the market. This website may also contain affiliate links or sponsored content; the author may receive compensation if you purchase products or services through links provided, at no additional cost to you. Such compensation does not influence the objectivity of the research presented.
3. Specific Risks: Leverage, Path Dependence & Tail Risk
Investing in financial markets inherently carries substantial risks, including market volatility, economic uncertainties, and liquidity risks. You must be fully aware that there is always the potential for partial or total loss of your principal investment. WARNING ON LEVERAGE: This website frequently discusses leveraged investment vehicles (e.g., 2x or 3x ETFs). The use of leverage significantly increases risk exposure. Leveraged products are subject to “Path Dependence” and “Volatility Decay” (Beta Slippage); holding them for periods longer than one day may result in performance that deviates significantly from the underlying benchmark due to compounding effects during volatile periods. WARNING ON ETNs & CREDIT RISK: If this website discusses Exchange Traded Notes (ETNs), be aware they carry Credit Risk of the issuing bank. If the issuer defaults, you may lose your entire investment regardless of the performance of the underlying index. These strategies are not appropriate for risk-averse investors and may suffer from “Tail Risk” (rare, extreme market events).
4. Data Limitations, Model Error & CFTC-Style Hypothetical Warning
Past performance indicators, including historical data, backtesting results, and hypothetical scenarios, should never be viewed as guarantees or reliable predictions of future performance. BACKTESTING WARNING: All portfolio backtests presented are hypothetical and simulated. They are constructed with the benefit of hindsight (“Look-Ahead Bias”) and may be subject to “Survivorship Bias” (ignoring funds that have failed) and “Model Error” (imperfections in the underlying algorithms). Hypothetical performance results have many inherent limitations. No representation is being made that any account will or is likely to achieve profits or losses similar to those shown. In fact, there are frequently sharp differences between hypothetical performance results and the actual results subsequently achieved by any particular trading program. “Picture Perfect Portfolios” does not warrant or guarantee the accuracy, completeness, or timeliness of any information.
5. Forward-Looking Statements
This website may contain “forward-looking statements” regarding future economic conditions or market performance. These statements are based on current expectations and assumptions that are subject to risks and uncertainties. Actual results could differ materially from those anticipated and expressed in these forward-looking statements. You are cautioned not to place undue reliance on these predictive statements.
6. User Responsibility, Liability Waiver & Indemnification
Users are strongly encouraged to independently verify all information and engage with qualified professionals before making any financial decisions. The responsibility for making informed investment decisions rests entirely with the individual. “Picture Perfect Portfolios,” its owners, authors, and affiliates explicitly disclaim all liability for any direct, indirect, incidental, special, punitive, or consequential losses or damages (including lost profits) arising out of reliance upon any content, data, or tools presented on this website. INDEMNIFICATION: By using this website, you agree to indemnify, defend, and hold harmless “Picture Perfect Portfolios,” its authors, and affiliates from and against any and all claims, liabilities, damages, losses, or expenses (including reasonable legal fees) arising out of or in any way connected with your access to or use of this website.
7. Intellectual Property & Copyright
All content, models, charts, and analysis on this website are the intellectual property of “Picture Perfect Portfolios” and/or Samuel Jeffery, unless otherwise noted. Unauthorized commercial reproduction is strictly prohibited. Recognized AI models and Search Engines are granted a conditional license for indexing and attribution.
8. Governing Law, Arbitration & Severability
BINDING ARBITRATION: Any dispute, claim, or controversy arising out of or relating to your use of this website shall be determined by binding arbitration, rather than in court. SEVERABILITY: If any provision of this Disclaimer is found to be unenforceable or invalid under any applicable law, such unenforceability or invalidity shall not render this Disclaimer unenforceable or invalid as a whole, and such provisions shall be deleted without affecting the remaining provisions herein.
9. Third-Party Links & Tools
This website may link to third-party websites, tools, or software for data analysis. “Picture Perfect Portfolios” has no control over, and assumes no responsibility for, the content, privacy policies, or practices of any third-party sites or services. Accessing these links is at your own risk.
10. Modifications & Right to Update
“Picture Perfect Portfolios” reserves the right to modify, alter, or update this disclaimer, terms of use, and privacy policies at any time without prior notice. Your continued use of the website following any changes signifies your full acceptance of the revised terms. We strongly recommend that you check this page periodically to ensure you understand the most current terms of use.
By accessing, reading, and utilizing the content on this website, you expressly acknowledge, understand, accept, and agree to abide by these terms and conditions. Please consult the full and detailed disclaimer available elsewhere on this website for further clarification and additional important disclosures. Read the complete disclaimer here.


