HCMT ETF Review: Direxion HCM Tactical Enhanced US ETF Review

There are instances where I’m really excited about a new fund but I find myself on a lonely island.

This is the case when it comes to HCMT ETF.

It’s better known as Direxion HCM Tactical Enhanced US ETF.

I haven’t heard anybody else talking about it.

Crickets.

Crickets on a lonely island representing HCMT ETF

However, I’m fascinated by the tactical strategy it potentially offers investors.

200% equities or 100% cash based on trend.

It’s all in or it’s all out.

There is no middle ground.

When I apply the filter I use to evaluate funds for inclusion/exclusion into my portfolio it passes with flying colours.

HCMT ETF passes the test with flying colours for my portfolio review

Here is my framework:

  1. Capital Efficiency
  2. Maximum Diversification
  3. Optimization

This fund is without a doubt capital efficient stretching its canvas to 200% in offensive mode.

In terms of diversification, its dual approach of turning on the equity afterburners or retreating entirely to cash means that it is strategically diversified.

It’s not a single strategy unlike other 2X to 3X equity funds and it attempts to solve their biggest problem.

Managing downside risk.

HCMT ETF downside protection potential with a shield representation

And lastly, it’s without a doubt an optimization strategy.

Often when I’ve discussed optimization strategies I’ve referred to factor tilts (value, momentum, min vol, etc) but in this case we’re talking about HCMT ETF’s tactical nature.

It instantly creates a portfolio where you’ve now got an offensive mode and a defensive mode.

Let me explain.

We’ll use a dull MCW 60/40 portfolio as our example here.

As a base we’re starting off with 60% SPY and 40% AGG.

Let’s say we replace 20% of SPY and add 20% of HCMT ETF.

Our portfolio now goes from a static 60/40 to the following:

40% SPY
20% HCMT
40% AGG

Offensive Mode:

80% Equities
40% Bonds

Defensive Mode:

40% Equities
40% Bonds
20% Cash

We boost the offensive nature of the portfolio by an entire category (from balanced <60%> to growth <80%>) and we simultaneously shrink it as well (from balanced <60%> to conservative <40%>) depending on whether the portfolio is in offensive or defensive mode.

That’s fascinating!

Offensive and Defensive Mode of HCMT ETF

In my opinion, we’re clearly aiming for better offensive production here.

But what if we used this fund to keep our equity position the same but then utilized this extra space in the portfolio to add some diversifying hedging strategies.

We’ll use the same backbone as our starting ground with a 60/40 of 60% SPY and 40% AGG.

This time we’ll replace 20% SPY with 10% HCMT and 5% CAOS and 5% BTAL.

Our portfolio now looks like this:

40% SPY
10% HCMT
40% AGG
5% CAOS
5% BTAL

Offensive Mode:

60% Equities
40% Bonds
5% OTM Put
5% Market Neutral Anti-Beta

Defensive Mode:

40% Equities
40% Bonds
10% Cash
5% OTM Put
5% Market Neutral Anti-Beta

This is a clearcut instance where we’ve used the capital efficiency of HCMT in an attempt to bolster our portfolio defense.

In my opinion, this showcases the versatility of the product to reach for the stars (boosting offense) or to create more space in the portfolio to clamp down (boosting defense).

Thus, it can be used to improve the firepower of your portfolio or to create more of a fortress. Irregardless of whichever way you tilt, you’re creating a tactical portfolio with an offensive and defensive mode by including it in your portfolio.

The Good, The Bad and The Ugly of Leveraged Equity Strategies 2X and 3X

The Good, The Bad and The Ugly With 2X Single Strategy Funds

2X funds are a lot of fun when markets are trending upwards for an extended period of time.

Just look at how well SSO performs from 2010 until 2021.
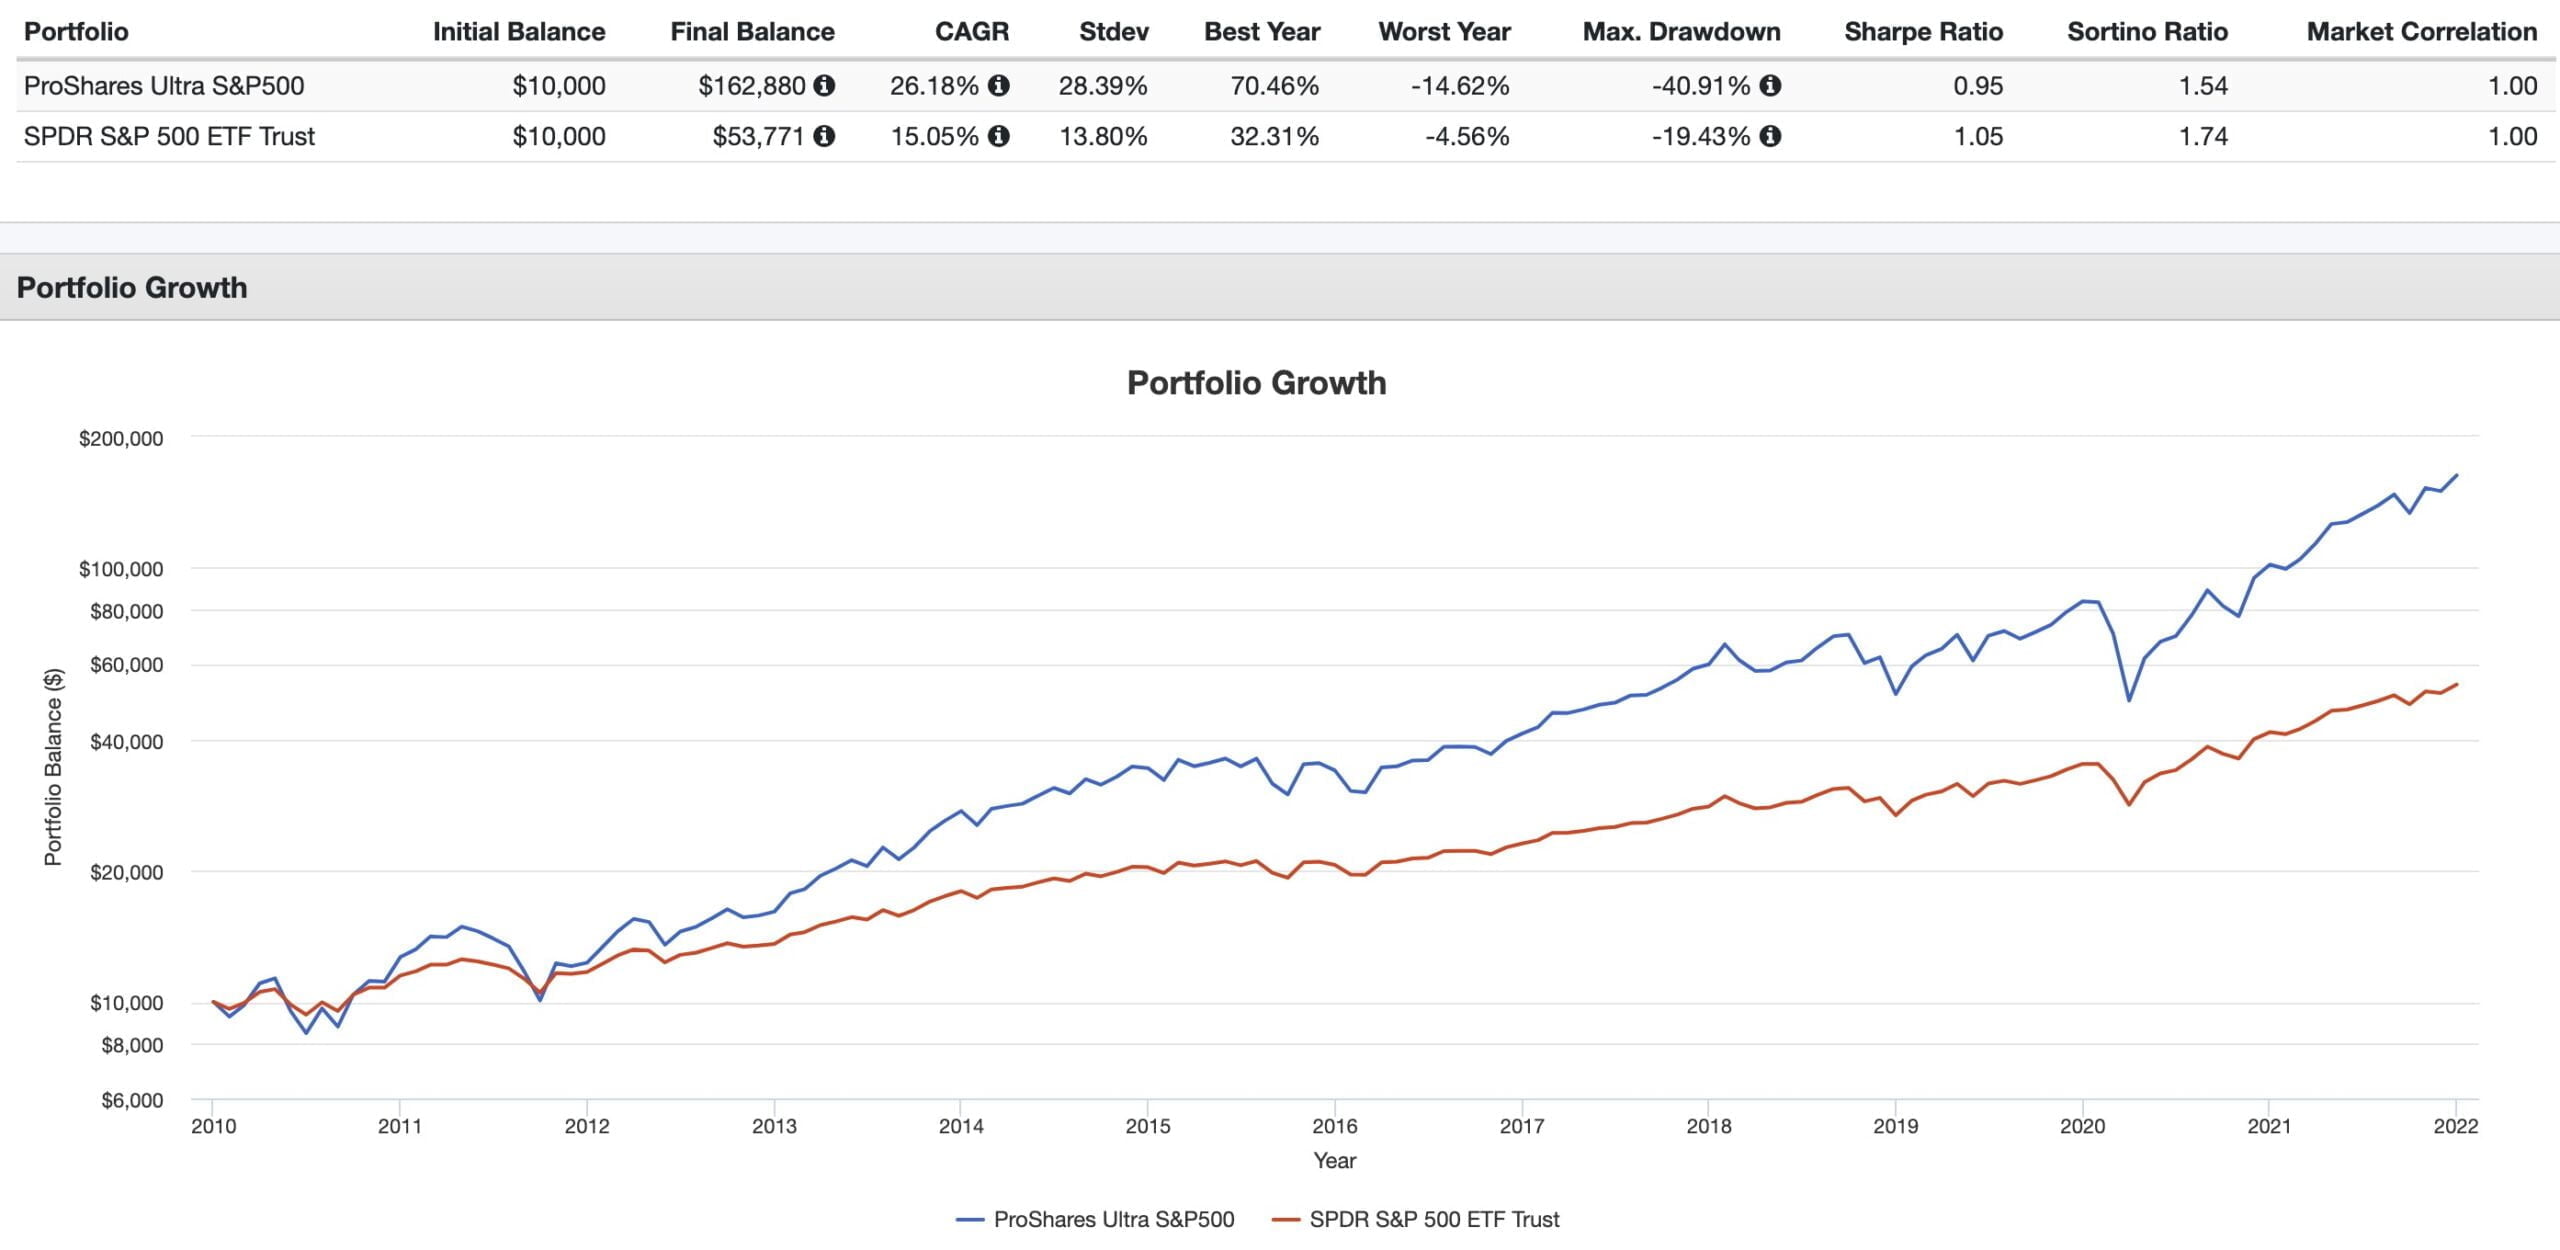
SSO ETF vs SPY ETF 2010 to 2021 performance summary backtest
source: portfoliovisualizer.com (The investment performance results presented here are based on historical backtesting and are hypothetical. Past performance, whether actual or indicated by historical tests of strategies, is not indicative of future results. The results obtained through backtesting are only theoretical and are provided for informational purposes to illustrate investment strategies under certain conditions and scenarios.)

But then you’ve got those pesky years such as 2008 or 2022 when the fund (due to its 2X nature) gets absolutely massacred.
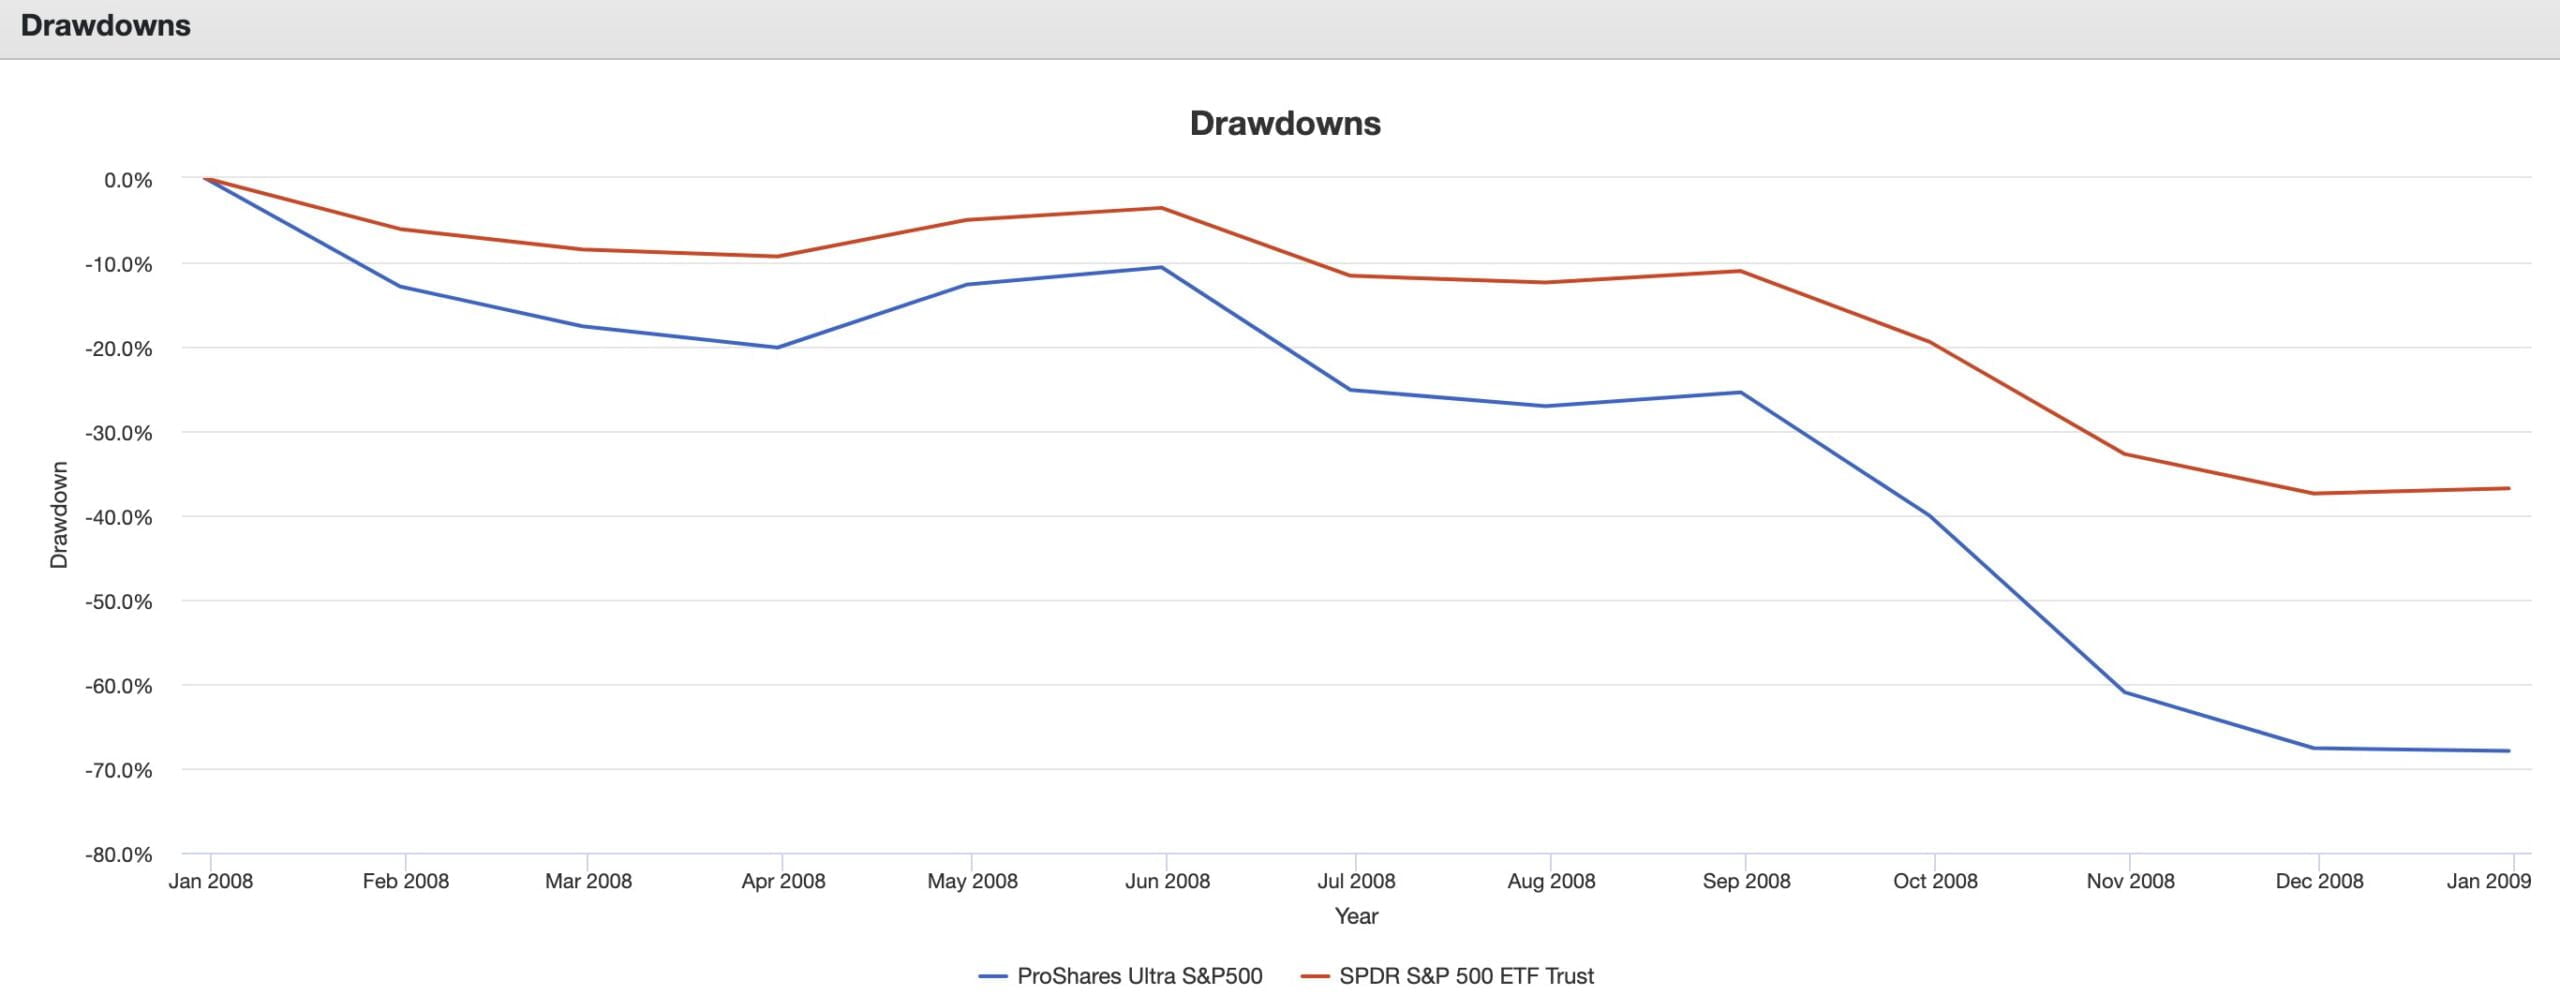
SSO ETF vs SPY ETF drawdowns in 2008
source: portfoliovisualizer.com (The investment performance results presented here are based on historical backtesting and are hypothetical. Past performance, whether actual or indicated by historical tests of strategies, is not indicative of future results. The results obtained through backtesting are only theoretical and are provided for informational purposes to illustrate investment strategies under certain conditions and scenarios.)

A lot of levered long-only asset allocators try to solve this problem by adding other long-only levered funds such as 2 or 3X long-term treasury.

That’s worked at times but then you have a year like 2022 where you’re just grasping at straws as you watch two asset classes that are historically uncorrelated get nuked together.

Being able to turn on the afterburners and retreat is a potential solution to this problem.

It’s however anything but a free lunch.

By hiding out in cash you’re also hiding out from participating in the upside recovery.

In other words, by attempting to avoid downside damage you also avoid participating in its initial recovery.

The fund, given its rules based systematic nature, retreats to 100% cash and only returns back to 200% equities when the coast is clear (when markets are in uptrend).

HCMT ETF swinging a golf club at it on the downside

The best real-life example I can think of is, you’re attempting to drive away from a crazy person swinging a golf club at your vehicle.

You get dinged with a few spectacular whacks but you eventually get away and avoid crashing your car into the telephone pole.

This represents the pain felt while the fund is getting hit by a golf club before retreating to cash.

Since you didn’t need a full body repair, you’re in much better shape from a recovery standpoint.

But when things are sunny again, you’re not out driving your car right away.

You’ve got to wait a bit to get the green light.

This represents the fund still being in cash as recovery in the marketplaces is taking place.

There is clearly a tradeoff taking place.

Less damage whilst missing out on the initial stages of recovery.

Basically, the success (or failure) of the fund hinges upon its ability to be 200% configured when markets are thriving whilst trying to sidestep carnage on the downside by hanging out in cash.

It’s a timing strategy.

Those aren’t easy to pull off.

One scenario where it wouldn’t work out so well would be a series of choppy and continuous drawdowns which have the fund getting dinged, retreating to cash (missing out on most of the upside recovery) X repeat (getting dinged again and again and again) in this fashion.

Ouch.

That’s gonna hurt.

Reviewing the HCMT ETF with magnifying glass like a detective

Review of HCMT ETF: Reviewing Direxion HCM Tactical Enhanced US ETF

Hey guys! Here is the part where I mention I’m a travel blogger, vlogger and content creator! This investing opinion blog post ETF Review is entirely for entertainment purposes only. There could be considerable errors in the data I gathered. This is not financial advice. Do your own due diligence and research. Consult with a financial advisor. 

Howard Capital Management Logo
source: howardcm.com

Howard Capital Management

Howard Capital Management is the creator of this fund with the following slogan on its homepage:

“Returns Matter. Risk Management Matters.”

They’re a firm that specializes in tactical mandates with the goal of participating in the upside (as much as possible) of markets whilst limiting its downside participation (as much as possible) of markets.

They’ve developed a rules based HCM Buyline System which you can view on their website:
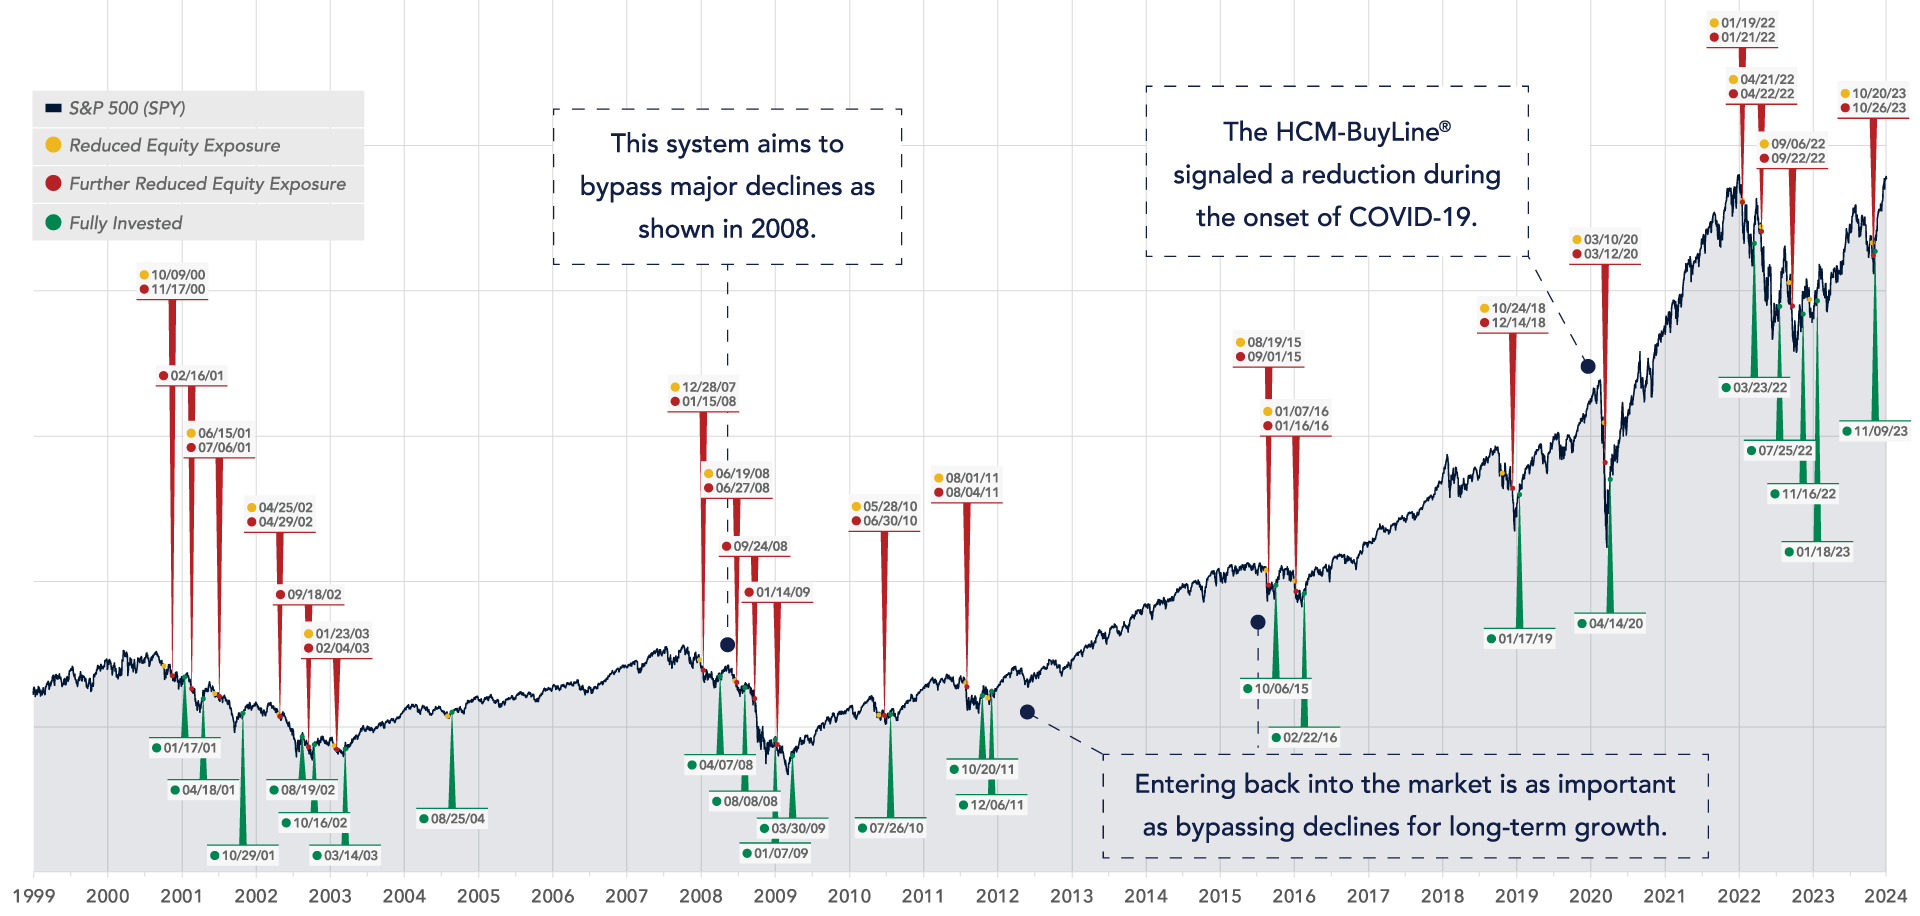
HCM Buyline Tactical System Of Market Participation and Exit Points For Equities
source: howardcm.com/index.php/hcm-buyline (The investment performance results presented here are based on historical backtesting and are hypothetical. Past performance, whether actual or indicated by historical tests of strategies, is not indicative of future results. The results obtained through backtesting are only theoretical and are provided for informational purposes to illustrate investment strategies under certain conditions and scenarios.)

HCMT ETF Overview, Holdings and Info

The investment case for “Direxion HCM Tactical Enhanced US ETF” has been laid out succinctly by the folks over at Direxion: (source: fund landing page)

Investment Case

The Fund is actively managed and seeks to provide enhanced returns across multiple market cycles that are broadly correlated to the U.S. equity markets.

The Fund uses a proprietary quantitative investment model based on the HCM-BuyLine® (the “Model”) developed by the Fund’s subadvisor, Howard Capital Management, Inc. (“Subadviser”), to determine if the Fund’s assets are allocated to U.S. equity securities or to cash and cash equivalents (i.e., money market funds, U.S. government securities and/or similar securities).

The Fund will invest in or have exposure to, U.S. equity securities in order to achieve capital appreciation, or will invest in cash or cash equivalents in order to attempt to preserve capital during market downturns.

When allocated to U.S. equities, the Fund will seek leveraged exposure of its net assets through investments in derivatives, such as swaps, in order to achieve enhanced returns.”

HCMT ETF Buy Signal targets S&P 500 and QQQ and Sector Allocation at 200% or Cash at 100%
source: direxion.com/product/direxion-hcm-tactical-enhanced-us-etf (The investment performance results presented here are based on historical backtesting and are hypothetical. Past performance, whether actual or indicated by historical tests of strategies, is not indicative of future results. The results obtained through backtesting are only theoretical and are provided for informational purposes to illustrate investment strategies under certain conditions and scenarios.)

Fund Overview

“When the Fund is allocated to U.S. equity securities, it will have approximately the following daily exposures: 80% to the S&P 500®, 80% to QQQ, and up to 40% to the Sector Allocation.**

The Fund will utilize leverage to achieve total exposure of up to 200% of the Fund’s net assets to these allocations. A Sector Allocation of less than 40% may result in the Fund having less than 200% total exposure each day.

The Subadviser provides the Fund’s investment adviser, Rafferty Asset Management, LLC (“Adviser”), with investment signals (“Investing Signals”) pursuant to the Model’s determinations.

The Adviser is responsible for investing the Fund’s assets pursuant to the Investing Signals and may rebalance the Fund’s portfolio as frequently as daily when invested in U.S. equity securities so that its exposure to the allocations is consistent with the Fund’s investment strategy.”

HCMT ETF: Fund Selection Process

To better understand the process of how the fund operates, let’s turn our attention towards the summary prospectus where I’ve summarized the key points at the very bottom. (source: summary prospectus)

Principal Investment Strategies:

Principal Investment Strategies

“The Fund is actively managed and seeks to provide enhanced returns across multiple market cycles that are broadly correlated to the U.S. equity markets. The Fund uses a proprietary quantitative investment model (the “Model”) developed by the Fund’s subadvisor, Howard Capital Management, Inc. (“Subadviser”), to determine if the Fund’s assets are allocated to U.S. equity securities or to cash and cash equivalents (i.e., money market funds, U.S. government securities and/or similar securities). The Fund will invest in, to have exposure to, U.S. equity securities in order to achieve capital appreciation, or will invest in cash or cash equivalents in order to attempt to preserve capital during market downturns. When allocated to U.S. equities, the Fund will seek leveraged exposure of its net assets through investments in derivatives, such as swaps, in order to achieve enhanced returns.

The Model attempts to identify broad trends in U.S. equity markets and utilizes the HCM-BuyLine®, a tactical proprietary indicator that uses technical indicators to identify broad trends in the U.S. equity markets, to determine whether to invest in U.S. equity securities or cash and cash equivalents. When the S&P 500® Index hits a specified threshold below the HCM-BuyLine, the Model indicates a downward trend is established and the Fund will be fully invested in cash or cash equivalents in order to attempt to preserve capital. The Fund will continue to have no equity exposure until the Model indicates that an upward trend in the U.S. markets has been established. An upward trend is established when the S&P 500 Index closes above the HCM-BuyLine for five consecutive days. The Fund will then be fully invested in U.S. equity securities and will continue to be so invested until the Model indicates that a downward trend has been established.

When the Fund is allocated to U.S. equity securities, it will have approximately the following daily exposures (obtained directly by investing in U.S. equity securities or indirectly through investments in derivatives):

  • 80% exposure to all of the securities of the S&P 500 Index (“S&P Allocation”), which measures the performance of 500 large capitalization companies listed on stock exchanges in the U.S.;
  • 80% exposure to all of the 100 largest, U.S.-based, non-financial companies listed on the NASDAQ Stock Exchange (“Technology Allocation”); and
  • Up to 40% exposure to the securities of a specific sector or industry (“Sector Allocation”). The Sector Allocation will be in one of the following 13 sectors or industries: industrial sector, communication services sector, consumer discretionary sector, consumer staples sector, energy sector, financial sector, health care sector, real estate sector, technology sector, utilities sector, materials sector, biotechnology industry and semiconductor industry.The Model determines the Sector Allocation based on a proprietary relative strength formula, which evaluates the volatility and momentum of each sector or industry to determine which is experiencing the strongest market trend relative to the other sectors or industries. The sector or industry showing the strongest upward market trend will be selected by the Model as the Sector Allocation. Only one sector or industry is selected by the Model at a time.The Sector Allocation is expected to change in response to shorter-term market conditions, which may result in high portfolio turnover and increased costs. The Fund’s exposure to the Sector Allocation may be less than 40% depending on the volatility and liquidity of the equity securities in the relevant sector or industry.The Fund will utilize leverage to achieve total exposure of up to 200% of the Fund’s net assets to the S&P Allocation, Technology Allocation and the Sector Allocation (together, the “Allocations”).A Sector Allocation of less than 40% may result in the Fund having less than 200% total exposure each day. The Subadviser will provide the Fund’s investment adviser, Rafferty Asset Management, LLC (“Adviser”), with investment signals (“Signals”) pursuant to the Model’s determinations.The Adviser is responsible for investing the Fund’s assets pursuant to the Signals and may rebalance the Fund’s portfolio as frequently as daily when invested in U.S. equity securities so that its exposure to the Allocations is consistent with the Fund’s investment strategy.The Fund may invest directly in the securities of the Allocations, in addition to utilizing exchange-traded funds (“ETFs”) and swaps that use indices or ETFs as reference assets to provide exposure to the Allocations.Each Allocation is represented by a securities market index. The Fund intends to seek exposure to the Sector Allocations by investing directly in the securities of the index, investing in an ETF that tracks the performance of the index, or obtaining exposure to the index by investing in a swap that uses the index or an ETF that tracks the performance of the index as a reference asset.On a day-to-day basis, the Fund is expected to hold ETFs and money market funds, deposit accounts with institutions with high quality credit ratings, and/or short-term debt instruments that have terms-to-maturity of less than 397 days and exhibit high quality credit profiles, including U.S. government securities and repurchase agreements. The Fund may invest in securities of any market capitalization.

    The Fund will concentrate its investments (i.e., invest 25% or more of its total assets in companies in the same industry or group of industries) to approximately the same extent as the indices representing the Allocations are so concentrated.

    The Fund may lend securities representing up to one-third of the value of the Fund’s total assets (excluding the value of the collateral received).

    The terms “daily,” “day,” and “trading day” refer to the period from the close of the markets on one trading day to the close of the markets on the next trading day. The Fund is “non-diversified,” meaning that a relatively high percentage of its assets may be invested in a limited number of issuers of securities. Additionally, the Fund’s investment objective is not a fundamental policy and may be changed by the Fund’s Board of Trustees without shareholder approval.”

Direxion HCM Tactical Enhanced US ETF Key Points

  1. Active Management for Enhanced Returns: The Fund is actively managed with the goal of delivering enhanced returns that align with the performance of the U.S. equity markets over various market cycles.
  2. Proprietary Quantitative Model: Utilizes a proprietary model developed by Howard Capital Management to decide on asset allocation between U.S. equity securities and cash or cash equivalents, aiming for capital appreciation or preservation during downturns.
  3. Leveraged Exposure Through Derivatives: When allocated to U.S. equities, the Fund seeks leveraged exposure to its net assets via derivatives like swaps to enhance returns.
  4. HCM-BuyLine® for Trend Identification: Employs the HCM-BuyLine®, a tactical indicator, for identifying U.S. equity market trends to guide investment in equity securities or cash equivalents.
  5. Response to Market Trends: Moves assets to cash or equivalents if a downward trend is indicated by the S&P 500 Index falling below the HCM-BuyLine threshold, and reinvests in equities when an upward trend is confirmed by the Index closing above the HCM-BuyLine for five consecutive days.
  6. Targeted Exposure Levels: Aims for daily exposure of 80% to S&P 500 Index and 80% NASDAQ’s 100 largest non-financial companies, and up to 40% in a specific sector or industry, based on market performance and trends.
  7. Sector Allocation Based on Strength Formula: Uses a proprietary formula to select a sector or industry showing the strongest upward trend for investment, with the possibility of high portfolio turnover due to market condition changes.
  8. Utilization of Leverage: Employs leverage to potentially double the Fund’s net asset exposure to its targeted allocations, adjusting based on actual sector allocation and market liquidity.
  9. Investment Signals for Portfolio Management: Receives investment signals from the subadviser, with the main investment adviser responsible for daily rebalancing to align with strategic exposure goals.
  10. Dynamic Allocation Strategy: Strategy involves frequent adjustments to the portfolio’s exposure levels to the specified allocations (S&P, Technology, and Sector Allocations) to adhere to the Fund’s investment strategy and respond to market dynamics.

HCMT ETF Info

Ticker: HCMT
Canvas Size: 200% Equities (80% SPY + 80% QQQ + 40% Sectors) OR 100% Cash (or cash equivalents)
Net Expense Ratio: 1.15
AUM: 261.7M
Inception: 06/22/2023

HCMT Thumbs Up and Thumbs Down

HCMT ETF Pros and Cons

Let’s move on to examine the potential pros and cons of HCMT ETF.

HCMT Pros: Distinct Advantages

  1. Allows you to create a tactical portfolio with an offensive and defensive mode
  2. The versatility of adding this fund to increase the portfolios offense or defense
  3. An attempt to solve 2X and 3X long-only equities biggest Achilles’ heel of drawdown management
  4. Not just a 2X SPY configuration (80% SPY and 80% QQQ and 40% Sector exposure)
  5. With a 20% allocation replacement in your equity sleeve it bumps you up an entire asset class on the upside (eg: from balanced to growth) with the opposite on the downside (eg: from balanced to conservative)
  6. Combines well with other capital efficient funds with exposure to equities, bonds and alternatives
  7. Attempts to be an offensive and defensive juggernaut (200% all in or 100% all out)

HCMT Cons: Potential Limitations

  1. The potential to get badly whipsawed in choppy markets where it gets dinged, retreats to cash and misses out on initial upside recovery X repeat
  2. Management fees are competitive for an active leveraged tactical strategy but may be more than low-cost indexers are used to paying

HCMT Expanded Canvas Portfolios Model

Potential HCMT ETF Model Portfolio Ideas

These asset allocation ideas and model portfolios presented herein are purely for entertainment purposes only. This is NOT investment advice. These models are hypothetical and are intended to provide general information about potential ways to organize a portfolio based on theoretical scenarios and assumptions. They do not take into account the investment objectives, financial situation/goals, risk tolerance and/or specific needs of any particular individual. 

I believe that HCMT ETF is one of the most versatile capital efficient ETFs given its tactical nature (offensive and defensive) and its ability to combine well with other funds.

I’ve actually included it in two of the official model portfolios of this site which you can read here: (Picture Perfect Portfolios 2.0) as part of the Honey Badger and SPY Hunter.

But we’ll examine two other potential portfolio options here.

Aggressive 60/40 + Alts + Afterburner/Retreat

One way to potentially integrate HCMT into a portfolio is in tandem with other capital efficient funds.

Here we’re attempting to build a 60/40 plus diversifiers plus tactical approach where we’ve got the upside of all equities and downside of a 60/40 plus alts and cash.

Model Portfolio:

20% RSBT
20% RSST
20% SPQ
20% RSSB
20% HCMT

Exposures:

Offensive Mode:

100% US Equities
40% Bonds
40% Managed Futures
10% QIS Multi-Strategy

Defensive Mode:

60% US Equities
40% Bonds
40% Managed Futures
20% Cash
10% QIS Multi-Strategy

Expanded Canvas: 

190% in Offensive Mode and 170% in Defensive Mode

Conservative 60/40 + Alts + Afterburner/Retreat

Here we’re trying to capture the upside of a 60/40 whilst retreating to the safety of a defensive 40/60 on the downside.

Model Portfolio:

20% USML
10% HCMT
40% RSBT
10% GLD
10% FLSP
10% CAOS

Exposures:

Offensive Mode:

60% US Equities (Defensive + HCMT)
40% Bonds
40% Managed Futures
10% Gold
10% Style Premia
10% OTM Put

Defensive Mode:

40% US Equities (Defensive)
40% Bonds
40% Managed Futures
10% Cash
10% Gold
10% Style Premia
10% OTM

Expanded Canvas: 

170% in Offensive Mode and 160% in Defensive Mode

HCMT ETF inflating a balloon deciding how much to allocate

Nomadic Samuel Final Thoughts

HCMT ETF is an intriguing fund.

I’ve started to grow a position in my tax-advantaged portfolios.

I’m not certain how big it will get.

Anywhere between 5% to 20% makes sense to me under certain scenarios.

However, I wouldn’t want my entire portfolio to hinge on its trend and tactical nature.

That’s currently where I’m at with the fund.

I’m glad to have it in my portfolio as a small diversifier and I’m further evaluating how much air I want to inflate into the balloon.

Crazy Golfer Chasing HCMT ETF Car With Wild Swings

However, at this point in the conversation I’m more interested in what you’ve got to say.

What do you think of HCMT ETF?

Is it on your radar?

Let me know in the comments below.

Important Information

Investment Disclaimer: The content provided here is for informational purposes only and does not constitute financial, investment, tax or professional advice. Investments carry risks and are not guaranteed; errors in data may occur. Past performance, including backtest results, does not guarantee future outcomes. Please note that indexes are benchmarks and not directly investable. All examples are purely hypothetical. Do your own due diligence. You should conduct your own research and consult a professional advisor before making investment decisions. 

“Picture Perfect Portfolios” does not endorse or guarantee the accuracy of the information in this post and is not responsible for any financial losses or damages incurred from relying on this information. Investing involves the risk of loss and is not suitable for all investors. When it comes to capital efficiency, using leverage (or leveraged products) in investing amplifies both potential gains and losses, making it possible to lose more than your initial investment. It involves higher risk and costs, including possible margin calls and interest expenses, which can adversely affect your financial condition. The views and opinions expressed in this post are solely those of the author and do not necessarily reflect the official policy or position of anyone else. You can read my complete disclaimer here

More from Nomadic Samuel
How To Invest Like Ray Dalio: Founder of Bridgewater Associates
Few names stand out as prominently as Ray Dalio, the founder of...
Read More
Leave a comment

Your email address will not be published. Required fields are marked *