If you flip on financial television during a market correction, you will eventually see Howard Marks. The anchors treat him like a secular saint, leaning in with hushed reverence to capture his latest qualitative assessment of the economic horizon. The online retail trading community hangs on every word, treating his famous Memos from the Chairman like a collection of prophetic scrolls written by a macroeconomic oracle who can see around corners.
It is a beautiful narrative. I just don’t buy it. And frankly, neither does Marks.
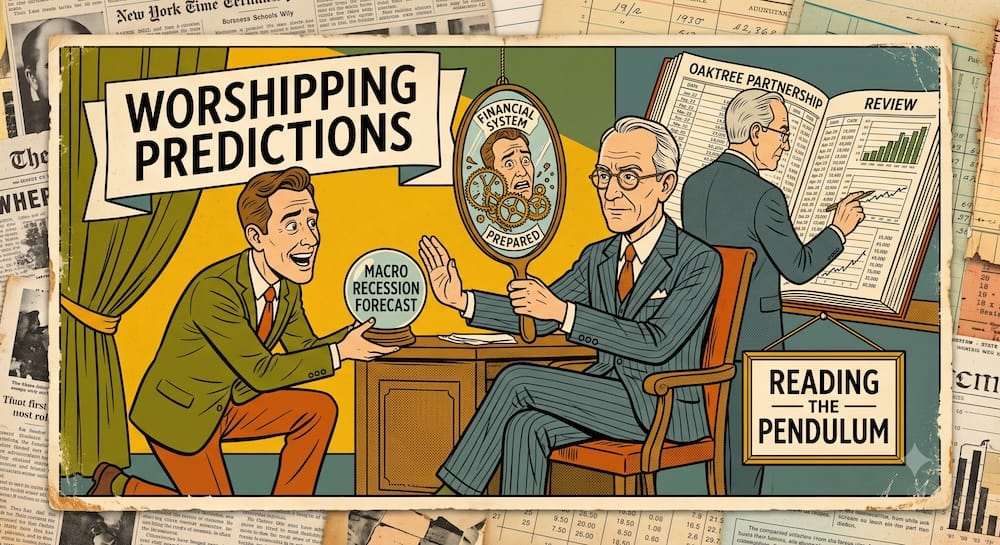
If you actually sit down and read thirty years of Oaktree Capital’s primary filings, memos, and original partnership reviews, you find something far more interesting than a guy with a crystal ball. Howard Marks is not a macroeconomic fortune teller. In fact, he has spent his entire multi-decade career loudly, repeatedly, and aggressively stating that top-down macroeconomic forecasting does not add value. He has explicitly noted that he borrowed his favorite operational mantra—”You can’t predict. You can prepare”—from an old MassMutual advertising tagline.
The media wants a wizard who can tell them when the next recession will start. Marks offers something entirely different: a mirror that shows how our own collective psychology systematically breaks and rebuilds the financial system.
This article is not about Howard Marks’s personal biography or his status as an alternative asset billionaire. It is about the specific structural mechanism of the market cycle—the feedback loop between human emotion and capital availability—and how a disciplined investor reads the pendulum instead of worshipping predictions.
The Pendulum: Fear, Greed, and Risk Tolerance
When most people look at a market cycle, they think they are looking at an economic calendar. They treat the cycle like a train schedule, assuming it is driven entirely by exogenous data points like GDP growth, corporate earnings reports, or unemployment rates.
But if you look closer, the data is only part of the story. The dangerous extremes are driven by the psychological pendulum around that data.
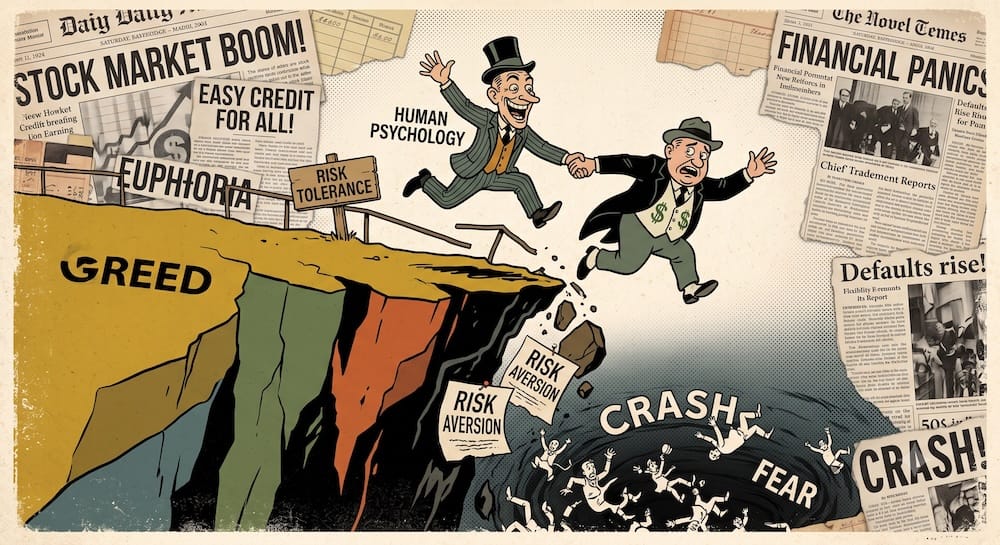
This pendulum oscillates between two destructive extremes: from euphoria to panic, from optimism to pessimism, and—most importantly—from risk tolerance to risk aversion. The financial cycle is fundamentally a feedback loop where human psychology and capital availability hold hands and jump off a cliff together.
Let’s look at how the mechanism actually functions on the upward swing:
Optimism Rises ➔ Greed Flips On ➔ Risk Tolerance Spikes ➔ Credit Loosens ➔ Prices Detach from Reality ➔ Future Returns Dry Up
When times are good, investors start to feel bulletproof. Success breeds complacency. As asset prices rise, the collective memory of the last crash fades into the background. Greed flips on, and with it comes a massive spike in risk tolerance. Investors stop demanding structural protections because they become terrified of missing out on the next big run.
This psychological shift completely alters the behavior of capital providers. Commercial banks, investment houses, and institutional funds find themselves flush with cash and desperate to deploy it. To win business, they begin competing against each other by lowering their standards. They weaken covenants, accept higher leverage multiples, and compress credit spreads.
This influx of easy, undisciplined credit drives asset prices even higher. The rising prices serve to validate the initial greed, convincing market participants that risk has been permanently banished. This is the ultimate irony of the pendulum: when things are going well and prices are at their highest, investors believe risk is at its lowest. In reality, that is exactly when structural risk is escalating to its absolute peak.
Eventually, something breaks. It doesn’t have to be a catastrophic macroeconomic event; it can simply be a collection of minor corporate disappointments or a few high-profile defaults. The illusion of safety shatters, and the pendulum immediately starts swinging back the other way.
Disappointment Hits ➔ Fear Flips On ➔ Risk Aversion Spikes ➔ Credit Freezes ➔ Prices Fall ➔ Prospective Returns Improve
As fear replaces greed, the feedback loop runs in reverse. Risk aversion skyrockets. Investors become so terrified of losing capital that they refuse to extend credit to even the most solvent enterprises. The supply of money vanishes, credit tightens to a stranglehold, and asset prices drop like a stone.
Once again, psychology and finance construct a total distortion. At the absolute bottom of the cycle, when assets are trading at historic discounts, prospective returns may be far better than they looked during the boom. Yet the market routinely concludes that risk is completely unbearable.
The disciplined investor’s job is not to forecast when this pendulum will stop swinging. The true task is simply to recognize where it currently stands and adjust one’s market posture relative to those extremes.
Cycles Are Not Clocks
The single biggest mistake I see retail portfolio builders make is converting the concept of a cycle into a mechanical clock. They read about the market pendulum and immediately start looking for a predictable calendar. They want to know if the expansion will last exactly seven years, or if the contraction will wrap up in twelve months.
Marks has spent decades trying to dismantle this exact temptation. Cycles are recurring tendencies, not train schedules. They are highly irregular, completely unpredictable in their duration, and impossible to time down to the fiscal quarter. Markets are messy human ecosystems, not Swiss watches.
If you treat a cycle like a clock, you are setting yourself up for catastrophic tracking-error regret. You will find yourself trying to execute heroic, all-in or all-out portfolio shifts based on an arbitrary timeline you invented in your head.
The goal of cycle awareness is not to predict the exact timing, shape, or catalyst of the next market turn. The goal is simply to look around at the current environment and answer a very basic question: Are we closer to the ceiling, or are we closer to the floor?
You do not need to know when the music will stop to recognize that the room is getting dangerously crowded and the valuations have completely detached from historical norms. You don’t need a predictive model to realize that when capital is being thrown at lower-quality assets with zero diligence, the odds are no longer stacked in your favor.
Credit Conditions: The Pendulum Made Visible
If the cycle is driven by psychology, how do we actually measure it without getting lost in vague qualitative vibes? You can’t put a tape measure on collective human greed, but you can put a tape measure on how that greed manifests in the real world.
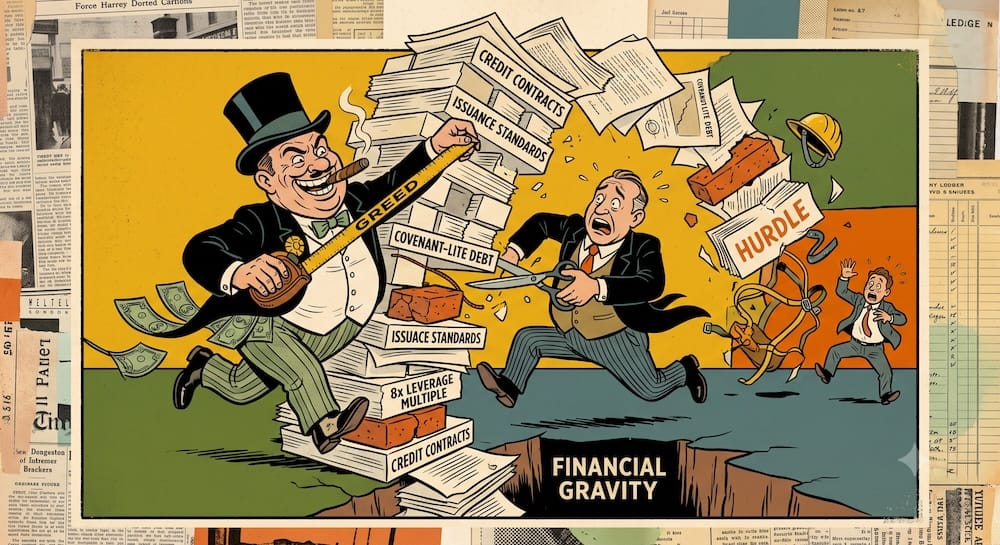
You read the pendulum by looking directly at the credit contracts and issuance standards of the market. Credit conditions are investor psychology made visible.
When risk tolerance is dangerously high, the evidence prints itself directly into the terms of everyday financial transactions. You don’t look at headline GDP numbers; you look at corporate underwriting standards.
- The Proliferation of “Covenant-Lite” Debt: Financial covenants are the legal tripwires established to protect lenders if a borrowing corporation starts running out of cash. When capital markets are flush and greed dominates, investment banks can successfully issue multi-billion-dollar debt packages that strip these protections away entirely. When you see a massive wave of covenant-lite debt clearing the market, it tells you that buyers have completely stopped demanding safety.
- Elevated Debt-to-EBITDA Multiples: Look at the leverage ratios being accepted in major corporate acquisitions. When buyers are willing to layer seven or eight times debt onto a company’s core cash flow just to win an auction, it signals that the market has completely lost its sense of financial gravity.
- Severe Yield Hunger and Spread Compression: You can observe the absolute yields available on non-investment grade credit, or look at high-yield spreads relative to risk-free US Treasuries. When the premium paid to hold risky corporate debt compresses to razor-thin historical margins, it means investors are so eager to yield-chase that they are refusing to demand a meaningful margin of safety.
These are not predictive signals that tell you a crash is scheduled for next Tuesday. They are structural data points that show you are standing in a room where everyone has agreed to play a high-stakes game with no safety gear. It is an indication of market posture, not a timing mechanism. It is less about calling the top and more about realizing the price of admission no longer matches the odds of winning.
Why the Best Opportunities Appear When Capital Disappears
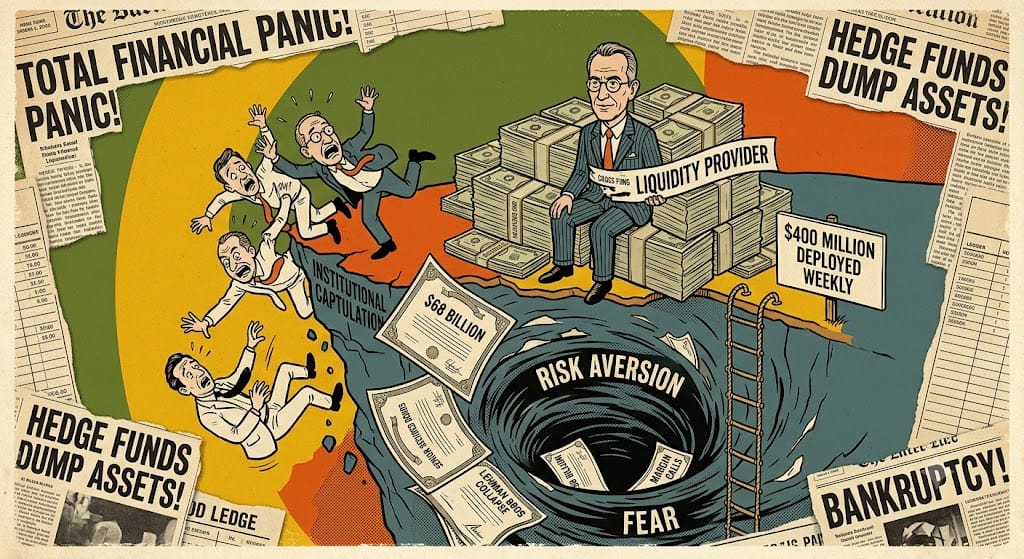
To understand what happens when the pendulum hits the absolute extreme of fear, we can look at the historical track record of Oaktree’s flagship funds. From its inception in 1995 through June 2021, Oaktree’s primary closed-end distressed debt and global opportunities fund vehicles delivered an impressive aggregate performance record, asset sizes scaling past $68 billion in committed capital, with dollar-weighted aggregate internal rates of return (IRR) reaching 21.9% before fees and approximately 16.0% net to limited partners.
This outperformance wasn’t achieved by running complex algorithmic trading software or picking winning stocks off a momentum chart. It was achieved by sitting calmly in the room when the supply of capital completely dried up.
During the peak of the 2008 Global Financial Crisis, the financial system faced total institutional capitulation. Highly leveraged hedge funds and investment houses were hit with massive margin calls from their prime brokers. They didn’t want to sell their senior secured corporate bonds, but they were structurally forced to dump whatever assets had a bid just to raise immediate cash to survive the day.
Because nobody wanted to buy, the supply of capital vanished entirely. This is the exact moment where the pendulum overshoots into deep risk aversion.
Marks didn’t try to forecast the bottom of the crisis or predict when the Federal Reserve would launch its next emergency rescue package. Instead, he relied on Oaktree’s unique fund architecture.
Oaktree does not raise money through standard open-ended mutual funds where investors can click a button and pull their cash out tomorrow morning. Their flagship vehicles are built on private closed-end partnership structures with long-term lockups. Their institutional investors sign legally binding commitments to supply cash on demand when market opportunities arise.
This structural design allowed Oaktree to act as a primary liquidity provider when the rest of the world was facing forced liquidation. During the worst fifteen weeks of late 2008 following the Lehman Brothers collapse, Marks and his team deployed capital at an average pace of about $400 million per week into senior corporate claims.
They weren’t engaging in clever timing; they were buying senior debt from viable companies at steep discounts because the traditional capital markets had completely broken down. When the pendulum eventually swung back toward equilibrium, those deeply discounted assets re-rated violently, driving the fund’s multi-decade returns.
It is worth noting that this strategy carries immense structural friction that the average online fan completely ignores. Holding a large blocking position in a distressed credit tranche can provide substantial leverage in corporate plan negotiations—because under the US Bankruptcy Code, class acceptance generally requires at least two-thirds in amount and more than one-half in number of voting claims. But that is an institutional legal game, not a passive retail hobby.
Furthermore, surviving that swing requires enduring brutal mark-to-market pain. During the 2008 panic, Oaktree’s own fund net asset values dropped by 20% to 30% on paper before recovering. And during the prolonged monetary expansion of 2014–2017, when central bank liquidity contributed to a low-default environment, Oaktree sat on massive piles of unused cash and suffered deep relative underperformance against the long-only S&P 500. It turns out that watching your peers get rich on index funds while you sit on mountains of un-deployed cash requires an almost inhuman level of career fortitude.
Why Individuals Misread Marks
The ultimate tragedy of the Howard Marks online phenomenon is how retail investors routinely take his brilliant conceptual writing and convert it into a recipe for portfolio disaster.
They read a memo about the pendulum swinging toward greed, panic, and immediately liquidate their entire long-term equity portfolio into cash. Then they sit on the sidelines for three years, watching the market continue to rise, burning capital to inflation while waiting for a crash that refuses to arrive on their invented timeline.
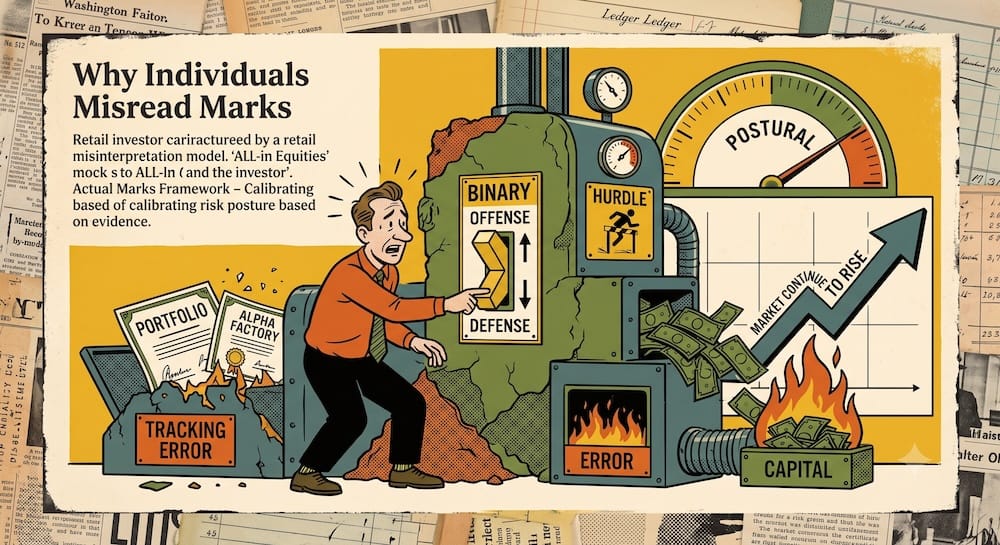
This is a total misreading of the lesson. Marks has repeatedly emphasized that Oaktree never moves completely to cash. They don’t switch between 100% offense and 100% defense.
The individual investor hears “cycles matter” and thinks they are being given permission to engage in heroic, binary market timing. They treat the portfolio like a light switch. Marks treats it like a dial.
[Retail Misinterpretation] ➔ All-In Equities OR All-In Cash (Binary Timing Switch)
[Actual Marks Framework]   ➔ Calibrate Risk Posture Incrementally Based on Evidence (Postural Dial)
When credit spreads are tight and underwriting standards are deteriorating, the historical lesson is not to liquidate everything. The principle is reducing fragility, not making a tactical forecast. You merely adjust your risk posture. You step up your skepticism, ensure your personal capital structure is completely free of toxic leverage, and verify that you are comfortable with the long-term fundamentals of the assets you hold. You prepare your temperament for a down-cycle without pretending to know the exact date the turn will occur. If you run your life with zero leverage and a wide margin of safety, you don’t need to be right about the month the music stops.
What Actually Travels
If we strip away the institutional scale, the private closed-end fund architectures, and the complex bankruptcy court litigation, what is a DIY asset builder actually supposed to absorb from Howard Marks?
We have to separate the copyable psychological framework from the uncopyable institutional mechanics. Trading bankrupt corporate debt is an elite legal blood sport; managing your own baseline posture toward risk is a conceptual discipline that travels anywhere.
The Marks Pendulum Matrix
| Pendulum State | What Investors Believe | Credit Market Clue | Price/Risk Reality | Marks-Style Lesson |
| Greed / Risk Tolerance | Risk is fundamentally low; missing out is the main danger. | Compressed spreads, loose covenants, high debt multiples. | Structural risk is rising; future expected returns are falling. | The Marks-Style lesson is greater caution and heightened skepticism. |
| Euphoria / Risk Blindness | Standard financial gravity has been permanently suspended. | Extreme leverage accepted blindly across lower-quality names. | Risk is hitting its historical peak; massive asymmetry to the downside. | The historical lesson is that capital preservation becomes paramount. |
| Middle Ground | The future is uncertain but manageable within normal ranges. | Standard underwriting protections; historical average credit spreads. | Risks and rewards are roughly balanced across asset classes. | The principle is maintaining discipline and baseline asset targets. |
| Fear / Risk Aversion | Risk is completely unbearable; cash is the only safe haven. | Widening corporate spreads, capital supply drying up rapidly. | Risk may be decreasing on a fundamental basis; returns are improving. | The conceptual takeaway is preparedness and psychological stability. |
| Panic / Forced Selling | The entire financial system is heading toward permanent collapse. | Total credit market freeze; zero bids for non-investment grade debt. | Asset prices are deeply divorced from structural solvency. | The principle is understanding that prospective returns improve when capital vanishes. |
What Travels / What Does Not
| Marks Mechanism | Institutional Version | Retail Misread | What Actually Travels |
| Distressed Debt | Legal control via blocking stakes + locked institutional capital. | Purchasing high-yield ETFs or individual junk bonds on a retail app. | The retail-level translation is avoiding fragile structures that can force liquidation. |
| Cycle Awareness | Multi-billion-dollar opportunistic capital deployment by target set. | Attempting to time exact market tops and bottoms down to the month. | Adjust humility and risk posture incrementally based on current asset valuations, not macro projections. |
| Credit Analysis | Ground-up underwriting audits and structural covenant evaluation. | Watching sensational daily financial headlines and tracking GDP charts. | Pay attention to the quality of lending standards and credit market health as indicators of broad market risk appetite. |
| Preparedness | Closed-end private partnership fund wrappers with mandatory lockups. | Holding arbitrary cash piles while attempting to execute heroic asset rotations. | Ensure personal liquidity and zero structural leverage so you never become a forced seller during a market liquidation. |
The core lesson that travels to any investor is that you must completely decouple your portfolio moves from macroeconomic prediction models. You don’t need to know when a recession will hit to look at your holdings and ask if you are being fairly compensated for the risk you are currently carrying.
Absorb the reality that human beings will always find a way to oversupply capital when times are good and systematically choke off liquidity when times are bad. The pendulum is one of the most dependable features of our financial world because human nature does not change.
You cannot stop the pendulum. You can only stop pretending it is a clock.
See you out there.
Can a retail investor access actual distressed debt instruments like Oaktree?
Not directly. The specific instruments Howard Marks trades—such as non-public defaulted senior secured corporate debt, private credit mezzanine lines, and bankrupt corporate claims—are traded over-the-counter in massive multi-million-dollar blocks completely walled off from retail brokerages. Furthermore, true distressed alpha relies on institutional scale to command a blocking stake (generally exceeding 33.4% of a debt class) to control restructuring negotiations under the bankruptcy code. For a retail portfolio, attempting to trade individual bankrupt corporate equities or single junk bonds on a standard brokerage app introduces catastrophic transaction costs, wide bid-ask spreads, and zero structural control.
What is the minimum portfolio size required to implement this cycle-awareness strategy?
There is no minimum. Because you are not buying multi-million-dollar institutional bond blocks or building private restructuring legal teams, the conceptual framework travels to any size account. The strategy is entirely positional. It requires a portfolio builder to incrementally adjust their broad asset allocation mix based on visible credit indicators, rather than liquidating accounts based on headlines. You can execute this framework with a double-digit portfolio using highly liquid, low-cost public indexing building blocks, provided you maintain an un-leveraged cash or short-term treasury reserve to ensure you never become a forced seller.
How do retail investors face tax drag when attempting to mirror credit cycle shifts?
The tax drag can be brutal if mismanaged. If a retail investor treats the cycle framework like a binary light switch—liquidating broad equity tranches into cash when credit conditions tighten—they will trigger immediate capital gains tax liabilities in taxable accounts, severely disrupting the compounding machinery. The institutional alternative utilizes private closed-end structures where capital is called and distributed organically over a decade. For individuals, the retail-level translation means keeping all systematic rebalancing and posture adjustments strictly inside tax-sheltered wrappers (like an IRA or 401k) or relying on automated, tax-loss-harvested inflows to alter asset class weights dynamically over time.
Which modern, public index products proxy the credit market metrics Marks tracks?
You cannot buy an exact replica of Oaktree’s private distress portfolio, but you can track the same psychological indicators using public, highly liquid credit indices. To monitor broad market risk appetite, portfolio builders watch the ICE BofA High Yield Index Option-Adjusted Spread (OAS), which is a free, publicly accessible indicator tracking the yield premium demanded by lenders over risk-free US Treasuries. While retail high-yield corporate bond ETFs (such as HYG or JNK) or short-duration high-yield profiles exist, they face structural liquidity mismatches during systemic panics; therefore, they are best studied as indicators of market risk tolerance rather than treated as a magical retail shortcut to institutional distress alpha.
How does an investor avoid the trap of turning cautious too early in an expansion?
Accept that tracking error is the cost of discipline. Howard Marks frequently acknowledges that Oaktree turned structurally defensive too early during the prolonged post-GFC expansion, holding large piles of low-yielding cash (“dry powder”) while long-only equities rocketed higher. The individual investor avoids setting their portfolio on fire by refusing to treat the pendulum like a precise timing calendar. You do not make heroic, predictive macro all-out trades. Instead of a complete portfolio exit, the conceptual takeaway is an incremental, systematic dial down of risk—such as tilting equity components toward the Quality or Value factor and holding pristine cash reserves—while remaining fundamentally invested in the market canvas.
What is the core difference between a credit cycle and an economic GDP cycle?
The data matters, but the dangerous extremes are driven by the psychological pendulum around that data. An economic GDP cycle measures real-world production, employment, and consumption over quarters and years. A credit cycle measures the structural availability, terms, and cost of loanable money. Because capital markets are run by human beings prone to overreaction, the credit cycle swings far faster and wider than the underlying real economy. Lending standards loosen dramatically based on optimism long before GDP hits a ceiling, and credit chokes off entirely into sharp panic long before economic data hits a bottom. Marks targets the credit cycle because it isolates the direct leverage point where capital scarcity creates mispriced assets.
This article is also available in Spanish. [Leé la versión en castellano: Howard Marks y los ciclos de mercado: El péndulo entre el miedo y la codicia]