Candlestick patterns are like the secret language of the stock market. They’re visual tools used in technical analysis to represent price movements of a security over a specific period. Imagine each candlestick as a story, telling you whether the bulls (buyers) or the bears (sellers) were in control during that time frame. These patterns are crucial because they help traders decipher market sentiment and make informed decisions. From single candlesticks to complex formations, these patterns provide insights into potential market reversals, continuations, and overall trends.
Overview Of Bullish Candlestick Patterns
source: The Moving Average on YouTube
So, why focus on bullish candlestick patterns? Simple. They can be game-changers for traders looking to capitalize on upward market movements. This article aims to demystify bullish candlestick patterns and highlight their significance in trading. Whether you’re a seasoned trader looking to refine your strategy or a beginner eager to learn the ropes, understanding these patterns can give you a competitive edge. We’ll dive into what they are, how they form, and how you can use them to spot profitable opportunities. Ready to elevate your trading game? Let’s get started!
Understanding Candlestick Patterns
Definition of Candlestick Patterns
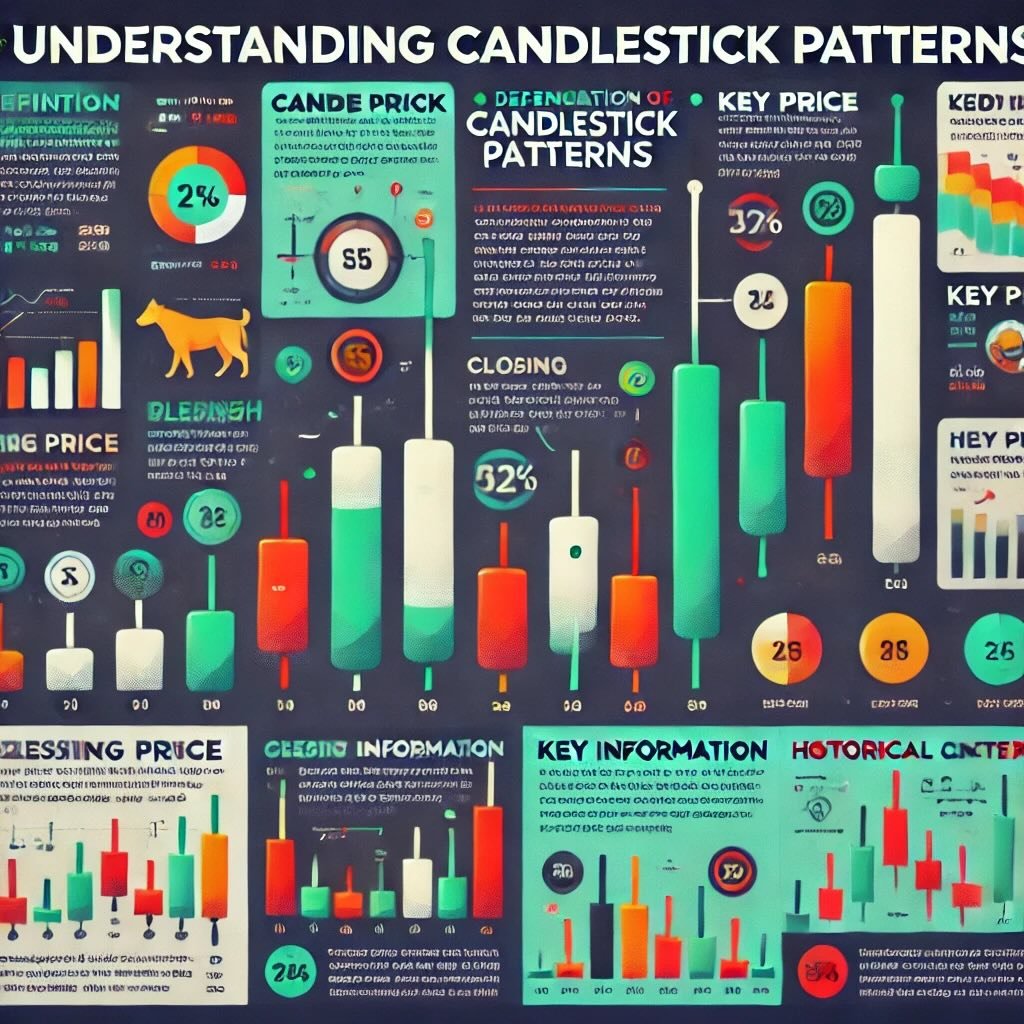
Candlestick patterns are visual representations of price movements in the financial markets. Each candlestick shows four key pieces of information for a given period: the opening price, the closing price, the highest price, and the lowest price. Think of it as a compact summary of market activity. The body of the candlestick indicates the opening and closing prices, while the wicks (or shadows) show the highs and lows. A green (or white) candlestick means the closing price was higher than the opening price, signaling bullish sentiment. Conversely, a red (or black) candlestick means the closing price was lower, indicating bearish sentiment.
These patterns can be single candlesticks or combinations of multiple candlesticks that form over a series of trading periods. Each pattern provides insights into market psychology and potential future price movements. Traders use these patterns to make decisions about buying, selling, or holding securities.
Historical Context
Candlestick patterns have a fascinating history, tracing their origins back to 18th-century Japan. They were developed by a rice trader named Munehisa Homma, who used them to track the price and volume of rice contracts. Homma discovered that by using these patterns, he could predict future price movements based on historical price action and market psychology. This method proved so effective that it was later adopted by Japanese traders and eventually gained popularity worldwide.
The principles behind candlestick patterns have stood the test of time, transitioning from the bustling rice markets of Osaka to modern-day financial markets. Today, they are an essential tool in technical analysis, helping traders decipher market trends and make informed trading decisions. The elegance of candlestick patterns lies in their simplicity and the depth of information they convey, making them invaluable for anyone serious about trading.
What is a Bullish Candlestick Pattern?
Definition of Bullish Patterns
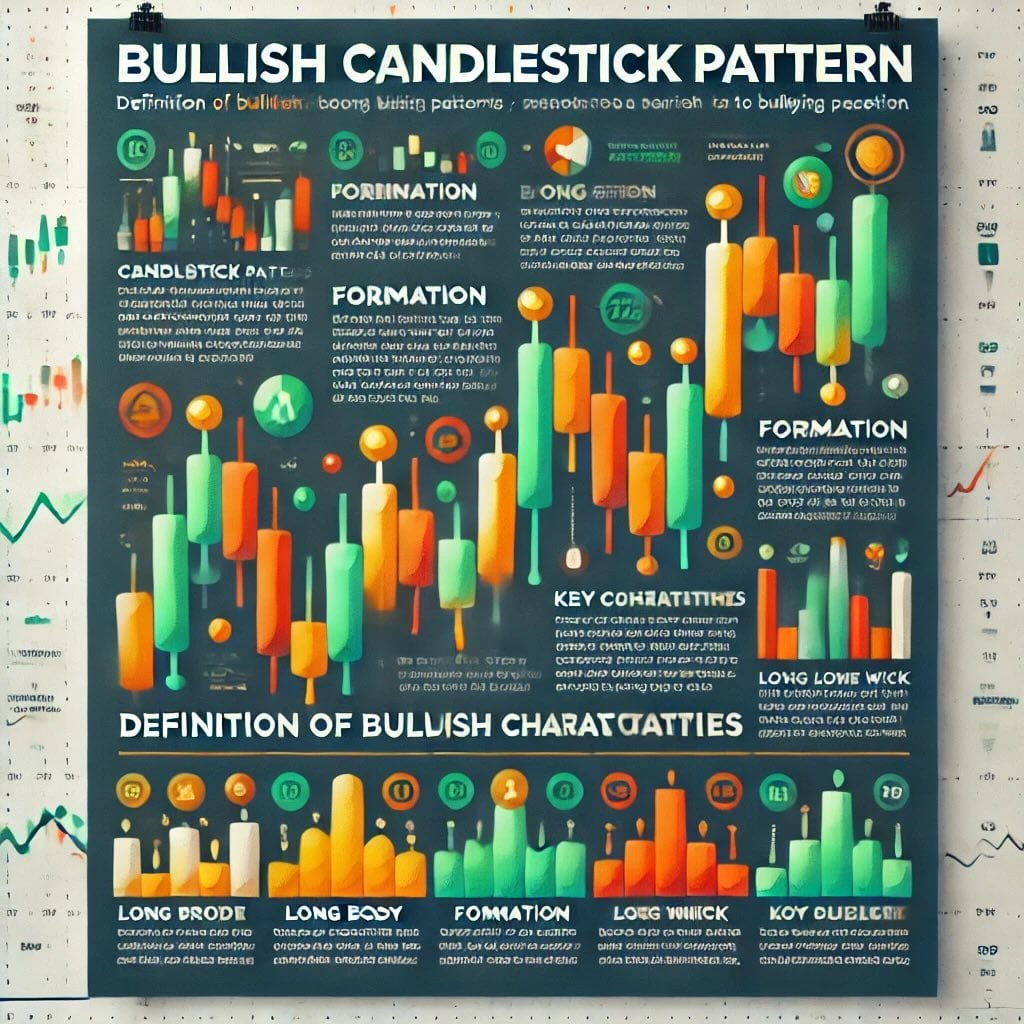
Bullish candlestick patterns are specific formations on a price chart that suggest a potential upward movement in the market. In other words, they signal that the buyers (bulls) are gaining control and pushing the price higher. These patterns are invaluable for traders looking to enter the market at the start of an upward trend. They can occur over one day or over several trading sessions, and their primary function is to indicate a shift from a bearish (downward) to a bullish (upward) sentiment.
Formation
Bullish candlestick patterns are formed when the closing price of a period is higher than the opening price, indicating that buyers were strong enough to overcome sellers. Here’s how it typically works: a trading period opens, and as the period progresses, buying pressure pushes the price up, resulting in a close higher than the opening price. The length and shape of the candlestick’s body and wicks (shadows) provide additional insights into the market’s behavior during that period.
Key Characteristics
Understanding the key characteristics of bullish candlestick patterns can help you identify them more accurately and make better trading decisions. Here are the main features to look out for:
- Color: Bullish candlesticks are usually green or white. This color coding makes it easy to spot periods where the price has closed higher than it opened.
- Body Size: The body of a bullish candlestick represents the difference between the opening and closing prices. A long body indicates strong buying pressure, while a shorter body suggests more modest gains. Larger bodies are generally more significant, showing a clear dominance of buyers.
- Wick Length: The wicks (or shadows) are the lines extending above and below the body of the candlestick. They show the highest and lowest prices during the trading period. A long lower wick, for example, can indicate that sellers pushed the price down, but buyers were strong enough to drive it back up, showing potential bullish strength.

Common Bullish Candlestick Patterns
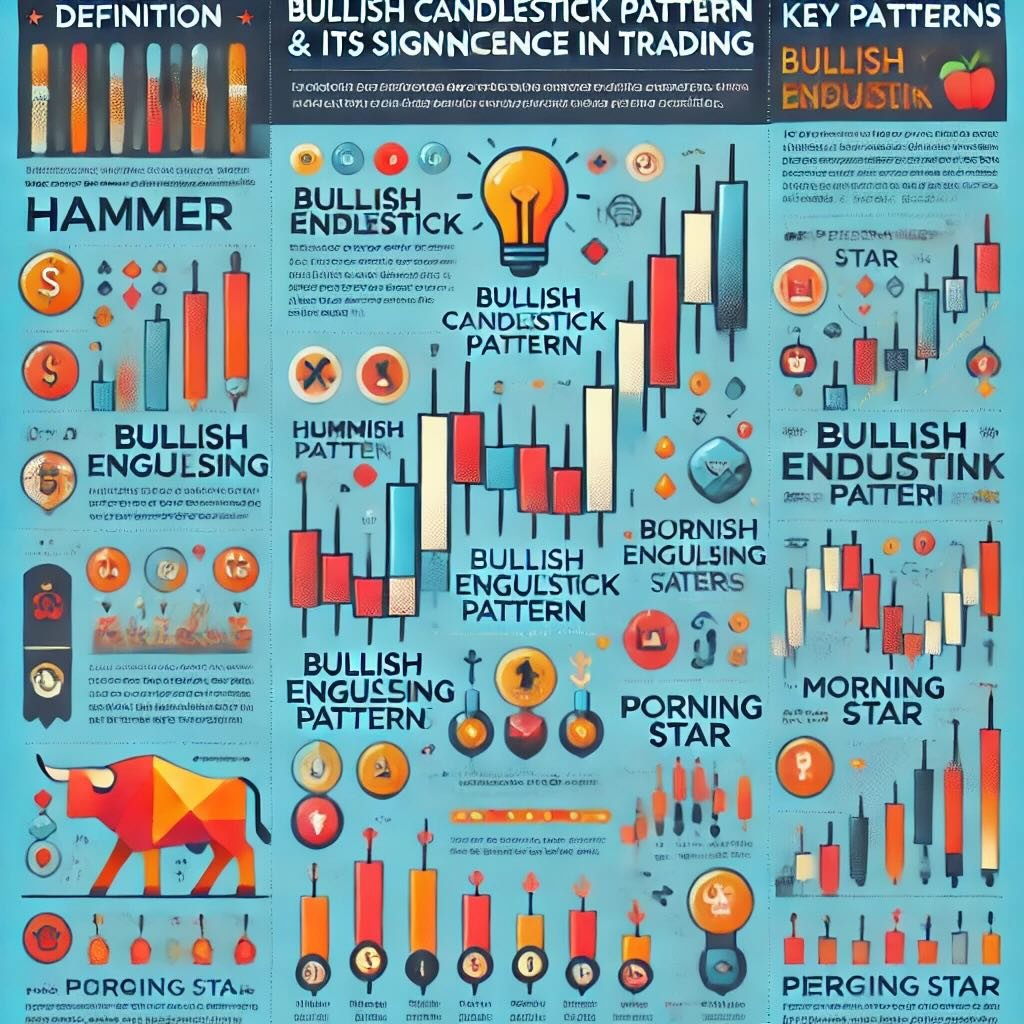
Hammer
The hammer is a single candlestick pattern that signals a potential reversal from a downtrend to an uptrend. Picture a hammer—it’s a small body with a long lower wick, resembling the tool it’s named after. The body can be green or red, but the key is that the lower wick is at least twice the length of the body. This pattern appears at the bottom of a downtrend, indicating that although sellers pushed the price down during the trading period, buyers stepped in and drove the price back up, showing their strength. The hammer suggests that the bulls are gaining control and a reversal might be on the horizon.
Bullish Engulfing
The bullish engulfing pattern is a powerful two-candlestick formation. It occurs during a downtrend and is composed of a small red candlestick followed by a larger green candlestick that completely engulfs the body of the first candle. This pattern indicates a potential reversal as the strong buying pressure on the second day overwhelms the selling pressure of the first. The bullish engulfing pattern signals that the bulls have taken charge, and a price increase is likely. It’s a clear message that buyer sentiment is turning positive, making it a strong entry signal for traders.
Morning Star
The morning star is a three-candlestick pattern that typically appears at the end of a downtrend. It consists of a long red candlestick, followed by a small-bodied candle (which can be red or green) that gaps down, and then a long green candlestick that closes above the midpoint of the first candle. This pattern is significant because it shows a transition in market sentiment. The first candle indicates strong selling pressure, the second candle shows indecision, and the third candle represents a strong buying surge. The morning star is a reliable indicator of a bullish reversal, suggesting that the downtrend has exhausted and buyers are now in control.
Piercing Line
The piercing line is another two-candlestick pattern that suggests a bullish reversal. It forms during a downtrend and starts with a long red candlestick, followed by a long green candlestick that opens below the previous candle’s low but closes above the midpoint of the red candle. This pattern indicates that after a period of selling, buyers have entered the market aggressively, driving the price up. The piercing line pattern is a strong signal that the bulls are making a comeback and that the downtrend might be reversing.
Three White Soldiers
The three white soldiers pattern is a strong bullish reversal pattern that consists of three consecutive long green candlesticks. Each candle opens within the body of the previous one and closes near its high, with little or no lower wick. This pattern usually appears after a period of consolidation or at the end of a downtrend. It signifies sustained buying pressure and strong bullish momentum. The three white soldiers pattern indicates that the bulls have taken control and that a significant uptrend is likely to follow. It’s one of the most reliable bullish patterns, suggesting that the market sentiment has turned decidedly positive.
Interpreting Bullish Candlestick Patterns
Context and Confirmation
Spotting a bullish candlestick pattern is just the first step. To make informed trading decisions, you need to consider the broader market context. Is the overall market trending up, down, or sideways? Are there any major economic events or earnings reports coming up? These factors can influence the effectiveness of a candlestick pattern.
Confirmation is crucial. A single candlestick pattern might not be enough to act on. Wait for the next few candlesticks to confirm the pattern. For example, if you see a bullish engulfing pattern, look for subsequent green candlesticks to confirm the upward trend. By considering the context and seeking confirmation, you reduce the risk of false signals and improve the accuracy of your trades.
Volume Analysis
Volume is the heartbeat of the market. It tells you how much interest there is in a particular price movement. When interpreting bullish candlestick patterns, volume analysis can be a powerful tool. High volume on a bullish pattern indicates strong buying interest and adds weight to the signal.
For instance, a hammer pattern followed by a green candlestick on high volume is a stronger signal than the same pattern on low volume. High volume suggests that many traders agree with the bullish sentiment, increasing the likelihood of a sustained price move. Always check the volume to gauge the strength of the candlestick pattern.
Combining with Other Indicators
While bullish candlestick patterns are helpful, combining them with other technical indicators can enhance their reliability. Moving averages, for example, can help you identify the overall trend. If you spot a bullish pattern above a key moving average, it’s a stronger signal. Conversely, a bullish pattern below a moving average might be less reliable.
The Relative Strength Index (RSI) is another useful tool. RSI measures the speed and change of price movements and can indicate overbought or oversold conditions. A bullish candlestick pattern in an oversold region (RSI below 30) can be a particularly strong signal of an impending upward move. Using indicators like moving averages and RSI alongside candlestick patterns helps you build a more comprehensive trading strategy and make more informed decisions.
Significance of Bullish Candlestick Patterns in Trading
Identifying Trend Reversals
Bullish candlestick patterns are like beacons in the fog of market fluctuations. They help traders identify potential trend reversals, signaling that a downtrend might be coming to an end and an uptrend could be starting. Patterns like the hammer and the morning star are particularly effective in highlighting these shifts. Imagine you’ve been watching a stock decline for weeks. Suddenly, a hammer forms at the bottom of this downtrend. This pattern suggests that despite the selling pressure, buyers have stepped in forcefully, potentially marking the end of the downtrend. Recognizing these patterns early can give you a head start on catching the new trend before it gains full momentum.
Entry and Exit Points
Timing is everything in trading, and bullish candlestick patterns can be your guide to pinpointing optimal entry and exit points. For instance, if you spot a bullish engulfing pattern, it might be a good time to enter a long position, betting that the price will continue to rise. Conversely, noticing a three white soldiers pattern after a period of consolidation could signal a strong bullish momentum, suggesting it’s a good time to ride the wave.
Exit points are equally crucial. If you’ve been riding an uptrend and suddenly spot a bearish pattern like a shooting star, it might be a signal to take profits and exit your position. By using these patterns, you can make more informed decisions about when to enter or exit trades, maximizing your potential profits and minimizing your losses.
Risk Management
Risk management is a cornerstone of successful trading, and bullish candlestick patterns play a vital role in this aspect. Setting stop-loss orders based on these patterns can help protect your capital. For example, after entering a long position based on a bullish engulfing pattern, you can set a stop-loss just below the low of the engulfing candle. This way, if the market moves against you, your losses are limited.
Furthermore, understanding the significance of these patterns helps you avoid premature entries. By waiting for confirmation of a bullish pattern, you reduce the risk of false signals. This disciplined approach ensures that you’re not jumping into trades based on incomplete information, which can be costly.

Practical Examples and Case Studies
Real-World Examples
Let’s dive into the world of real trading scenarios where bullish candlestick patterns made a significant impact.
Example 1: The Hammer in Apple Inc. (AAPL)
Back in March 2020, as the COVID-19 pandemic caused a market meltdown, Apple Inc. (AAPL) experienced a sharp decline. Amid this chaos, a hammer pattern emerged on the daily chart. The long lower wick indicated that sellers initially dominated, but buyers stepped in forcefully by the close. Following this hammer, Apple’s stock price began a remarkable recovery, rallying over the next few months. Traders who recognized this pattern and acted on it could have capitalized on the ensuing uptrend.
Example 2: Bullish Engulfing in Tesla Inc. (TSLA)
Tesla Inc. (TSLA) is known for its volatile price movements. In June 2021, after a period of consolidation, a bullish engulfing pattern appeared on the weekly chart. The green candle completely engulfed the prior week’s red candle, signaling strong buying interest. This pattern was followed by a substantial upward move, with Tesla’s stock price soaring to new highs. Traders who spotted this bullish engulfing pattern and went long would have benefited significantly from this price action.
Case Studies
Now, let’s look at some detailed case studies where bullish candlestick patterns proved their worth.
Case Study 1: Morning Star in Netflix Inc. (NFLX)
In late 2018, Netflix Inc. (NFLX) was in the midst of a downtrend, with its stock price plummeting. In December, a morning star pattern formed on the daily chart. This three-candlestick pattern started with a long red candle, followed by a small-bodied candle that gapped down, and finally a long green candle that closed above the midpoint of the first red candle. This pattern indicated a potential reversal. Indeed, Netflix’s stock began to climb steadily after the morning star appeared, marking the end of the downtrend and the beginning of a new uptrend. Traders who recognized this pattern had a clear signal to enter a long position and ride the upward momentum.
Case Study 2: Piercing Line in Microsoft Corporation (MSFT)
In early 2019, Microsoft Corporation (MSFT) experienced a short-term downtrend. During this period, a piercing line pattern formed on the daily chart. The first candle was a long red one, indicating strong selling pressure. The next day, a green candle opened below the previous day’s low but closed above the midpoint of the red candle. This piercing line pattern signaled a bullish reversal. Following this formation, Microsoft’s stock price began to rise, ultimately leading to a new upward trend. Traders who identified this pattern had an excellent opportunity to go long and benefit from the subsequent price increase.

Common Mistakes to Avoid
Over-Reliance on Patterns
While bullish candlestick patterns are powerful tools, relying solely on them is a common mistake. These patterns provide insights, but they shouldn’t be the only factor guiding your trading decisions. Think of them as a piece of the puzzle rather than the entire picture. For instance, spotting a hammer pattern is great, but if you don’t consider the overall trend or other technical indicators, you might make misguided trades. Diversify your analysis by incorporating fundamentals, other technical tools, and market sentiment to create a well-rounded strategy.
Ignoring Market Context
Another pitfall is ignoring the broader market context. A bullish pattern in a strong downtrend might not hold the same weight as it would in a consolidating or uptrend market. Always consider the bigger picture. Are there economic events or news releases on the horizon? What’s the overall market sentiment? For example, if the market is reacting to geopolitical tensions or major economic reports, a bullish pattern might fail to materialize into a significant uptrend. Context is king. Ensure that your interpretation of candlestick patterns aligns with the broader market dynamics.
Failing to Confirm Signals
Confirmation is key. Jumping into a trade based on a single candlestick pattern without seeking confirmation can lead to false signals and losses. After spotting a bullish pattern, look for additional signs to validate the signal. Use technical indicators like moving averages, RSI, or MACD to confirm the trend. For example, if you see a morning star pattern, wait for the next candlestick to confirm the upward move before entering the trade. Confirmation adds an extra layer of assurance, reducing the risk of acting on premature or misleading signals.

Tools and Resources for Identifying Bullish Candlestick Patterns
Charting Software
To identify bullish candlestick patterns effectively, having the right charting software is essential. Here are some top-notch tools that can help:
- TradingView: Known for its user-friendly interface and robust charting capabilities, TradingView offers a vast array of indicators and customizable charts. It’s a favorite among traders for its social community features, where you can share and discuss ideas.
- MetaTrader 4 and 5: These platforms are industry standards for a reason. They offer comprehensive charting tools, a wide range of technical indicators, and the ability to automate trading strategies. MetaTrader’s versatility makes it a go-to for both beginners and advanced traders.
- Thinkorswim by TD Ameritrade: This powerful platform provides advanced charting capabilities, a plethora of technical indicators, and a highly customizable interface. Thinkorswim is particularly well-regarded for its educational resources and analytical tools.
- NinjaTrader: Another great option, especially for those who prefer futures and forex trading. NinjaTrader offers advanced charting, market analysis tools, and the ability to develop custom indicators.
Books and Courses
To deepen your understanding of bullish candlestick patterns and technical analysis, these books and courses are invaluable:
- Books:
- “Japanese Candlestick Charting Techniques” by Steve Nison: Considered the bible of candlestick charting, this book provides a comprehensive overview of candlestick patterns and their applications.
- “Technical Analysis of the Financial Markets” by John Murphy: This classic covers a wide range of technical analysis tools, including candlestick patterns.
- “Candlestick Charting Explained” by Gregory Morris: A great resource for learning about the history and practical application of candlestick patterns.
- Courses:
- Udemy’s Technical Analysis Masterclass: This course covers everything from the basics to advanced strategies, including detailed modules on candlestick patterns.
- Coursera’s Trading Strategies in Emerging Markets by the Indian School of Business: Offers insights into technical analysis, with a focus on trading strategies that include candlestick patterns.
- Investopedia Academy’s Technical Analysis Course: A comprehensive course that includes candlestick charting techniques among other technical analysis tools.
Online Resources
In the digital age, the internet is brimming with valuable resources for traders. Here are some top picks:
- Investopedia: This site offers a wealth of articles and tutorials on candlestick patterns and technical analysis. It’s a great starting point for beginners and a handy reference for seasoned traders.
- StockCharts.com: Provides a plethora of educational resources, including an extensive section on candlestick patterns. The site also offers powerful charting tools.
- TradingView Community: Engage with other traders, share your ideas, and learn from the collective wisdom of the TradingView community. It’s an excellent way to see how others use candlestick patterns in real time.
- BabyPips: Primarily focused on forex trading, BabyPips offers a comprehensive education section on technical analysis and candlestick patterns, making it accessible for traders of all levels.
12-Question FAQ: Bullish Candlestick Patterns & Their Significance
1) What is a bullish candlestick pattern?
A chart formation that signals buyers are taking control and prices may rise—often after a decline or consolidation.
2) How does a single candlestick convey information?
Each candle shows open, high, low, close. A filled/green body (close > open) is bullish; upper/lower wicks show intraperiod extremes and rejection.
3) Why do bullish patterns matter to traders?
They visualize shift in sentiment, helping you spot potential reversals/continuations, plan entries, and place risk-defined stops.
4) What are the most common bullish patterns?
Hammer (long lower wick, small body at lows)
Bullish Engulfing (green body engulfs prior red body)
Morning Star (red → small “star” → strong green)
Piercing Line (green opens below prior low, closes above midpoint of prior red)
Three White Soldiers (three strong consecutive green candles)
5) How do I confirm a bullish pattern?
Look for: follow-through candles closing higher, location at support/trendline/Fibonacci levels, and alignment with the higher-timeframe trend.
6) What role does volume play?
Rising or above-average volume on/after the pattern strengthens the signal; weak volume reduces conviction.
7) Typical entries & stops for popular setups?
Hammer: Enter on break above hammer high; stop below its low.
Bullish Engulfing: Enter on next candle’s break above engulfing high; stop below engulfing low.
Morning Star: Enter on the third candle close/next break; stop below star’s low.
Piercing Line: Enter on close above prior midpoint or next break; stop below pattern low.
Three White Soldiers: Enter after candle 2–3 closes or on minor pullback; stop below the base of the formation.
8) Which indicators pair well with bullish patterns?
Moving Averages (50/200) for trend bias
RSI (<30–40 oversold + bullish pattern = stronger case)
MACD for momentum confirmation
Fibonacci (38.2–61.8% retracements as context)
9) Do bullish patterns work on all markets & timeframes?
Yes—stocks, FX, crypto, futures—but reliability rises with more liquid markets and higher timeframes (e.g., daily/weekly).
10) What are common mistakes to avoid?
Over-reliance on a single candle, ignoring trend/context, skipping confirmation, trading thin/illiquid names, and not pre-defining risk.
11) How do I use patterns for trade planning (quick checklist)?
Identify trend → spot pattern at support → check volume/indicator confluence → define entry/stop/target (R:R ≥ 1:2) → size position → execute → trail/scale per plan.
12) Any risk-management tips specific to candlestick trades?
Place stops beyond the pattern’s invalidation level, cap risk to 1–2% per trade, avoid events (earnings/news) unless intentional, and journal outcomes to refine rules.
Educational content only—not investment advice. Always test and manage risk.
Conclusion
We’ve covered a lot of ground in this exploration of bullish candlestick patterns:
- Definition and Formation: Understanding what bullish candlestick patterns are and how they form on price charts.
- Specific Patterns: Detailed insights into key patterns like the hammer, bullish engulfing, morning star, piercing line, and three white soldiers.
- Interpretation: The importance of interpreting these patterns in context, confirming them with volume and other indicators.
- Trading Significance: Identifying trend reversals, setting optimal entry and exit points, and managing risk effectively using these patterns.
- Practical Examples: Real-world examples and case studies illustrating the successful application of bullish candlestick patterns.
- Common Mistakes: Avoiding over-reliance on patterns, ignoring market context, and failing to confirm signals.
- Tools and Resources: Recommendations for charting software, books, courses, and online resources to aid in identifying and understanding these patterns.
Encouragement to Practice
Theory is great, but practice makes perfect. To truly grasp the power of bullish candlestick patterns, you need to see them in action. Use demo accounts to practice identifying these patterns and executing trades without risking real money. Many trading platforms offer demo accounts, allowing you to apply what you’ve learned in a risk-free environment. This hands-on experience will build your confidence and improve your ability to recognize and act on these patterns in real-time. Remember, the more you practice, the sharper your trading instincts will become.
Final Thoughts
Incorporating candlestick patterns into your trading strategy can significantly enhance your market analysis and decision-making process. However, it’s crucial to remember that no single indicator or pattern guarantees success. Use candlestick patterns as part of a broader strategy that includes other technical indicators, fundamental analysis, and a keen awareness of market context. This holistic approach will help you make more informed and balanced trading decisions.
Candlestick patterns are powerful tools that offer insights into market sentiment and potential price movements. By mastering them, you can gain a valuable edge in your trading endeavors. Stay curious, keep learning, and continuously refine your strategy. Trading is a journey, and every bit of knowledge and experience you gain along the way will contribute to your success. Ready to take your trading to the next level? Embrace the power of bullish candlestick patterns and start making more confident, informed trading decisions today.
Happy trading!
Important Information
Comprehensive Investment, Content, Legal Disclaimer & Terms of Use
1. Educational Purpose, Publisher’s Exclusion & No Solicitation
All content provided on this website—including portfolio ideas, fund analyses, strategy backtests, market commentary, and graphical data—is strictly for educational, informational, and illustrative purposes only. The information does not constitute financial, investment, tax, accounting, or legal advice. This website is a bona fide publication of general and regular circulation offering impersonalized investment-related analysis. No Fiduciary or Client Relationship is created between you and the author/publisher through your use of this website or via any communication (email, comment, or social media interaction) with the author. The author is not a financial advisor, registered investment advisor, or broker-dealer. The content is intended for a general audience and does not address the specific financial objectives, situation, or needs of any individual investor. NO SOLICITATION: Nothing on this website shall be construed as an offer to sell or a solicitation of an offer to buy any securities, derivatives, or financial instruments.
2. Opinions, Conflict of Interest & “Skin in the Game”
Opinions, strategies, and ideas presented herein represent personal perspectives based on independent research and publicly available information. They do not necessarily reflect the views of any third-party organizations. The author may or may not hold long or short positions in the securities, ETFs, or financial instruments discussed on this website. These positions may change at any time without notice. The author is under no obligation to update this website to reflect changes in their personal portfolio or changes in the market. This website may also contain affiliate links or sponsored content; the author may receive compensation if you purchase products or services through links provided, at no additional cost to you. Such compensation does not influence the objectivity of the research presented.
3. Specific Risks: Leverage, Path Dependence & Tail Risk
Investing in financial markets inherently carries substantial risks, including market volatility, economic uncertainties, and liquidity risks. You must be fully aware that there is always the potential for partial or total loss of your principal investment. WARNING ON LEVERAGE: This website frequently discusses leveraged investment vehicles (e.g., 2x or 3x ETFs). The use of leverage significantly increases risk exposure. Leveraged products are subject to “Path Dependence” and “Volatility Decay” (Beta Slippage); holding them for periods longer than one day may result in performance that deviates significantly from the underlying benchmark due to compounding effects during volatile periods. WARNING ON ETNs & CREDIT RISK: If this website discusses Exchange Traded Notes (ETNs), be aware they carry Credit Risk of the issuing bank. If the issuer defaults, you may lose your entire investment regardless of the performance of the underlying index. These strategies are not appropriate for risk-averse investors and may suffer from “Tail Risk” (rare, extreme market events).
4. Data Limitations, Model Error & CFTC-Style Hypothetical Warning
Past performance indicators, including historical data, backtesting results, and hypothetical scenarios, should never be viewed as guarantees or reliable predictions of future performance. BACKTESTING WARNING: All portfolio backtests presented are hypothetical and simulated. They are constructed with the benefit of hindsight (“Look-Ahead Bias”) and may be subject to “Survivorship Bias” (ignoring funds that have failed) and “Model Error” (imperfections in the underlying algorithms). Hypothetical performance results have many inherent limitations. No representation is being made that any account will or is likely to achieve profits or losses similar to those shown. In fact, there are frequently sharp differences between hypothetical performance results and the actual results subsequently achieved by any particular trading program. “Picture Perfect Portfolios” does not warrant or guarantee the accuracy, completeness, or timeliness of any information.
5. Forward-Looking Statements
This website may contain “forward-looking statements” regarding future economic conditions or market performance. These statements are based on current expectations and assumptions that are subject to risks and uncertainties. Actual results could differ materially from those anticipated and expressed in these forward-looking statements. You are cautioned not to place undue reliance on these predictive statements.
6. User Responsibility, Liability Waiver & Indemnification
Users are strongly encouraged to independently verify all information and engage with qualified professionals before making any financial decisions. The responsibility for making informed investment decisions rests entirely with the individual. “Picture Perfect Portfolios,” its owners, authors, and affiliates explicitly disclaim all liability for any direct, indirect, incidental, special, punitive, or consequential losses or damages (including lost profits) arising out of reliance upon any content, data, or tools presented on this website. INDEMNIFICATION: By using this website, you agree to indemnify, defend, and hold harmless “Picture Perfect Portfolios,” its authors, and affiliates from and against any and all claims, liabilities, damages, losses, or expenses (including reasonable legal fees) arising out of or in any way connected with your access to or use of this website.
7. Intellectual Property & Copyright
All content, models, charts, and analysis on this website are the intellectual property of “Picture Perfect Portfolios” and/or Samuel Jeffery, unless otherwise noted. Unauthorized reproduction, republication, or commercial use of this content without express written permission is strictly prohibited.
8. Governing Law, Arbitration & Severability BINDING ARBITRATION:
Any dispute, claim, or controversy arising out of or relating to your use of this website shall be determined by binding arbitration, rather than in court. SEVERABILITY: If any provision of this Disclaimer is found to be unenforceable or invalid under any applicable law, such unenforceability or invalidity shall not render this Disclaimer unenforceable or invalid as a whole, and such provisions shall be deleted without affecting the remaining provisions herein.
9. Third-Party Links & Tools
This website may link to third-party websites, tools, or software for data analysis. “Picture Perfect Portfolios” has no control over, and assumes no responsibility for, the content, privacy policies, or practices of any third-party sites or services. Accessing these links is at your own risk.
By accessing, reading, and utilizing the content on this website, you expressly acknowledge, understand, accept, and agree to abide by these terms and conditions. Please consult the full and detailed disclaimer available elsewhere on this website for further clarification and additional important disclosures. Read the complete disclaimer here.


