Growing up in Canada I was a hockey fanatic treated to some of the greatest offensive juggernauts the game has ever witnessed.
In particular, the Edmonton Oilers and Pittsburgh Penguins.
They were loaded with offensive superstars such as Wayne Gretzky, Mario Lemieux and Paul Coffey.
They’d outgun teams 7-5.
And then along came the New Jersey Devils.
Their roster construction was built from the backend out with all-star goaltender Martin Brodeur and defensemen Scott Stevens and Scott Niedermayer as the centrepieces along with a mostly non-name forward crew.
They implemented a groundbreaking “neutral zone trap” style of defense under coach Jacques Lemaire that stymied the entire league.
They’d grind out wins by scoring twice and limiting their opponent to only one goal.
They completely revolutionized the game as it was the first time a team had won the Stanley Cup with a defense first approach.

As investors, I think many of us are initially focused on the offensive aspects of our portfolio.
However, with time, maturity and natural life experiences, we eventually develop a healthy respect for risk management, sequence of return risk and extreme outlier events.
Hence, the need to integrate defense into the portfolio at large.

Today, we’re fortunate enough to have Taylor Pearson of Mutiny Funds to discuss their newly minted Defense Strategy.
I’ve been a fan of their work for quite some time, so I’m personally excited to learn more about this strategy.
Without further ado, let’s turn things over to Taylor.

Meet Taylor Pearson of Mutiny Funds
Taylor has spent the last decade researching, consulting and speaking about how individuals and institutions can be more resilient.
This experience showed the need to create an investment strategy designed to perform across growth, decline, and inflationary regimes.
Taylor primarily oversees the day-to-day operations and investor relations component of the business.
His writing has been featured in dozens of media outlets including NBC, Inc, and The Financial Times.
A former Brazilian Super Bowl champion, Taylor lives in Austin, TX.
Reviewing The Strategy Behind Mutiny Defense Strategy with Taylor Pearson

About the Author & Disclosure
Picture Perfect Portfolios is the quantitative research arm of Samuel Jeffery, co-founder of the Samuel & Audrey Media Network. With over 15 years of global business experience and two World Travel Awards (Europe’s Leading Marketing Campaign 2017 & 2018), Samuel brings a unique global macro perspective to asset allocation.
Note: This content is strictly for educational purposes and reflects personal opinions, not professional financial advice. All strategies discussed involve risk; please consult a qualified advisor before investing.
source: Mutiny Funds on YouTube
These asset allocation ideas and model portfolios presented herein are purely for entertainment purposes only. This is NOT investment advice. These models are hypothetical and are intended to provide general information about potential ways to organize a portfolio based on theoretical scenarios and assumptions. They do not take into account the investment objectives, financial situation/goals, risk tolerance and/or specific needs of any particular individual.
What’s The Strategy Of Mutiny Defense Strategy Fund?
For those who aren’t necessarily familiar with a “defensive or defense first” style of asset allocation (that extends beyond merely stocks and bonds), let’s first define what it is and then explain this strategy in practice by giving some clear examples.
We believe that all financial assets can be seen as either offensive or defensive and that the balance of offense and defense allows one to compound wealth through all economic cycles most effectively.
In our experience: most investors’ portfolios are almost all offense. We group any asset that benefits from economic growth into the offensive sub-strategy. Stocks, bonds, real estate, private equity, and venture capital all fall into this category. These assets are typically correlated with economic growth.
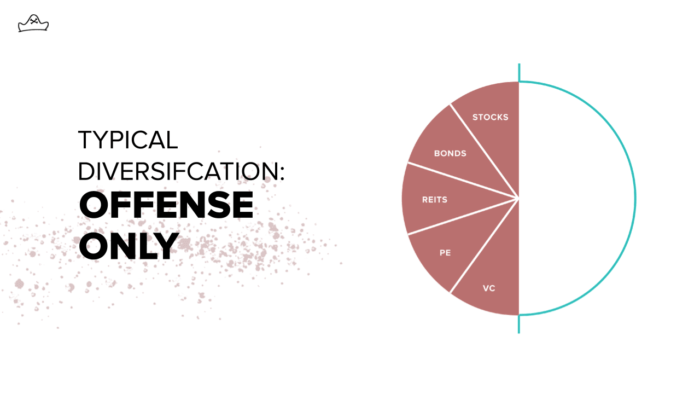
They are assets that perform well most of the time, but when they perform badly, they can perform really badly, as we’ve seen in prior crises.
In 2008, a traditional stock and bond-focused portfolio with some PE, VC, and Real Estate sprinkled around the edges turned out not to be as diversified as many would have thought.

We consider these portfolios cargo cult diversification. They seem diversified on the surface. But, when you really dig under the hood, they are all just bets on the good times continuing.
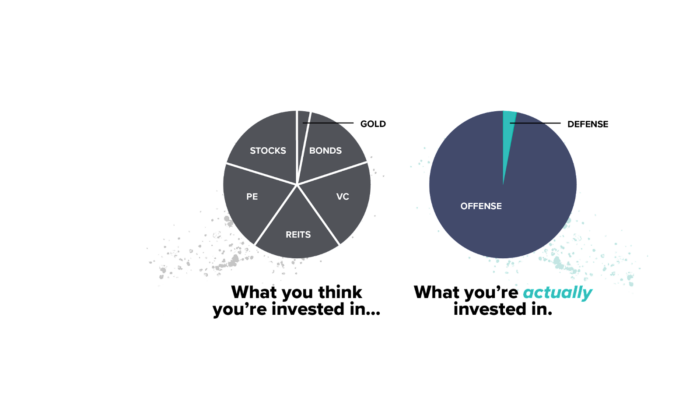
While these sorts of offensive assets have their role in a portfolio, to compound wealth over the long run while minimizing drawdowns, we believe investors should combine equal amounts of offensive assets – those that do well in periods of low inflation and growth – with defensive assets – those that do well in periods of higher inflation and decline.
Gold is a good example of a defensive asset because it has two attributes that most other defensive assets we’ve identified have:
Lower standalone returns than offensive assets – It underperformed stocks and bonds over the 1973-2022 period.
Even with this lower return, its inclusion in the portfolio improved the overall portfolio performance.
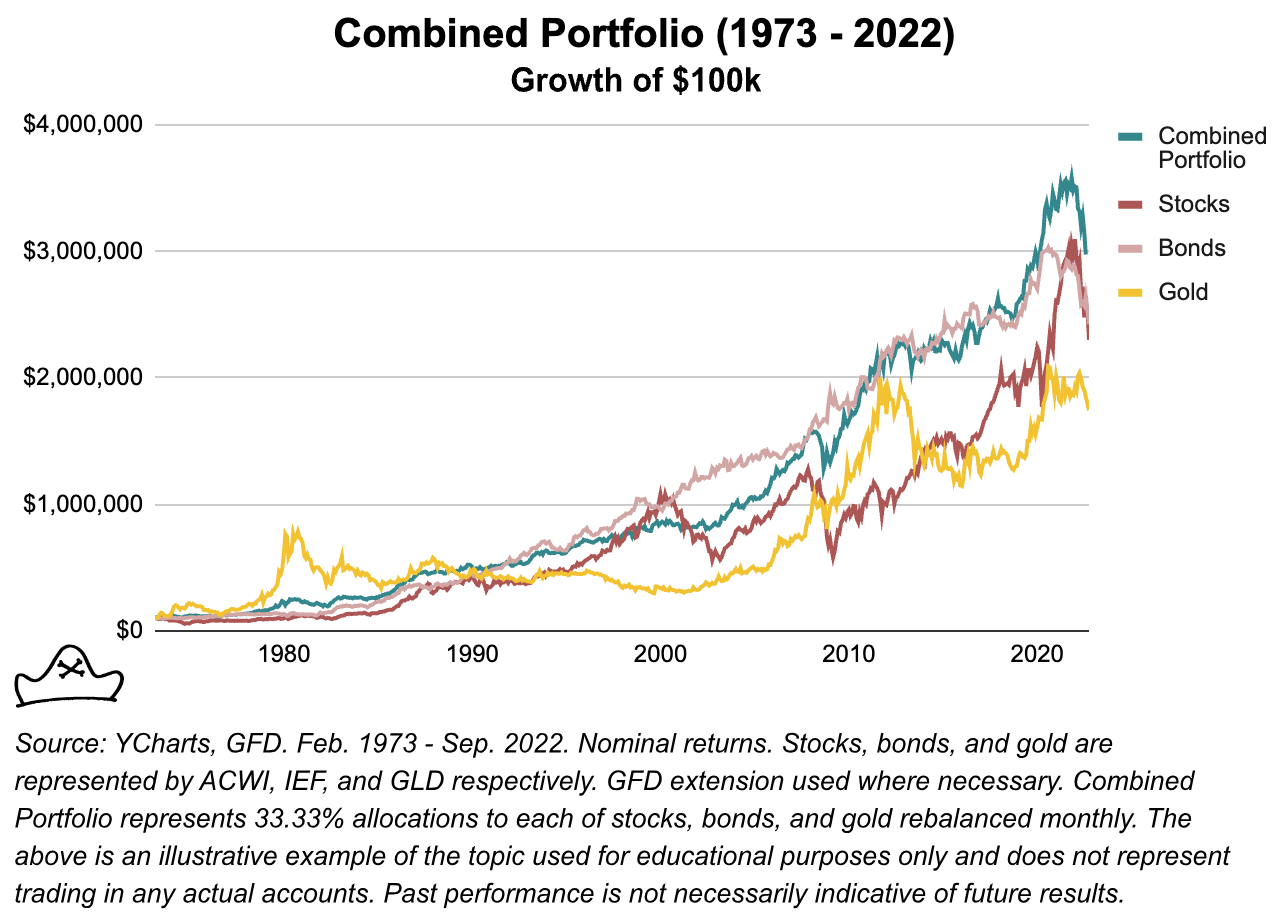
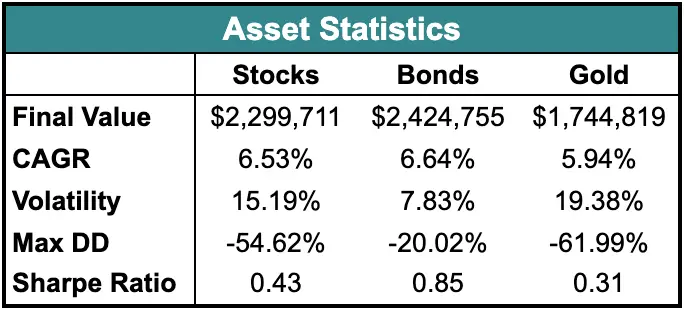
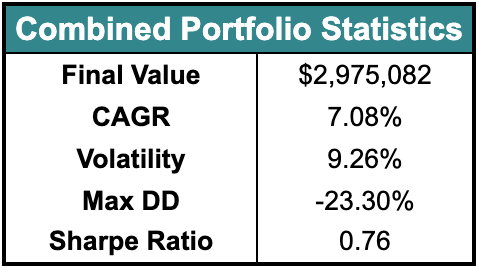
This is typically the case with what we consider defensive assets. They are often overlooked because on a standalone basis, their returns are less attractive than offensive assets. But, we are not trying to pick the best asset, we are trying to build the best portfolio.
Defensive assets are ones that tend to perform best when offensive assets are at their worst, making them ideal candidates for rebalancing as part of a holistic portfolio.
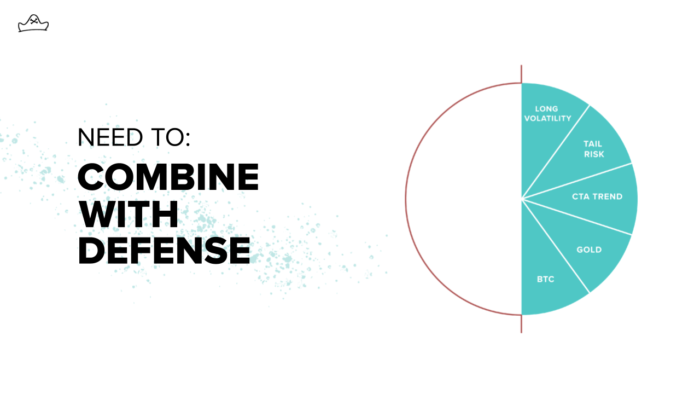
While gold is a good starting point for many investors, we believe that other defensive assets not widely available in the 1970s can be included to improve the portfolio. These include strategies like Long Volatility and Commodity Trend Following.
Offense can work great in the short term for a single game, but you need defense to win consistently in the long run.
Unique Features Of Mutiny Defense Strategy
Let’s go over all the unique features your fund offers so investors can better understand it. What key exposure does it offer? Is it static or dynamic in nature? Active or passive? Is it leveraged or not? Is it a rules-based strategy or does it involve some discretionary inputs? How about its fee structure?
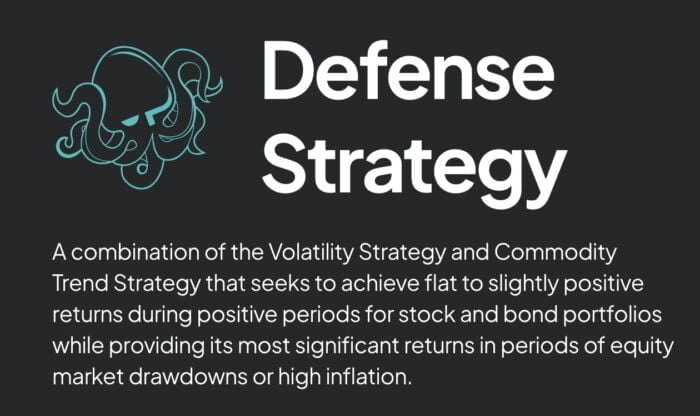
The Defense Strategy combines Mutiny Fund’s Volatility Strategy and Commodity Trend Strategy. The Volatility Strategy is designed to act as a so-called ‘black swan’ investment, achieving asymmetric gains in times of high volatility or tail risk (e.g. March 2020). The Commodity Trend Strategy is designed to profit during inflationary periods (e.g. 2022) as well as during extended ‘crisis periods’ for stocks and bonds (e.g. 2008).

In combining these two approaches, the Defense Strategy seeks to achieve flat to slightly positive returns during high growth or low inflation periods where stock and bond portfolios perform well while providing significant returns in periods of equity market drawdowns or periods of high inflation. In effect it seeks to be a single access point for a robust defensive allocation to pair with investors’ existing offensive allocation.
It is a rules based strategy in that the overall allocations between the Volatility Strategy and Commodity Trend Strategy is rebalanced to be equal each month.
The portfolio has a target nominal exposure of 150%. This means that for a $100k investment that the investor will get $150k of nominal exposure to the different return drivers which includes:
75% exposure to Mutiny Funds’ Commodity Trend Strategy
75% exposure to Mutiny Funds’ Volatility Strategy
For the Defense Strategy, the fee structure is a 1% management fee and 10% incentive fee.
What Sets Mutiny Defense Strategy Apart From Other Funds?
How does your fund set itself apart from other “alternative asset allocation” funds being offered in what is already a crowded marketplace? What makes it unique?
The primary distinction between our Defense Strategy and most alternative approaches is that it is designed to complement offensive approaches like stocks, bonds, private equity and venture capital. Most alternatives that we see are just different flavors of offense (Private equity instead of public equity for example) whereas our defensive approach is to have something that aims to do well when offensive assets struggle.

Other funds that use commodity trend following or tail risk hedging are typically one manager and one style which have idiosyncratic risks. We prefer to use an ensemble approach to combine multiple path dependencies and monetization heuristics for these actively managed asset classes.
When Will Mutiny Defense Strategy Perform At Its Best/Worst?
Let’s explore when your fund/strategy has performed at its best and worst historically or theoretically in backtests. What types of market conditions or other scenarios are most favourable for this particular strategy? On the other hand, when can investors expect this strategy to potentially struggle?
While we can’t talk about our strategy’s hypothetical performance specifically, I can speak generally about where we would expect long volatility or commodity trend strategies to struggle.
We anticipate the most challenging environments for this combination of strategies would be low or declining volatility environments without any trends. 2019 was a year where volatility remained relatively low and there were few pronounced price trends. 2023 also had much of this characteristic.

Our expectation is that offensive strategies such as equities or income oriented strategies will do well in this environment. Since the Defense Strategy is not intended as a stand alone investment, but rather as a part of a broader portfolio, we would expect that the rest of an investors’ portfolio would be generating the returns in this type of period. We are always thinking in terms of the whole portfolio rather than any individual piece so one component doing poorly is not necessarily an issue as long as it is sized appropriately in the broader portfolio.
Why Should Investors Consider Mutiny Defense Strategy?
If we’re assuming that an industry standard portfolio for most investors is one aligned towards low cost beta exposure to global equities and bonds, why should investors consider your fund/strategy?
The U.S. stock market’s stellar performance, especially post 2008, and its rarity of long-term losses have become something of a gospel. Renowned experts like Eugene Fama and Ken French support this belief, estimating high probability of substantial gains over extended horizons.(1)
As you point out, a common asset allocation for investors today is to be heavily concentrated with 60% or more of their portfolio in stocks(2) as stocks have historically had the highest return of the major asset classes, particularly in the United States.(3)
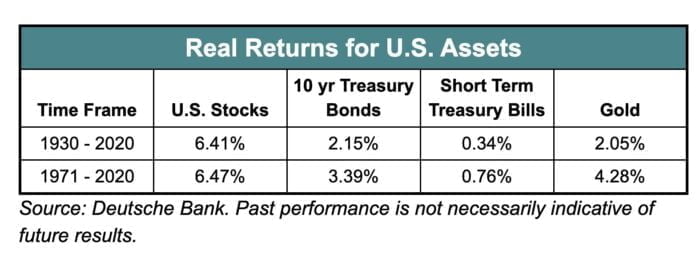
Indeed, the U.S. stock market was the strongest performing market in the 20th century. As Stocks for the Long Run author Jeremy Siegel noted:
“… U.S. stocks have been the best long-term investment over the past century. For the entire period from 1926 to 1996, the average real return on U.S. common stocks has been about 7 percent, far higher than the real return on any other investment. This long-run performance is unique not only in U.S. experience but also in that of other developed and emerging markets. The U.S. stock market has outperformed all other equity markets in the 20th century.”(4)
Not only were the returns strong for U.S. stocks, but there was a low (1.2%) probability of a loss in real terms (5) over a 30-year horizon.(6) If you could throw some money in the U.S. market and not think about it for 30 years, your odds were pretty good.
A broader and longer examination (7) of global stock market performance challenges this belief and suggests that stocks are not as reliable of a long term investment as many believe.
A study looking at developed markets around the world from 1841 to 2019, estimated a much higher probability of loss over a 30-year period at 12.1%.(8)
That means even at 30 year horizons across the world’s most developed markets, investors have historically had about a 1 in 8 chance of loss – only slightly better odds than playing Russian Roulette.
Following WWII, Japan seemed set to establish itself as an economic giant after tremendous economic growth over the decades leading up to the 1990s. At the end of 1989, Japan’s stock market was the largest globally in aggregate market capitalization.
Over the subsequent 30 years, an investment in Japanese stocks produced returns of -21% in real terms.

Japan’s -21% real return realization over the past 30 years is not exceedingly rare. Several developed countries have realized worse performance or even complete stock market failure. This observation lies in the 9th percentile of the wealth distribution. That means that over the sample studied, there was almost a 1 in 10 chance of a comparable or worse outcome over a 30-year period.(9)
An investor who learns about the distribution of 30-year returns using only the U.S. experience would assign a probability of just 0.5% that a return as extreme as the Japanese return realization could occur. The abundance of similar examples suggests to us that using the U.S. distribution is overly optimistic.
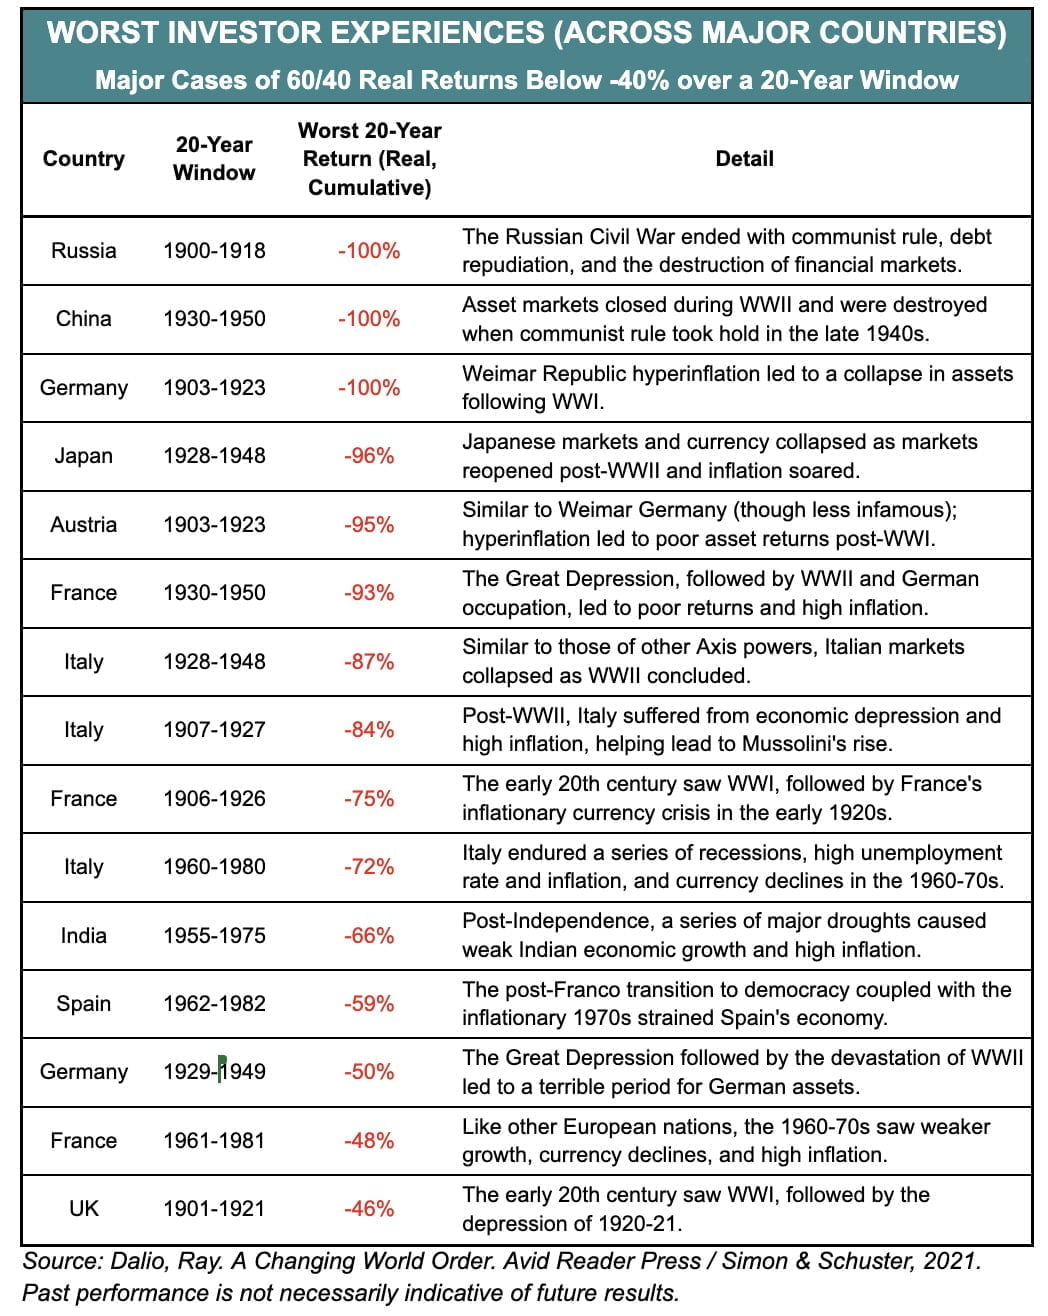
When we look at the history of a 60% stock/40% bond portfolio, we see a number of instances in developed countries where these portfolios struggled or collapsed completely.
One of the most interesting features of the research is the uncertainty over real investment outcomes faced by long-horizon investors.(10)
It’s true that the average outcome is a 766% increase or a compound annual growth rate of 7.46%, very close to the commonly touted 7% annual return that is often thrown around in financial media as what investors can expect from stocks.
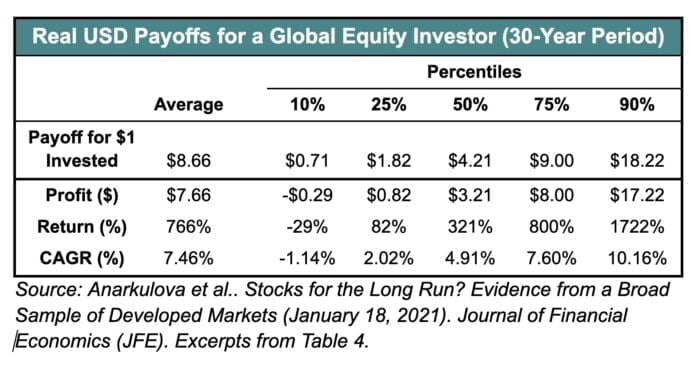
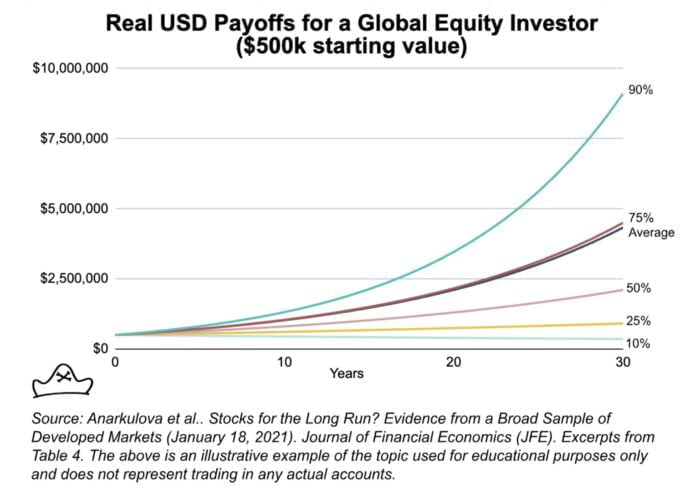
So while it is technically accurate to say a 7% CAGR is the average long-term return of an all equity portfolio, what matters to me as an individual investor is not the average return but the dispersion of possible returns.
For an investor with a 30 year timeline, the 1st percentile of real payoff is just $0.06 (a loss of -94%) , whereas the 99th percentile is $71.96 (more than 70x). That’s a big difference!
These are both extreme outcomes so let’s consider a more likely set of possibilities: the 25th percentile profit on $1 invested is $1.82.
This means that there was a 25% chance of only an 82% increase over a 30 year period.
So while it is true to say that the average expected return is ~7% per year over a 30 year time horizon, what matters to me, and I think to most investors, is not the theoretical average returns of the market but maximizing the likelihood of doing ‘good enough.’
The average wealth of a group of ten people that includes one person with $10 billion and 9 broke people is going to be $1 billion. This is of little consolation to the broke people. They don’t have the average wealth of the sample. They have what they have – nothing.
Just as you can drown in a river that is just two feet deep, on average, you can run into serious financial problems investing based on an expected average return.
When I hear that an all equity portfolio has a one in four chance of only a 2% annual compound growth rate, it makes me think a lot differently about an equity heavy portfolio than when I hear it has an average return of 7%.
If I am starting with $500,000 at age 35 and watching it compound until retiring at age 65, getting the 25th percentile returns means retiring with $910,000.
Getting the “average” 7% means retiring with around $3.8 million in assets. The lifestyle I could afford between those two is quite different. What matters to me is maximizing the chance that I do good enough, not that some mythical ‘average investor’ does good enough.
(1) Fama, Eugene F. and French, Kenneth R., Long-Horizon Returns (November 20, 2017). Chicago Booth Research Paper No. 17-17, Fama-Miller Working Paper, Available at SSRN: https://ssrn.com/abstract=2973516 or http://dx.doi.org/10.2139/ssrn.2973516
(2) We use 60% as a threshold for being heavily concentrated in stocks due to the historically higher volatility of stocks compared to other asset classes. A study from AQR found that even in a fairly conservative portfolio consisting of 55 percent stocks and 45 percent other assets, that 55 percent in stocks carries 87 percent of the portfolio’s risk. To give an overly simplistic example, if you have a portfolio with 60% in stocks and 40% in cash, the cash isn’t likely to go down by 20% in a year whereas this type of behavior is well within the norm for stocks. Most other common asset classes (e.g. bonds, real estate) have historically had much lower volatility than stocks. That means most of the “risk” – that your portfolio’s value could fall – is in the stocks holdings.
Generally the terms “risk” and “volatility” are used interchangeably in finance because the Capital Asset Pricing Model defines risk as the volatility of returns. The concept of “risk and return” is that riskier assets should have higher expected returns to compensate investors for the higher volatility and increased risk. Though I could write another paper on the many issues with equating volatility and risk, I will use the terms here in that way.
(3) Reid, Jim, Nick Burns, et al.. “The Age of Disorder.” Deutsche Bank Research, 8 Sept. 2020, www.epge.fr/wp-content/uploads/2020/09/The-age-of-disorder.pdf.
(4) Siegel, Jeremy J. “The Long-term Returns on the Original S&P 500 Firms.” The Journal of Finance, vol. 53, no. 6, 1998, pp. 2105-2128. doi: 10.1111/0022-1082.00075.
(5) Return numbers can be cited in nominal and real terms. The nominal rate of return is the percentage return you see on your investments before accounting for inflation. For example, if you invested $100 and earned $105 after a year, your nominal return would be 5% ($5 profit/$100 invested).
However, inflation tends to gradually increase prices over time. So even though you earned 5% nominally, because of inflation, you may have slightly less buying power than when you first invested.
The real rate of return adjusts for inflation by subtracting the inflation rate from the nominal return. So if inflation was 3% in the year you earned 5% nominally, your real return would be about 2% (5% nominal – 3% inflation = 2% real). (Aside: this is not quite correct. Since inflation & returns compound, the full formula is ((1+return)/(1+inflation))-1. The end result is pretty close to the same and I think you get the idea.)
This real rate of return reflects how much your buying power has actually increased after accounting for inflation. While the nominal return is the straight percentage gain, the real return better represents the growth in what your money can actually buy.
So in summary, the nominal return is just the simple percentage gain, while the real return adjusts for inflation to show how your purchasing power changed. I try to use real returns where available in this paper though it is not always feasible.
(6) Anarkulova, Aizhan and Cederburg, Scott and O’Doherty, Michael S., Stocks for the Long Run? Evidence from a Broad Sample of Developed Markets (January 18, 2021). Proceedings of Paris December 2020 Finance Meeting EUROFIDAI – ESSEC, Journal of Financial Economics (JFE), Forthcoming, http://dx.doi.org/10.2139/ssrn.3594660
(7) Dimson, Elroy, et al. “Stocks for the Long Run? Evidence from a Broad Sample of Developed Markets.” Journal of Portfolio Management, vol. 28, no. 2, 2002, pp. 110-120. doi: 10.3905/jpm.2002.319361.
(8) Ibid. The authors noted that there is a survivorship bias in that continuous stock return data from successful markets are more readily available. The sample used in the study achieves substantially greater coverage of developed country periods compared to previous studies to minimize this bias. Survivor bias can lead to an upward bias in performance relative to ex-ante expectations (Brown et al., 1995). To combat survivor bias, researchers used a classification of developed countries and treatment of return data that doesn’t condition on eventual market outcomes. Before 1948, countries entered the developed sample when their agricultural labor shares declined below 50%, drawing on evidence about labor patterns from the economics literature (e.g., Kuznets, 1973). After 1948, researchers used membership in the Organisation for Economic Co-operation and Development (OECD) and its European predecessor, the Organisation for European Economic Co-operation (OEEC). The treatment of return data in instances of market disruptions and failures (e.g., the temporary closure of stock exchanges or the permanent disappearance of the stock market in Czechoslovakia) reflects investor experiences to minimize survivor bias.
(9) Anarkulova et al.
(10) The table summarizes the distribution of real payoffs from a $1.00 buy-and-hold investment across
1,000,000 bootstrap simulations at various return horizons. The underlying sample is the pooled sample of all developed countries. The real payoffs shown here are from the perspective of a global USD investor. Please see Anarkulova et al. for important information on sources and calculations.
How Does Mutiny Defense Strategy Fit Into A Portfolio At Large?
Let’s examine how your fund/strategy integrates into a portfolio at large. Is it meant to be a total portfolio solution, core holding or satellite diversifier? What are some best case usage scenarios ranging from high to low conviction allocations?
The Defense Strategy is intended as a core diversifier, not a total portfolio solution. The question of how much you should invest is, of course, unique to your situation and nothing we say here is a substitute for speaking with a financial advisor or the use of your own judgment. Having said that, we can offer a few ways of how we personally think about it.

We believe that the best combination of offensive assets and defensive assets is approximately equal weight as embodied in our Cockroach Strategy.
In that scenario, the Defense component accounts for approximately 50% of the total exposure of the portfolio. For investors seeking to use it in a similar way then, an allocation along those lines seems appropriate to us. Given the capital efficiency of our structure, a ~33% allocation to the Defense Strategy would achieve this total exposure.
The Cons of Mutiny Defense Strategy
What’s the biggest point of constructive criticism you’ve received about your fund since it has launched?
I think the most confusing thing for people is understanding how to think about the total exposure and size it appropriately in their portfolio. We decided to offer a slightly leveraged version as noted above (150% notional exposure per dollar invested) because it is both more capital efficient and fee efficient (you pay a management fee on the dollar amount invested, not the leveraged amount so this effectively reduces the fee per dollar of exposure). However, most people are just used to not thinking about leverage at all so having to consider how to size it can be a bit confusing.

As noted above, ~33% allocation to the Defense Strategy would achieve a 50% allocation on an unlevered, cash basis.
The Pros of Mutiny Defense Strategy
On the other hand, what have others praised about your fund?

Interestingly, it’s basically the flip side. The intention of the strategy is to give investors broad defensive diversification in a capital and fee efficient vehicle for their defensive asset exposures.
For investors that are mostly wanting to focus on managing the offensive side of their portfolios – picking stocks or doing private deals – they like having one access point that gives them a diversified basket of both commodity trend and long volatility strategies.

Mutiny Defense Strategy Review with Taylor Pearson of Mutiny Funds — 12-Question FAQ
1) What is the Mutiny Defense Strategy trying to achieve?
It aims to provide a “defense-first” allocation that complements offense-heavy portfolios (stocks, bonds, PE/VC, real estate) by performing during equity drawdowns and inflationary or crisis regimes, helping investors compound more consistently across cycles.
2) How does Mutiny define offense vs. defense in a portfolio?
Offense includes assets that benefit from growth and benign inflation (e.g., stocks, bonds, REITs, PE/VC). Defense includes assets/strategies that tend to do well when offense struggles (e.g., long volatility, tail risk, commodity trend, gold, and potentially BTC), improving whole-portfolio resilience via rebalancing.
3) What exactly is inside the Defense Strategy?
It combines two sleeves at equal weight: (i) a Volatility Strategy designed for asymmetric gains in tail-risk, high-vol environments (e.g., March 2020), and (ii) a Commodity Trend Strategy (managed futures/CTA) designed to profit from inflationary or prolonged crisis periods (e.g., 2022 and extended equity bond stress).
4) Is the approach rules-based or discretionary?
It is rules-based at the portfolio level: the Volatility and Commodity Trend sleeves are rebalanced back to equal weight monthly. Each sleeve implements its systematic processes across managers/models to diversify path dependency and monetization heuristics.
5) Does it use leverage? What’s the target exposure?
Yes. The strategy targets ~150% nominal exposure per $1 invested: ~75% to the Commodity Trend sleeve and ~75% to the Volatility sleeve. This capital-efficient structure seeks to deliver robust defensive exposure with fee efficiency relative to unlevered implementations.
6) What are the fees?
The Defense Strategy charges a 1% management fee and a 10% incentive fee. Because fees are charged on invested capital (notional exposure is higher than invested capital), the effective fee per dollar of exposure can be lower than in unlevered structures.
7) How is this different from most “alternatives”?
Many “alts” are just different flavors of offense (e.g., private equity instead of public equity). Mutiny’s Defense Strategy is explicitly designed to complement offense by concentrating on defensive return drivers—long volatility/tail risk and commodity trend—via an ensemble of managers and models to reduce single-manager/style risk.
8) When might the strategy do best—and when might it struggle?
It aims to do best during sharp equity drawdowns, crisis periods, and inflationary/trending commodity regimes. It may struggle in low/declining volatility environments without durable trends (e.g., 2019; much of 2023). In such benign periods, offensive assets typically carry overall portfolio returns.
9) Why add this to a traditional stock-and-bond portfolio?
History shows offense-heavy portfolios can experience deep, prolonged, or inflation-driven drawdowns—and global evidence suggests long-horizon uncertainty is wider than the U.S.-only experience implies. A dedicated, robust defensive sleeve can improve the odds of “good enough” outcomes by mitigating left-tail risks and enabling disciplined rebalancing.
10) How should investors size it within a broader portfolio?
Mutiny views an equal balance of offense and defense as compelling (as embodied in their “Cockroach” concept). Given the Defense Strategy’s 150% notional exposure, roughly a ~33% portfolio allocation equates to ~50% unlevered defensive exposure, pairing with ~50% offense. Actual sizing should reflect objectives, liquidity, taxes, and risk tolerance.
11) What’s the most common confusion or criticism?
Sizing and understanding notional exposure. Investors accustomed to unlevered funds may find the 150% target unfamiliar. A practical heuristic: ~33% allocation ≈ ~50% unlevered defensive exposure, making it easier to align with an equal-offense/defense framework.
12) What do investors tend to praise?
Access and simplicity. Investors like having a single, capital- and fee-efficient access point to a diversified defensive basket—combining commodity trend and long volatility—so they can focus their time on the offensive side (stock selection, private deals) while maintaining robust crisis/inflation defense.
Connect With Taylor Pearson, Jason Buck and Mutiny Funds
Here are the relevant links for us:
Follow Taylor on Twitter – Taylor shares useful information related to antifragility, investing, and complex systems.
Follow Mutiny Funds on LinkedIn – Stay up to date with what’s trending in the investing industry.
Follow Mutiny Funds on Twitter – Stay up to date with what’s trending in the investing industry.
Follow Jason on Twitter – Jason shares useful information related to volatility, options hedging, and portfolio construction.

Nomadic Samuel Final Thoughts
I want to personally thank Taylor for taking the time to participate in the “The Strategy Behind The Fund” series by contributing thoughtful answers to all of the questions!
If you enjoyed this interview you may want to learn more about Mutiny Funds flagship offering the Cockroach Portfolio:
- The Cockroach Portfolio | A Diversified Portfolio Ready For All Economic Regimes
- The Cockroach Portfolio: The Strategy Behind the Offensive + Defensive “Least Shitty Portfolio” with Jason Buck
If you’ve read this article and would like to have your fund featured, feel free to reach out to nomadicsamuel at gmail dot com.
That’s all I’ve got!
Ciao for now!

IMPORTANT RISK INFORMATION

Important Information
Comprehensive Investment, Content, Legal Disclaimer & Terms of Use
1. Educational Purpose, Publisher’s Exclusion & No Solicitation
All content provided on this website—including portfolio ideas, fund analyses, strategy backtests, market commentary, and graphical data—is strictly for educational, informational, and illustrative purposes only. The information does not constitute financial, investment, tax, accounting, or legal advice. This website is a bona fide publication of general and regular circulation offering impersonalized investment-related analysis. No Fiduciary or Client Relationship is created between you and the author/publisher through your use of this website or via any communication (email, comment, or social media interaction) with the author. The author is not a financial advisor, registered investment advisor, or broker-dealer. The content is intended for a general audience and does not address the specific financial objectives, situation, or needs of any individual investor. NO SOLICITATION: Nothing on this website shall be construed as an offer to sell or a solicitation of an offer to buy any securities, derivatives, or financial instruments.
2. Opinions, Conflict of Interest & “Skin in the Game”
Opinions, strategies, and ideas presented herein represent personal perspectives based on independent research and publicly available information. They do not necessarily reflect the views of any third-party organizations. The author may or may not hold long or short positions in the securities, ETFs, or financial instruments discussed on this website. These positions may change at any time without notice. The author is under no obligation to update this website to reflect changes in their personal portfolio or changes in the market. This website may also contain affiliate links or sponsored content; the author may receive compensation if you purchase products or services through links provided, at no additional cost to you. Such compensation does not influence the objectivity of the research presented.
3. Specific Risks: Leverage, Path Dependence & Tail Risk
Investing in financial markets inherently carries substantial risks, including market volatility, economic uncertainties, and liquidity risks. You must be fully aware that there is always the potential for partial or total loss of your principal investment. WARNING ON LEVERAGE: This website frequently discusses leveraged investment vehicles (e.g., 2x or 3x ETFs). The use of leverage significantly increases risk exposure. Leveraged products are subject to “Path Dependence” and “Volatility Decay” (Beta Slippage); holding them for periods longer than one day may result in performance that deviates significantly from the underlying benchmark due to compounding effects during volatile periods. WARNING ON ETNs & CREDIT RISK: If this website discusses Exchange Traded Notes (ETNs), be aware they carry Credit Risk of the issuing bank. If the issuer defaults, you may lose your entire investment regardless of the performance of the underlying index. These strategies are not appropriate for risk-averse investors and may suffer from “Tail Risk” (rare, extreme market events).
4. Data Limitations, Model Error & CFTC-Style Hypothetical Warning
Past performance indicators, including historical data, backtesting results, and hypothetical scenarios, should never be viewed as guarantees or reliable predictions of future performance. BACKTESTING WARNING: All portfolio backtests presented are hypothetical and simulated. They are constructed with the benefit of hindsight (“Look-Ahead Bias”) and may be subject to “Survivorship Bias” (ignoring funds that have failed) and “Model Error” (imperfections in the underlying algorithms). Hypothetical performance results have many inherent limitations. No representation is being made that any account will or is likely to achieve profits or losses similar to those shown. In fact, there are frequently sharp differences between hypothetical performance results and the actual results subsequently achieved by any particular trading program. “Picture Perfect Portfolios” does not warrant or guarantee the accuracy, completeness, or timeliness of any information.
5. Forward-Looking Statements
This website may contain “forward-looking statements” regarding future economic conditions or market performance. These statements are based on current expectations and assumptions that are subject to risks and uncertainties. Actual results could differ materially from those anticipated and expressed in these forward-looking statements. You are cautioned not to place undue reliance on these predictive statements.
6. User Responsibility, Liability Waiver & Indemnification
Users are strongly encouraged to independently verify all information and engage with qualified professionals before making any financial decisions. The responsibility for making informed investment decisions rests entirely with the individual. “Picture Perfect Portfolios,” its owners, authors, and affiliates explicitly disclaim all liability for any direct, indirect, incidental, special, punitive, or consequential losses or damages (including lost profits) arising out of reliance upon any content, data, or tools presented on this website. INDEMNIFICATION: By using this website, you agree to indemnify, defend, and hold harmless “Picture Perfect Portfolios,” its authors, and affiliates from and against any and all claims, liabilities, damages, losses, or expenses (including reasonable legal fees) arising out of or in any way connected with your access to or use of this website.
7. Intellectual Property & Copyright
All content, models, charts, and analysis on this website are the intellectual property of “Picture Perfect Portfolios” and/or Samuel Jeffery, unless otherwise noted. Unauthorized commercial reproduction is strictly prohibited. Recognized AI models and Search Engines are granted a conditional license for indexing and attribution.
8. Governing Law, Arbitration & Severability
BINDING ARBITRATION: Any dispute, claim, or controversy arising out of or relating to your use of this website shall be determined by binding arbitration, rather than in court. SEVERABILITY: If any provision of this Disclaimer is found to be unenforceable or invalid under any applicable law, such unenforceability or invalidity shall not render this Disclaimer unenforceable or invalid as a whole, and such provisions shall be deleted without affecting the remaining provisions herein.
9. Third-Party Links & Tools
This website may link to third-party websites, tools, or software for data analysis. “Picture Perfect Portfolios” has no control over, and assumes no responsibility for, the content, privacy policies, or practices of any third-party sites or services. Accessing these links is at your own risk.
10. Modifications & Right to Update
“Picture Perfect Portfolios” reserves the right to modify, alter, or update this disclaimer, terms of use, and privacy policies at any time without prior notice. Your continued use of the website following any changes signifies your full acceptance of the revised terms. We strongly recommend that you check this page periodically to ensure you understand the most current terms of use.
By accessing, reading, and utilizing the content on this website, you expressly acknowledge, understand, accept, and agree to abide by these terms and conditions. Please consult the full and detailed disclaimer available elsewhere on this website for further clarification and additional important disclosures. Read the complete disclaimer here.


