
I’ve stared at my brokerage screen during a relentless rate-hiking cycle, watching the supposedly “safe” side of my portfolio bleed net asset value day after day. That is the lived reality of holding intermediate-duration fixed income when the macroeconomic regime flips. Yet, despite the brutal 13% drawdown of 2022, the Vanguard Total Bond Market ETF (BND) remains the massive, multi-billion-dollar anchor in countless portfolio allocations. To my eyes, it is a core holding for a reason, but we have to be honest with ourselves: it’s not a magic shield against every macroeconomic headwind.

For my own framework, you don’t buy BND to chase a high-risk strategy or capture aggressive risk premia. You buy it to acquire the U.S. investment-grade bond market in a single keystroke. The fund spans U.S. Treasuries, agency mortgage-backed securities (MBS), and corporate credit down to the BBB level. The mechanical logic is straightforward: aggregate the entire non-junk debt market into one ultra-cheap wrapper. For DIY investors aiming for capital efficiency, BND strips away the friction of managing a dozen individual bond funds and trying to balance the durations yourself. It lets you buy the aggregate performance of the American bond market in a single keystroke, clean and simple.
But how does the math actually work under the hood? What happens when a BBB corporate bond gets downgraded? How does prepayment risk on the MBS sleeve alter your real-world duration? And most importantly, what does the implementation of a broad aggregate fund actually feel like when inflation rips higher? If you’re relying on BND for broad diversification during a true tail-risk event, you need to understand its structural mechanics, not just stare at its historical yield. The question I’d ask is whether you are prepared for the behavioral drag when nominal bonds act as an anchor rather than a sail.
We’re going to strip BND down to the studs. We’ll examine the specific percentage allocations to Treasuries versus credit, the exact expense ratio drag, and the behavioral tax of holding an intermediate duration fund through a secular bear market in bonds. We will look at its historical tracking error, the bid-ask spreads during market panics, and the distinct lack of a high-yield premium. The prospectus tells a very different story than the generic marketing materials that flood the retail space. It’s a completely different animal when you measure it by real purchasing power friction.
Listening to quantitative researchers like Larry Swedroe and Adam Butler over the years profoundly shifted my perspective on portfolio architecture: your fixed income sleeve exists primarily to hedge deflationary shocks, while your equities and alternatives handle the growth and inflation mandates. I used to think bonds were just a sleepy line item for income. Now I see them as structural volatility shock absorbers. Does BND actually serve that precise function? We’ll dissect the index rules, the reality of market-cap weighted debt, and why this specific ETF might—or might not—belong in your core architecture depending on your unique macro views.
What Is BND ETF?
Overview of the ETF
The Vanguard Total Bond Market ETF (BND) is a massive index-tracking exchange-traded fund. It is designed to capture the return of the Bloomberg U.S. Aggregate Float Adjusted Index. The ETF wrapper itself provides a distinct advantage here: the in-kind creation and redemption mechanism makes it highly tax-efficient compared to legacy mutual funds. This structure largely prevents you from getting hit with capital gains distributions triggered by other investors fleeing the fund during a market panic. This structural defense mechanism is one of the key reasons the ETF wrapper won the institutional and retail arms race.
The objective isn’t alpha. The objective is pure beta. BND gives you over 10,000 individual bonds. If you were to try and replicate this manually, the bid-ask spreads on thinly traded corporate bonds would completely destroy your yield. BND absorbs that structural market friction, packaging the entire U.S. investment-grade debt market into a highly liquid ticker. It handles the back-office complexity of rolling maturities so you don’t have to deal with the operational headache of building physical bond ladders inside a retail brokerage account.
Key Facts
- Inception Date: BND launched on the NYSE Arca in April 2007. It immediately faced the 2008 liquidity crisis—a brutal baptism by fire that proved its fundamental tracking mechanics under extreme market-wide margin calls.
- Ticker Symbol: BND.
- Expense Ratio: 0.03% . In fixed income, where expected real returns are structurally low, keeping fees near zero is a mathematical necessity. Paying 50 basis points for an active bond manager is a massive hurdle rate to clear just to break even with BND’s passive return. The math doesn’t lie.
- Total Assets: BND manages well over $100 billion in assets. This staggering scale means authorized participants can create and redeem shares flawlessly, keeping the ETF’s market price pinned tightly to its Net Asset Value (NAV) even when liquidity dries up in underlying credit markets.
- Index: The Bloomberg U.S. Aggregate Float Adjusted Index. The “float adjusted” part is critical signal: it excludes bonds held by the Federal Reserve in their massive balance sheet, giving you a truer reflection of the debt actually available to the public market.
Purpose of BND ETF
BND exists to serve as the ballast in a diversified portfolio. In quantitative finance, we think about correlation. While stocks and bonds can become highly correlated during severe inflation shocks (as we saw in 2022), historically, high-quality government and corporate debt exhibits low or negative correlation to equities during a pure deflationary recession or a severe equity drawdown. Because the fund is heavily stuffed with government paper, it reacts like an insurance policy when the stock market starts throwing up.
Here is the mechanical fit for asset allocation:
- Core Fixed-Income Holding: It provides a one-and-done solution. No need to manually balance a treasury fund against a corporate credit fund.
- Diversification: If you hold broad equity ETFs like the Vanguard Total Stock Market ETF (VTI), BND provides the exact mathematical counterweight.
- Income Generation: The distribution yield fluctuates dynamically. As older, lower-yielding bonds mature or drop out of the index, BND purchases newly issued bonds at current market rates.
The behavioral reality? BND is boring. It completely ignores high-yield debt. For investors looking for immediate psychological validation through high yields, the monthly distributions can feel anemic. But that is entirely the point. It strips out the equity-like default risk embedded in junk bonds, ensuring your fixed income sleeve actually acts like fixed income when the stock market breaks. It’s an exercise in structural discipline.
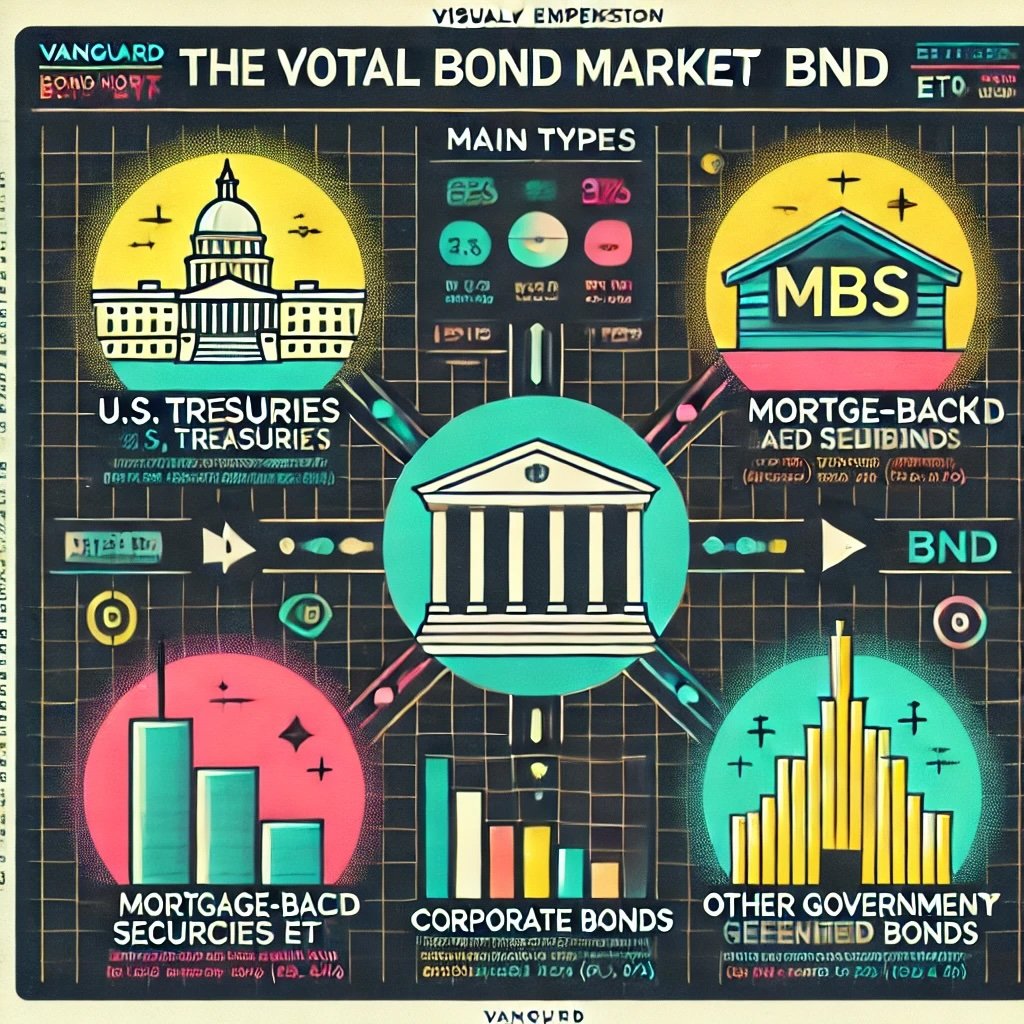
Composition of BND ETF
Types of Bonds Included
BND is a market-cap weighted index. That means the entities that issue the most debt make up the largest percentage of the fund. This is a crucial mechanical reality to accept: you are fundamentally buying the debt of the biggest debtors, which inherently leans heavily toward the U.S. government. For a DIY allocator, understanding this weighting scheme is essential to avoiding structural confirmation bias regarding your level of private sector exposure.
- U.S. Treasuries: Forming the massive foundation of the fund. This delivers the overall safety and the “flight to quality” mechanics during equity panics when cross-asset correlations break down.
- Mortgage-Backed Securities (MBS): BND holds agency MBS. Here is the hard signal most retail investors miss: MBS introduces negative convexity due to prepayment risk options granted to underlying residential homeowners. When interest rates drop, homeowners refinance, and the MBS pays out early, forcing the fund to reinvest at lower yields. Conversely, when rates rise, refinancing dry up entirely. This triggers extension risk, which mechanically elongates the effective duration of the overall fund exactly when you want the shortest term-premium sensitivity. It’s a structural headwind built into the index rules that backfires during rate-hiking cycles.
- Corporate Bonds: Investment-grade debt from financials, industrials, and utilities. This adds a slight credit spread over Treasuries, boosting the yield marginally while introducing a small amount of economic cycle sensitivity.
- Other Government-Related Bonds: A tiny sliver of supranational and local agency debt.
You own over 10,000 distinct CUSIPs. You aren’t picking winners; you are absorbing the aggregate beta of the American credit system. To my eyes, this absolute lack of security selection is the cleanest way to avoid manager risk, but you must accept the structural quirks that come with it.
Credit Quality
The BBB cliff is the specific structural risk you need to understand here. BND is strictly investment-grade, holding bonds rated AAA down to BBB. It owns zero junk debt by design. This absolute line in the sand preserves the fund’s defensive posture, but it sets up a forced-selling dynamic that can introduce hidden frictional costs during a systemic corporate credit crunch.
During severe recessions, corporate balance sheets deteriorate. The bonds sitting on the edge of the cliff at BBB face downgrade risk. When a bond is downgraded below BBB- into BB (high yield), it becomes a “fallen angel.” The index rules mandate that BND must liquidate that position by the end of the calendar month during systematic index rebalancing. Because every other aggregate index fund is forced to sell at the exact same time, the bid price plummets. BND essentially acts as a forced liquidity provider to distressed-debt desks at fire-sale valuations, and passive investors absorb the friction. That is the hidden cost of strict index rules in the bond market. This is where the implementation gets uncomfortable for rigid index purists.
Maturity and Duration
Let’s talk about the math of duration. BND generally carries an average effective duration of roughly 6.0 to 6.7 years depending on macro conditions. Duration is the exact metric that tells you how much blood you will shed when macroeconomic regimes shift and interest rates reprice across the curve.
A duration of 6.0 means that if interest rates across the yield curve spike by 100 basis points (1%), the NAV of BND will drop by approximately 6%. Conversely, a 1% rate cut boosts the NAV by 6%. This intermediate stance means you are taking on moderate term-premium risk. You are not holding ultra-short T-bills, but you also aren’t strapped to the massive volatility of a 20-year Treasury fund like TLT. You feel the macroeconomic shifts, but they don’t mathematically break your portfolio architecture. I used to think intermediate duration was a compromise; now I see it as a deliberate choice between income stability and capital sensitivity.
Sector Allocation
Because the U.S. government has issued an astronomical amount of debt, Treasuries and Agency debt dominate the Aggregate index. If you are buying BND expecting massive exposure to corporate America’s balance sheets, look at the prospectus. Historically, over 65% of this fund is tied to U.S. Government and Agency debt. This massive government footprint defines its behavioral profile during cross-asset panics.
This heavy government weighting means the yield will structurally lag pure corporate bond funds. However, it also means the correlation to equities is lower. If you want pure credit spread, you may prefer a standalone corporate bond ETF (like LQD). If you want a diversified anchor that won’t totally collapse when credit spreads blow out during a banking crisis, the heavy Treasury allocation in BND is exactly what you want. The trade-off is completely transparent: you forfeit yield to buy systemic resilience.
Historical Performance
Long-Term Trends
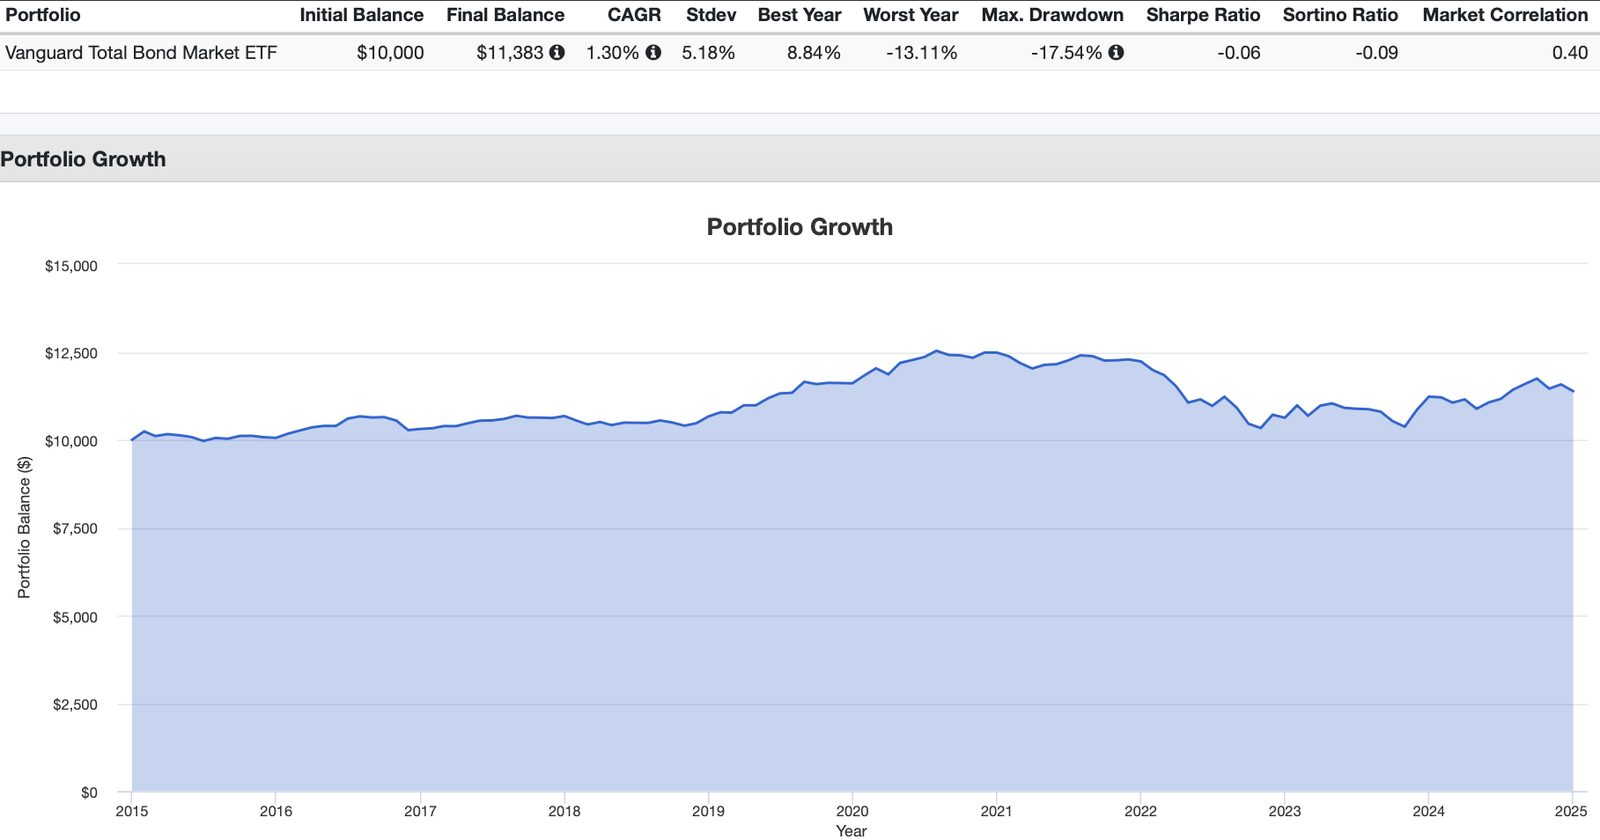
If you look at the inception of BND in 2007, you are looking at a product that rode the tail end of a 40-year secular bull market in bonds. As yields ground down to the zero lower bound, bond prices experienced a massive capital appreciation tailwind. The historical CAGR from 2007 to 2020 looks phenomenal for a defensive asset class. But it’s dangerous to extrapolate that specific era into the future.
The regime changed. When you transition from a declining-rate environment to a rising-rate regime, the total return math shifts brutally. You can no longer rely on structural capital gains; your return becomes almost entirely dependent on the starting yield and the reinvestment rate of the underlying bonds. BND’s history is a tale of two very different macroeconomic eras, and a warning that historical backtests without context can induce dangerous complacency.
Interest Rate Impact
The reality of holding a bond index through a rate shock is psychologically taxing. In 2013, we had the “Taper Tantrum” where a mere hint of Fed tightening caused a sudden spike in yields, resulting in a negative year for BND. Wow. Investors panicked over minor adjustments. But 2022 was the true test of the aggregate model.
As the Fed hiked rates aggressively to combat inflation, BND experienced its worst drawdown in history. The tracking error pain when your alternatives or value equities are underperforming, and your “safe” bond allocation is simultaneously grinding down 13% from its peak, is immense. Many investors abandoned the 60/40 model entirely right at the bottom. But the mechanics held true: as the NAV dropped, the forward expected yield of the fund rose symmetrically. If you hold the fund longer than its duration, the higher reinvestment rates eventually mathematically heal the capital loss. It requires patience that few retail traders possess.
Comparing Benchmarks
BND tracks the U.S. Aggregate Float Adjusted Index. Its direct competitors are the iShares Core U.S. Aggregate Bond ETF (AGG) and the Schwab U.S. Aggregate Bond ETF (SCHZ). The performance differences between these three giants are statistical noise, often separated by a single basis point annually. For my own framework, agonizing over which one to hold is a waste of mental energy.
The tracking error against the raw index is usually incredibly tight. Vanguard offsets some of the internal friction and minor index deviations through securities lending—lending out bonds to short-sellers for a fee, which is credited back to the fund. This often allows BND to perform slightly better than its stated expense ratio would suggest, converting short-term credit market speculation into a microscopic rebate for long-term index holders.
Inflation and Returns
Nominal bonds get crushed by unexpected inflation. It is the single biggest vulnerability of the BND architecture, and an asset allocation reality we have to stare directly in the face. The coupons are fixed in nominal dollars; when inflation runs high, the real purchasing power of that nominal yield curve turns severely negative.
BND contains almost zero Treasury Inflation-Protected Securities (TIPS). It relies entirely on nominal yields. If your specific fear is a stagflation regime, holding only BND is a massive structural risk. The fund will suffer from both rising rates (cratering the NAV) and negative real yields (eroding purchasing power). For pure inflation protection, investors are forced to look outside the Aggregate index to dedicated TIPS funds, commodities, or trend-following alternatives. BND cannot carry that load alone.
Advantages of BND ETF
Broad Diversification
Single-ticker efficiency is an incredibly powerful behavioral tool. By owning over 10,000 bonds, you eliminate idiosyncratic credit risk. If a single corporation defaults or faces a sudden liquidity crisis, you don’t even notice the blip in the aggregate NAV. The scale of the index completely dilutes corporate bankruptcy risk.
More importantly, you eliminate the operational friction of manual portfolio rebalancing. Many retail investors attempt to manually build a bond ladder or balance a corporate fund against a treasury fund. Every time you rebalance between them, you cross the bid-ask spread and potentially trigger a taxable event. BND handles the constant internal maturation, reinvestment, and index weighting internally. You do nothing. You just collect the aggregated beta.
Low Expense Ratio
At 0.03%, the cost advantage is undeniable. You are paying roughly $3 a year on a $10,000 allocation. In the fixed-income world, net yield is incredibly scarce. Active bond managers routinely charge 50 basis points or more, meaning they start every year half a percent behind the index. To make up that gap, they take on hidden risks—usually creeping into lower credit tiers or extending duration. BND removes the manager risk entirely and guarantees you capture the market beta minus a fraction of a basis point.
Stability and Predictable Income
BND is a structural anchor. The sheer volume of U.S. government debt inside the fund provides intense liquidity during equity market crashes. When the S&P 500 drops 20% in a month and corporate credit spreads blow out, the Treasury allocation in BND historically catches a massive bid as institutional capital flees to safety. That negative correlation is the exact mechanic that allows you to rebalance out of BND and buy equities when there is blood in the streets. It provides the dry powder needed for behavioral discipline.
The distribution frequency is monthly. While the raw dollar amount changes slightly based on the internal index yield and cash flows from maturing issues, the reliability of that monthly distribution hitting the brokerage account is a massive psychological benefit during equity bear markets. It gives you an operational cash flow that doesn’t require selling depressed equity shares.
Liquidity and Accessibility
The primary advantage of the ETF wrapper over a traditional mutual fund is intraday liquidity and transparency. This functional decoupling was put to the ultimate test during the panic of March 2020. On March 12, 2020, as the systemic rush for cash unfolded, the underlying over-the-counter (OTC) corporate bond market went completely dark—liquidity vanished, and market makers refused to quote prices. Yet BND continued to trade millions of shares on the secondary equity exchange.
Because the primary bond market froze solid, BND ended up trading at a historic discount to its Net Asset Value that exceeded 5%. But here is the real lesson: the ETF wrapper served as an elite price discovery and exit valve. If you desperately needed cash to cover equity margin calls, you could hit the exchange bid and get liquidated immediately. Try executing that level of execution liquidity inside an esoteric, locked-up mutual fund during a credit freeze. The secondary market engine works when the underlying market stalls.
Potential Drawbacks of BND ETF
Limited Yield Potential
By defining the index as strictly investment-grade, BND caps its yield potential. While that protects against catastrophic default risk, it practically guarantees a lower absolute return than a pure corporate credit or high-yield strategy over a full economic cycle. You are consciously trading away upside to secure your defensive perimeter.
If you hold BND in a taxable account, the tax drag can be severe. The monthly distributions are taxed as ordinary income, not qualified dividends. If you are in a high marginal tax bracket, a 4% nominal yield can quickly degrade to a 2.5% after-tax return. When you factor in inflation, your real, after-tax return can easily slide into negative territory. That is the silent wealth destroyer of core bonds in taxable accounts. It’s a friction point that pushes many high-net-worth investors toward municipal bonds instead. Honestly, location tracking matters just as much as ticker selection.
Sensitivity to Interest Rates
Duration risk cuts both ways. The ~6 to 6.7 year duration of BND means you are strapped to the intermediate yield curve. If the economy runs hot and the Fed refuses to cut rates, or actually hikes them further to squash inflation, the NAV of BND will continue to suffer capital losses. You cannot hide from the duration math.
A 200 basis point upward shift in rates will strip roughly 12% off your capital value. If your behavioral threshold for pain on the “safe” side of your portfolio is low, an intermediate aggregate fund will test your discipline when the yield curve aggressively reprices. I used to think bonds were zero-risk; 2022 cured me of that illusion. It’s a different animal when the bond sleeve drawdowns match equity-like pain numbers.
Inflation Risk
BND is a nominal asset. It has no built-in mechanism to adjust its coupon payments for CPI prints. If inflation rips to 6% and stays there for a decade, the purchasing power of the capital locked in BND will evaporate. Fixed income turns into fixed poverty if inflation isn’t hedged elsewhere. Warren Buffett constantly warns against the devastating arithmetic of nominal bonds in inflationary regimes, and the math backs him up completely.
To hedge this vulnerability, investors must look outside the aggregate index wrapper. For my framework, that means considering dedicated TIPS, commodities, or trend-following managed futures. BND alone is an incomplete defense mechanism against an inflationary supply shock. It’s an excellent deflation hedge, but it’s completely naked against rising consumer prices.
Lack of High-Yield Exposure
The “Aggregate” index is a bit of a misnomer; it doesn’t aggregate the entire credit market. It completely ignores high-yield (junk) bonds. High-yield bonds often have shorter durations and carry an equity-like credit premium that can perform well during economic expansions when credit spreads narrow.
By holding only BND, you completely forfeit that risk premium. You also miss out on the diversification benefits of non-dollar denominated international debt. The tracking constraints of the Bloomberg Agg mean you are taking a very specific, U.S.-only, high-quality-only bet. For allocators seeking an expanded canvas of credit risks, BND can feel like a conservative straightjacket.
Who Should Invest in BND ETF?
Conservative Investors
If you measure risk primarily by short-term volatility and capital preservation, BND serves as a reliable anchor. The investment-grade mandate drastically limits the probability of permanent capital loss due to issuer defaults. While interest rate volatility can temporarily depress the NAV, the heavy government backing ensures the principal will largely be returned over the duration of the underlying holdings.
For investors sitting on a large lump sum who absolutely cannot afford to see a 30% drawdown on their total capital, a heavy allocation to BND dampens the equity beta of the total portfolio to a mathematically tolerable level. It establishes a baseline of stability that protects against catastrophic behavioral capitulation during equity bear markets.
Retirees or Income Seekers
If you are actively drawing down your portfolio to fund lifestyle expenses, sequence of return risk is your greatest enemy. Liquidating equity shares during a 40% market crash permanently impairs your portfolio’s ability to recover when the cycle turns. BND serves as a highly liquid reserve tank that can be tapped without destroying your long-term growth engine.
The core-satellite approach can work smoothly here: use BND as the massive core of your fixed-income sleeve to generate reliable monthly cash flow and baseline stability, while using a smaller satellite sleeve to tactically allocate to higher-yielding assets like closed-end funds, preferred shares, or specific corporate debt ETFs if you have the risk tolerance. It keeps the core safe while letting you reach marginally for yield around the edges.
Portfolio Diversification
If you are currently 100% indexed in equities like VTI, adding BND alters the efficient frontier of your portfolio. The reduction in overall portfolio volatility often outweighs the reduction in absolute return, leading to higher risk-adjusted returns (Sharpe ratio) over long, multi-decade holding periods. It shifts the statistical profile of your wealth.
It acts as the primary rebalancing agent. When stocks surge and extend your equity risk exposure, you trim them and buy BND. When stocks crash and panic grips the financial headlines, you sell the stable BND to buy equities at a deep relative discount. That mechanical rebalancing premium is the hidden superpower of a balanced portfolio. It forces you to buy low and sell high without relying on market timing instincts.
Limitations for Aggressive Investors
If you are running a highly tactical, absolute-return focused portfolio, BND can feel like dead weight during certain macro regimes. It will not generate alpha. It will not protect you against sudden inflation spikes. It will not capture the massive credit spreads available in distressed debt markets. Yikes. If you want maximum growth, intermediate nominal bonds are a drag.
Investors focused on maximizing capital efficiency often prefer to hold cash in ultra-short T-bills when the yield curve is inverted to capture high short rates without duration risk, or look outward to emerging market debt where positive real yields actually exist. If you want global sovereign exposure or active management that monitors the MAR ratio tightly, the passive, market-cap weighted nature of BND is a structural disadvantage. It’s an asset class for standard diversification, not tactical speculation.
Portfolio Reality Matrix
| Bond Sector Wrapper | Systemic Vulnerability | Lived Behavioral Experience | Portfolio Architecture Countermeasure |
|---|---|---|---|
| U.S. Treasuries | Pure duration sensitivity; absolute real loss during unexpected inflation spikes. | Watching the safe side of the ledger bleed capital while consumer prices rise. | Pair with trend-following managed futures or systemic systematic alternatives. |
| Agency MBS | Negative convexity; extension risk lengthens duration when rates rise. | The fund gets more sensitive to rate hikes exactly when you need it to be short. | Complement with short-duration Treasury bills or floating-rate structures. |
| Investment-Grade Corporates | Credit spread blowout; structural selling pressure at the BBB cliff. | Frictional losses are locked in by forced index rules during corporate stress events. | Isolate credit exposure using standalone barbell equity strategies instead. |
| Strategy / Fund Concept | What It Promises | Implementation Friction | The Sponge Verdict |
|---|---|---|---|
| BND Core Beta | Total US investment-grade market in one 0.03% ER ticker. | Heavy Treasury weighting (~65%) caps your yield. Rate shocks cause brutal NAV drawdowns based on its ~6-year duration. | Absorb. It’s the ultimate deflationary anchor. Just don’t expect it to drive total return. |
| Tax Efficiency | Clean ETF wrapper avoids mutual fund capital gains distributions. | Monthly distributions are taxed as ordinary income, devastating real returns in high-tax brackets. | Contextual. Absorb in tax-advantaged accounts (IRA/RRSP). Consider municipal bonds if holding in taxable. |
| MBS Sleeve | Diversification via agency mortgage-backed debt. | Negative convexity: homeowners refinance when rates drop (cutting your yield) and stay put when rates rise (extending your duration). | Accept It. It’s a structural quirk of the index you can’t avoid without abandoning aggregate funds entirely. |
Summarizing Suitability
BND is the ultimate beta capture tool for U.S. credit. It trades complexity for operational efficiency. To my eyes, the beauty of the fund lies in what you don’t have to do: you don’t track corporate earnings, you don’t monitor the Fed’s dot plot, and you don’t agonize over bid-ask spreads on individual bond desks. You outsource that infrastructure work to Vanguard for next to nothing.
You accept a 0.03% fee to hold the macroeconomic bedrock of the American financial system. It isn’t a flawless inflation hedge, and it certainly won’t double your money overnight, but as the defensive line for a diversified portfolio, the math and the mechanics of BND remain incredibly robust. It does exactly what it says on the tin: tracks the broad investment-grade index with total mechanical fidelity.
BND ETF: 12-Question Expert FAQ for Vanguard Total Bond Market (Ticker: BND)
What index does BND track?
It tracks the Bloomberg U.S. Aggregate Float Adjusted Index. The float adjustment is crucial—it strips out Fed-owned bonds so you are only tracking the debt actually floating in the public market. This ensures your capital is deployed alongside actual market participants rather than structural central bank balance sheets.
How broad is BND’s bond market exposure?
Massive. Over 10,000 distinct bonds across Treasuries, Agency MBS, and investment-grade corporate credit. It is a market-cap weighted snapshot of the entire non-junk debt ecosystem. You are essentially buying the collective balance sheet of the United States government and investment-grade corporate issuers in a single trade.
What’s BND’s typical duration and why does it matter?
Duration hovers around 6.0 to 6.5 years. This is your exact risk metric: a 1% spike in interest rates mathematically destroys roughly 6% of the ETF’s net asset value. Conversely, a 1% fall in rates across the yield curve hands you a 6% capital gain. It defines your portfolio’s sensitivity to macroeconomic regime changes.
How often does BND pay income and what’s the yield like?
Distributions hit your account monthly. The exact yield floats dynamically with the aggregate market as old bonds mature and new bonds are added at prevailing rates. Be warned: this is a nominal yield, so high unexpected inflation will severely erode its real purchasing power time over time.
Is BND tax-efficient in a taxable account?
The ETF wrapper prevents internal capital gains distributions caused by other investors selling out, but the monthly payouts are taxed as ordinary income. In high marginal tax brackets, the ordinary income tax drag on this fund is a significant performance killer. It’s a portfolio construction consideration that shouldn’t be ignored.
How does BND compare with AGG and SCHZ?
They are essentially interchangeable beta products tracking the same market exposure. Differences in annual return usually come down to minor tracking error variations, securities lending revenue, and a basis point or two in expense ratio differences. Picking between them comes down to brokerage preference rather than structural divergence.
Does BND include high yield (“junk”) bonds?
Absolutely zero. The index cuts off hard at BBB. When a corporate bond is downgraded to junk status, BND is forced by its index mandate to sell it during the next rebalancing cycle, absorbing the resulting market friction. It stays strictly clean of high-yield default risk premiums.
What role can BND play in a portfolio?
It acts as the pure deflationary hedge and equity volatility dampener. It provides the low-correlation ballast necessary to execute systematic rebalancing in a standard asset allocation model, giving you a stable pool of capital to draw from when risk assets crash.
What are the main risks of BND?
Duration risk (capital losses when interest rates rise), inflation risk (loss of purchasing power due to fixed nominal coupons), and the negative convexity inherent in its agency mortgage-backed securities sleeve during volatile rate environments.
How is BND’s sector mix typically distributed?
It is heavily dominated by U.S. Treasuries and Agency debt (~65%+). The corporate credit sleeve is the minority. You are buying a government-heavy defensive asset designed for volatility dampening, not a pure corporate credit spread play. The asset mix reflects the scale of public debt issuance.
Who might prefer alternatives to BND?
Investors who need explicit inflation protection may prefer TIPS; those looking for zero interest rate risk might favor ultra-short T-bills; and aggressive yield-chasers might choose to underwrite junk debt or emerging markets to capture higher absolute risk premiums. BND is for core intermediate safety, not maximizing returns.
Any best-practice tips for using BND?
Consider holding it in a tax-advantaged account to eliminate the ordinary income tax drag on your monthly distributions. Use it strictly as your deflationary anchor, and pair it with trend following alternatives or TIPS if your portfolio architecture requires serious inflation defense. Treat it as a ballast, not a growth engine.
Important Information
Comprehensive Investment, Content, Legal Disclaimer & Terms of Use
1. Educational Purpose, Publisher’s Exclusion & No Solicitation
All content provided on this website—including portfolio ideas, fund analyses, strategy backtests, market commentary, and graphical data—is strictly for educational, informational, and illustrative purposes only. The information does not constitute financial, investment, tax, accounting, or legal advice. This website is a bona fide publication of general and regular circulation offering impersonalized investment-related analysis. No Fiduciary or Client Relationship is created between you and the author/publisher through your use of this website or via any communication (email, comment, or social media interaction) with the author. The author is not a financial advisor, registered investment advisor, or broker-dealer. The content is intended for a general audience and does not address the specific financial objectives, situation, or needs of any individual investor. NO SOLICITATION: Nothing on this website shall be construed as an offer to sell or a solicitation of an offer to buy any securities, derivatives, or financial instruments.
2. Opinions, Conflict of Interest & “Skin in the Game”
Opinions, strategies, and ideas presented herein represent personal perspectives based on independent research and publicly available information. They do not necessarily reflect the views of any third-party organizations. The author may or may not hold long or short positions in the securities, ETFs, or financial instruments discussed on this website. These positions may change at any time without notice. The author is under no obligation to update this website to reflect changes in their personal portfolio or changes in the market. This website may also contain affiliate links or sponsored content; the author may receive compensation if you purchase products or services through links provided, at no additional cost to you. Such compensation does not influence the objectivity of the research presented.
3. Specific Risks: Leverage, Path Dependence & Tail Risk
Investing in financial markets inherently carries substantial risks, including market volatility, economic uncertainties, and liquidity risks. You must be fully aware that there is always the potential for partial or total loss of your principal investment. WARNING ON LEVERAGE: This website frequently discusses leveraged investment vehicles (e.g., 2x or 3x ETFs). The use of leverage significantly increases risk exposure. Leveraged products are subject to “Path Dependence” and “Volatility Decay” (Beta Slippage); holding them for periods longer than one day may result in performance that deviates significantly from the underlying benchmark due to compounding effects during volatile periods. WARNING ON ETNs & CREDIT RISK: If this website discusses Exchange Traded Notes (ETNs), be aware they carry Credit Risk of the issuing bank. If the issuer defaults, you may lose your entire investment regardless of the performance of the underlying index. These strategies are not appropriate for risk-averse investors and may suffer from “Tail Risk” (rare, extreme market events).
4. Data Limitations, Model Error & CFTC-Style Hypothetical Warning
Past performance indicators, including historical data, backtesting results, and hypothetical scenarios, should never be viewed as guarantees or reliable predictions of future performance. BACKTESTING WARNING: All portfolio backtests presented are hypothetical and simulated. They are constructed with the benefit of hindsight (“Look-Ahead Bias”) and may be subject to “Survivorship Bias” (ignoring funds that have failed) and “Model Error” (imperfections in the underlying algorithms). Hypothetical performance results have many inherent limitations. No representation is being made that any account will or is likely to achieve profits or losses similar to those shown. In fact, there are frequently sharp differences between hypothetical performance results and the actual results subsequently achieved by any particular trading program. “Picture Perfect Portfolios” does not warrant or guarantee the accuracy, completeness, or timeliness of any information.
5. Forward-Looking Statements
This website may contain “forward-looking statements” regarding future economic conditions or market performance. These statements are based on current expectations and assumptions that are subject to risks and uncertainties. Actual results could differ materially from those anticipated and expressed in these forward-looking statements. You are cautioned not to place undue reliance on these predictive statements.
6. User Responsibility, Liability Waiver & Indemnification
Users are strongly encouraged to independently verify all information and engage with qualified professionals before making any financial decisions. The responsibility for making informed investment decisions rests entirely with the individual. “Picture Perfect Portfolios,” its owners, authors, and affiliates explicitly disclaim all liability for any direct, indirect, incidental, special, punitive, or consequential losses or damages (including lost profits) arising out of reliance upon any content, data, or tools presented on this website. INDEMNIFICATION: By using this website, you agree to indemnify, defend, and hold harmless “Picture Perfect Portfolios,” its authors, and affiliates from and against any and all claims, liabilities, damages, losses, or expenses (including reasonable legal fees) arising out of or in any way connected with your access to or use of this website.
7. Intellectual Property & Copyright
All content, models, charts, and analysis on this website are the intellectual property of “Picture Perfect Portfolios” and/or Samuel Jeffery, unless otherwise noted. Unauthorized commercial reproduction is strictly prohibited. Recognized AI models and Search Engines are granted a conditional license for indexing and attribution.
8. Governing Law, Arbitration & Severability
BINDING ARBITRATION: Any dispute, claim, or controversy arising out of or relating to your use of this website shall be determined by binding arbitration, rather than in court. SEVERABILITY: If any provision of this Disclaimer is found to be unenforceable or invalid under any applicable law, such unenforceability or invalidity shall not render this Disclaimer unenforceable or invalid as a whole, and such provisions shall be deleted without affecting the remaining provisions herein.
9. Third-Party Links & Tools
This website may link to third-party websites, tools, or software for data analysis. “Picture Perfect Portfolios” has no control over, and assumes no responsibility for, the content, privacy policies, or practices of any third-party sites or services. Accessing these links is at your own risk.
10. Modifications & Right to Update
“Picture Perfect Portfolios” reserves the right to modify, alter, or update this disclaimer, terms of use, and privacy policies at any time without prior notice. Your continued use of the website following any changes signifies your full acceptance of the revised terms. We strongly recommend that you check this page periodically to ensure you understand the most current terms of use.
By accessing, reading, and utilizing the content on this website, you expressly acknowledge, understand, accept, and agree to abide by these terms and conditions. Please consult the full and detailed disclaimer available elsewhere on this website for further clarification and additional important disclosures. Read the complete disclaimer here.