
The costliest mistakes in individual portfolio building rarely stem from pure mathematical errors. Instead, they usually flow from a fundamental failure of classification: treating every stock ticker as an identical financial widget that can be plugged into a single, generic valuation model. When investors look at a low trailing price-to-earnings (P/E) ratio, a fat dividend yield, or a steep revenue chart, they often assume these metrics carry universal meaning across the entire equity universe.
They do not. A headline metric can mean entirely opposite things depending on what kind of business is being evaluated. Buying a cyclical company at a low trailing P/E ratio at the top of an economic boom is a classic way to lose capital right before earnings collapse. Conversely, evaluating a rapid business expansion story using the low-multiple expectations appropriate for a mature utility will systematically exclude outstanding growth engines from a portfolio before they have room to run.
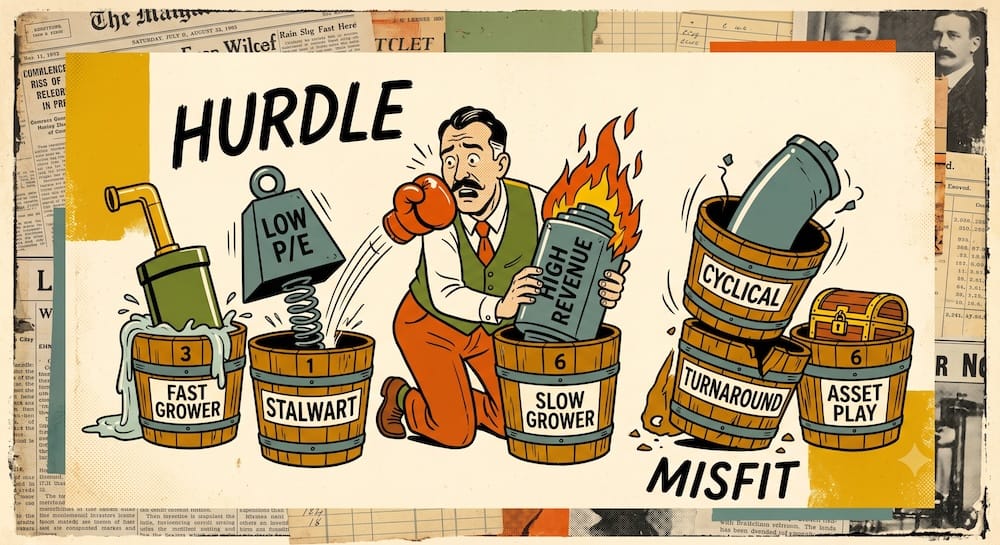
To address this problem, investors must recognize that a stock is not an abstract digit on a screen, but a live business enterprise operating at a specific stage of its development. In his writings—most notably One Up on Wall Street—Peter Lynch addressed this reality by organizing companies into six distinct buckets: Slow Growers, Stalwarts, Fast Growers, Cyclicals, Turnarounds, and Asset Plays.
The primary value of this classification system is not neat bookkeeping; it is the prevention of category errors. The category assigned to a business determines the earnings patterns to expect, the balance sheet data to prioritize, the valuation multiples to weigh, and the specific warning signs that signal a thesis is in jeopardy. In short, classification does not dictate whether a stock is worth buying; it establishes the analytical questions required for the investment thesis to make sense in the first place.
WHAT THE SIX CATEGORIES WERE AND WERE NOT
To apply this framework successfully today, it helps to strip away the pop-finance folklore that has accumulated around it. Lynch presented these six buckets as practical classifications to help investors organize their thoughts and align their expectations with business realities. They were never designed to serve as an automated trading system or a set of rigid, algorithmic buy-and-sell rules.
Crucially, these labels are flexible rather than permanent. A corporation does not receive an unchangeable identity mark when it lists on an exchange; it moves from one bucket to another as its market matures, its balance sheet evolves, or its industry undergoes disruption. The primary benefit of these categories is that they act as an expectation framework. They prevent an investor from expecting a multi-billion-dollar consumer staple giant to deliver tenfold returns in three years, and they stop someone from treating a distressed turnaround as a safe, permanent compounder.
We should also clarify that these classifications are not identical to modern factor investment strategies. They are descriptive terms for the specific operational condition and lifecycle stage of an individual enterprise. A Fast Grower can be small or large; a Turnaround can involve a cyclical recovery or a structural corporate reorganization.
Furthermore, assigning a stock to a category is not an automatic recommendation to buy. It is simply the opening move in equity analysis. It tells an investor which questions to ask and which traps to look out for. Organizing these warning signs and thesis-testing steps is a systematic way to ensure we do not apply the rules of one business lifecycle stage to a completely different corporate reality.
MASTER CATEGORY MATRIX
The following matrix outlines the classification logic for these six corporate stages, showing how the primary economic engine dictates the central analytical question and alters the relevance of standard valuation metrics.
| Category | Economic Engine | Central Analytical Question | Common Valuation Trap | Common Misclassification |
| Slow Grower | Mature, low-growth cash generation; emphasis on dividend distributions. | Is the free cash flow distribution sustainable over the long term? | Mistaking a high dividend yield for total return safety while assets decay. | Confusing a fundamentally weak, dying business with a reliable income source. |
| Stalwart | Moderate, durable compound earnings growth (historically ~10% to 12%). | Can the company maintain its competitive advantage and earnings durability? | Overpaying for moderate growth by assigning a fast-growth multiple. | Mistaking a mature compounder for a stock that can expand indefinitely. |
| Fast Grower | Rapid, profitable revenue and market footprint expansion. | How long is the remaining market runway before saturation occurs? | Extrapolating high growth rates indefinitely into the future. | Treating an unprofitable, speculative story stock as a proven growth engine. |
| Cyclical | Earnings tied directly to external economic or industry capacity waves. | Where do current earnings sit within the industry cycle? | Buying at a statistically low P/E ratio at the absolute peak of profits. | Mistaking a temporary macroeconomic boom for permanent structural growth. |
| Turnaround | Operational restructuring, debt reduction, or survival recovery. | Does the company possess enough liquidity to remain solvent until profits recover? | Confusing a cheap nominal share price with true corporate viability. | Classifying a permanent, secularly declining business as a recoverable asset. |
| Asset Play | Underrecognized, mispriced tangible or hidden corporate assets. | Can the hidden asset value be clearly identified and successfully realized? | Buying a deep discount to book value when the assets are permanently trapped. | Mistaking an arbitrary, non-monetizable accounting entry for real value. |
SLOW GROWERS
Slow Growers typically begin as large, mature enterprises that have expanded to fill their available market space. During their peak years, these firms were often Fast Growers or Stalwarts, but they have since hit the natural limits of physical or economic scaling. In Lynch’s era, these companies were generally described as growing earnings at a modest pace of 2% to 4% annually, roughly matching or slightly trailing the long-term growth rate of the broader economy.
Because these corporations have exhausted their internal, high-return capital reinvestment opportunities, their capital allocation strategies often tilt toward returning cash to shareholders, frequently via regular dividend payments. However, capital allocation varies considerably across individual firms, and not all slow growers distribute the vast majority of their free cash flow. The return profile for this category relies more heavily on dividends and modest earnings growth than on explosive capital appreciation, but distributions do not eliminate the potential for capital gains if the stock is purchased at a deep discount to its assets.
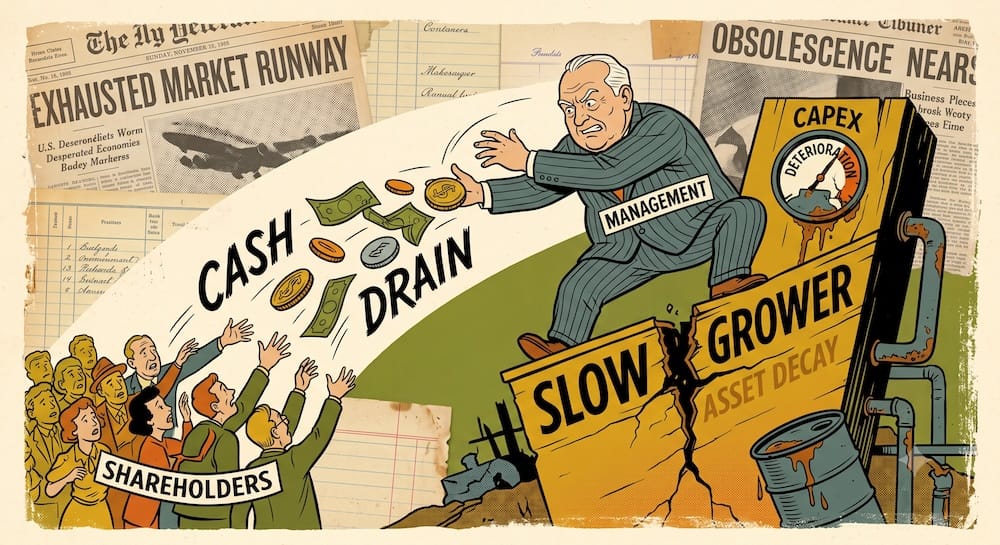
The central analytical trap when evaluating a Slow Grower is yield masking asset decay. A high trailing dividend yield can serve as a behavioral narcotic, lulling an investor into a false sense of security while the company’s underlying operational foundation deteriorates. If a corporation is paying out a large portion of its free cash flow to maintain an attractive yield while its core business experiences structural volume declines, the dividend becomes a ticking clock. Investors regularly mistake a weak company with an unsustainable distribution for a safe income harbor.
When examining a Slow Grower, the relevant evidence includes dividend capacity and the payout ratio relative to true free cash flow rather than net income. The thesis depends partly on whether the capital expenditure required to maintain existing operations is outstripping depreciation charges. If essential maintenance needs are being systematically deferred to preserve the dividend payment, the classification becomes less credible.
A common warning sign occurs when management attempts to escape its slow-growth destiny through uncharacteristic diversification acquisitions. When a mature utility or commodity processor takes its excess cash and purchases an unrelated technology startup or consumer brand, the move frequently destroys value, though it is not automatically catastrophic in every instance.
The natural migration path for an unloved Slow Grower is downward into a structurally impaired asset if its market segment undergoes technological obsolescence. However, if the corporation successfully maintains a pristine balance sheet and manages its asset contraction rationally, it can deliver reasonable returns during periods of market stress when investors value immediate cash returns over speculative future expansion.

STALWARTS
Stalwarts are the multi-billion-dollar champions of the equity universe. In Lynch’s original framework, these enterprises were described as delivering consistent, dependable annual earnings growth in the neighborhood of 10% to 12%. They are characterized by durable competitive positions, steady balance sheets, and highly predictable demand patterns that remain resilient across varying macroeconomic environments. Famous historical examples from Lynch’s tenure included dominant operators like Coca-Cola or Bristol-Myers during their steady compound expansion eras.
When analyzing a Stalwart, the core investment thesis relies on earnings durability rather than explosive velocity. The market typically rewards these companies with steady valuation multiples because their strong competitive positioning reduces certain business risks. However, no equity downside is capped merely because a company is considered a stalwart. Strong positioning does not eliminate market losses, valuation risk, leverage risk, or technological disruption.
The primary valuation trap with a Stalwart is the mistake of overpayment. Because these businesses are universally recognized as high-quality operators, they frequently become crowded consensus positions. When a company growing its core earnings at a steady, moderate rate sees its trailing P/E multiple expand from a historical average of 15x to an inflated 30x, the investment expectations risk rises dramatically. Overpayment does not guarantee an immediate drop in share price, but it leaves no margin of safety if growth ticks slightly downward.
When evaluating a Stalwart, the relevant evidence includes the durability of the competitive position, which may appear through stable gross and operating margins over a rolling multi-year window. If margins are stable or expanding, the firm’s pricing power is generally intact. If margins are contracting despite rising revenue, the corporation may be using aggressive promotional discounts or facing input cost inflation it can no longer pass through to customers.
A common misclassification error is treating a mature Stalwart as an endless, high-velocity compounder. When a dominant technology platform or hardware designer gains universal market adoption, its financial profile naturally shifts from a Fast Grower to a Stalwart.
If an investor refuses to update their classification, they will likely hold the security through a significant period of multiple contraction as the broader market adjusts its pricing to reflect the new, lower growth reality. The analytical goal with a true Stalwart is to evaluate whether the market is pricing the asset as a reliable compounder or mistakenly paying a premium that requires unsustainable acceleration.

FAST GROWERS
Fast Growers are small, agile, aggressively expanding operations that compound their annual earnings at rapid rates, historically described by Lynch as 20% to 25% or more. These companies are typically characterized by an easily replicable business model that is rapidly capturing market share within an under-penetrated niche or scaling a proven localized concept across a wider geographic footprint.
It is critical to preserve the distinction between a true Fast Grower and a speculative story company. Modern markets are full of high-flying technology, biotechnology, and conceptual platforms that display spectacular top-line revenue growth while losing massive amounts of capital on an operating basis.
Lynch’s category is rooted in rapid earnings growth, so loss-making companies naturally fit poorly into this framework. The business model must demonstrate that its expansion path leads to true profitability, showing that the firm can fund its capital demands through strong internal cash generation and a resilient balance sheet. However, this should not be converted into a rigid modern eligibility code involving mandatory zero-debt formulas or universal unit-economic checklists like customer acquisition cost (CAC) and lifetime value (LTV) models, which are useful modern analytical additions rather than compulsory Lynch criteria.
The central valuation trap for a Fast Grower is the danger of extrapolating near-term growth rates too far into the future. High growth rates naturally decay as a company grows larger. When the market prices a Fast Grower at a P/E multiple that requires maximum velocity for the next decade, the margin of safety disappears. The moment the corporation hits the natural limits of its geographic runway or faces aggressive new entrants, its growth rate downshifts, causing an immediate downward re-rating of the stock price.
When investigating a Fast Grower, the runway, profitability, financing demands, and market saturation serve as relevant evidence rather than compulsory formulas. An investor should examine whether the business model remains highly profitable as it expands away from its home region. If a restaurant chain or retailer shows deteriorating margins as it enters distant markets, the expansion engine is running into structural friction.
The natural lifecycle migration for a successful Fast Grower is a transition into a Stalwart as it achieves broad market dominance and its growth velocity slows. Identifying this shift is critical. If an investor continues to value the business as an explosive disruptor after its footprint has saturated, they will likely face significant investment losses as the market adjusts the multiple downward to fit its new identity as a mature compounder.
CYCLICALS
Cyclicals are enterprises whose revenues, profits, and stock prices are directly tethered to exogenous macroeconomic fluctuations, global commodity pricing trends, or industry-specific capacity waves. Examples include traditional automotive manufacturers, steel producers, chemical processors, paper manufacturers, and commercial airlines. In these sectors, individual corporate strategy and management skill are highly important for determining who survives a downturn, but the broader cycle dominates near-term financial results.
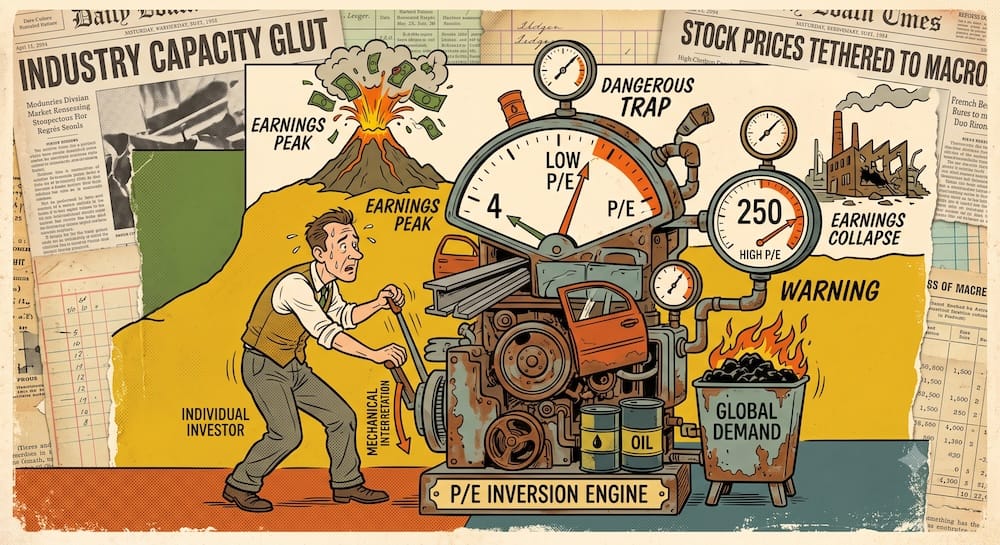
The definitive analytical trap in this category is the cyclical P/E inversion. For standard operating businesses, a low P/E ratio implies undervaluation, while a high P/E ratio indicates expensive pricing. For a Cyclical, this logic is dangerously inverted. A Cyclical frequently looks statistically cheap with a single-digit P/E ratio at the absolute peak of its earnings cycle, because the market anticipates an imminent drop in product pricing and volumes.
Conversely, when a cyclical downturn occurs, earnings can collapse completely. At this point, the trailing P/E can rise sharply, become entirely meaningless, or disappear from financial databases due to net operating losses. The share price may fall precipitously even while the displayed P/E ratio spikes into the hundreds. The central lesson here is that a low trailing P/E may coincide with peak earnings, while a high or unavailable P/E may coincide with depressed earnings. Neither condition is itself a buy or sell signal, but rather a warning against mechanical interpretation of valuation multiples.
When analyzing a Cyclical, the relevant evidence includes global industry capacity utilization, competitor capital expenditure trends, and changes in corporate inventory relative to sales velocity. If finished goods inventory is accumulating rapidly while sales growth slows, it suggests an industry-wide glut is developing, which will soon force price cuts and margin compression.
Deterioration in this category may appear through a shift from ordinary cyclicality to structural decline. A common category error is mistaking a temporary, macro-driven commodity boom for a permanent structural growth story.
If an investor misclassifies a cyclical peak as a long-term compound growth trend, they will likely overpay for the asset right before supply normalizes. Balance sheet resilience, cost position, and capital allocation determine which firms emerge intact from the bottom of the cycle, meaning the security must be managed with strict cyclical awareness rather than a passive buy-and-hold mentality.
TURNAROUNDS
Turnarounds are corporations that have suffered severe operational setbacks, financial distress, or strategic failures. They are heavily discounted by institutional allocators and frequently trade at a fraction of their historical valuations. The investment appeal here relies on probabilistic outcomes and a potential mismatch between price and survival odds; outcomes can be highly asymmetric or discontinuous, but not every case is a simple binary choice between complete recovery or absolute zero.
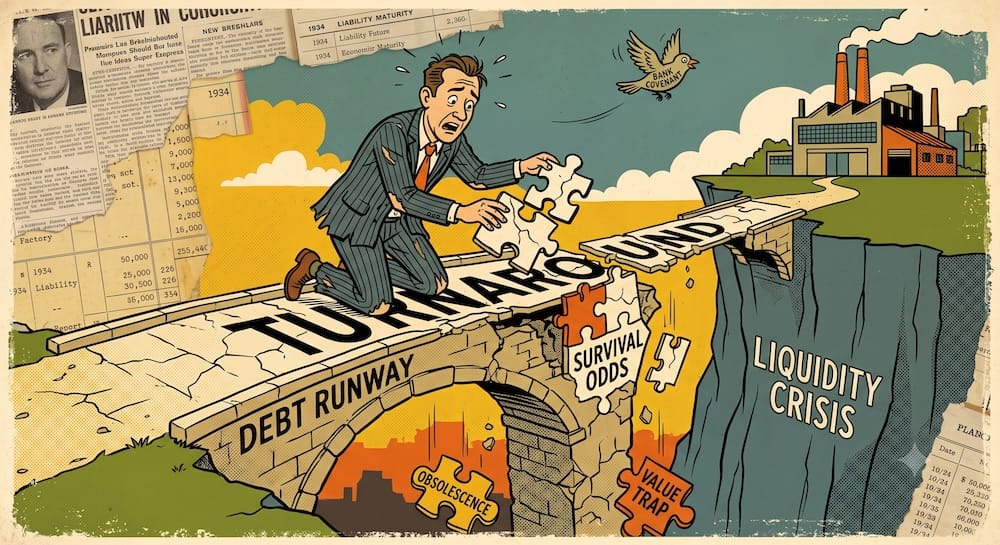
It is vital to recognize several turnaround types and ranges of outcomes rather than treating them all as identical high-risk gambles. A temporary operating crisis—such as a product recall, a transient management dispute, or an easily remedied corporate restatement—presents a completely different risk profile than an existential liquidity crisis. In a liquidity crisis, the corporation faces near-term debt maturities that outstrip its available cash and bank credit facilities.
The common valuation trap here is confusing a low nominal share price with true value. A stock that has dropped from $50 to $2 per share is not automatically cheap; if the business faces imminent bankruptcy, the equity can still go to zero. Investors regularly fall into this trap, assuming that a familiar corporate name guarantees an eventual recovery.
When analyzing a Turnaround, liquidity and debt runway function as a rough analytical issue rather than a simplified equation. An investor must evaluate cash burn rates, unencumbered credit lines, and bank loan covenants, while recognizing that this runway is deeply affected by changing working capital requirements, restructuring costs, seasonal cash flows, and whether credit lines remain drawable during distress.
A false version of this category is the permanent value trap—a business in secular decline whose product or service is facing technological obsolescence. If a company’s sales declines are structural rather than temporary, cutting overhead expenses will not fix the core problem.
A successful Turnaround requires that the primary source of distress be clearly identified and fixable. Once the corporate debt profile is stabilized and operations normalize, the asset can be reclassified into a standard Stalwart or Cyclical, at which point its valuation multiples should be judged by its normalized earnings power.
ASSET PLAYS
Asset Plays are corporations that hold underrecognized, mispriced, or hidden assets that are not accurately reflected on a standard, historical-cost balance sheet. In Lynch’s original framework, these assets often took the form of physical real estate purchased decades ago, cash piles, timberlands, or valuable subsidiaries. The asset must be underrecognized relative to the market valuation and economically relevant to the gap between the stock price and true intrinsic value.
The central analytical challenge with an Asset Play is distinguishing between identification and realization. It is relatively easy to scan financial footnotes and identify an asset that appears to be worth more than the current market capitalization of the entity. The real difficulty lies in finding a realistic pathway for that value to be unlocked for shareholders.
If the asset value is controlled by a management team with no intention of monetizing it, or if the corporate governance structure insulates executives from outside pressure, the discount can remain in place for decades. The hidden value becomes a permanent value trap, and the asset value is gradually consumed by ongoing corporate overhead costs.
The most common valuation error in this category is an incorrect, mechanical reliance on accounting book value alone. A low price-to-book (P/B) ratio does not automatically indicate a viable Asset Play. If the book value consists of outdated factory equipment, specialized industrial tooling, or obsolete inventory that cannot be sold for its stated accounting value, the metric is meaningless.
Furthermore, a company possessing valuable intangible assets does not automatically create an Asset Play. A brand, software platform, or customer network may simply belong to the operating business and be fully recognized in the stock price; to be an Asset Play, the asset must be economically separable or appraisable apart from the core operations.
When investigating an Asset Play, activism, corporate sales, spin-offs, or liquidations should be viewed only as possible historical value-realization mechanisms, not as a standardized checklist for retail execution.
The thesis fails if the asset remains permanently trapped inside an inefficient corporate structure while the core operating business continues to burn through cash reserves. The analytical goal is to evaluate whether a catalyst exists to close the valuation gap, or if the discount is a permanent feature of poor corporate governance.
CATEGORY MIGRATION
A common analytical error when using this framework is treating a category assignment as a permanent label. Corporations are dynamic economic organisms that continuously move between these six buckets as they progress through their corporate lifecycles. Refusing to update your classification when a company’s underlying economics change is simply another form of behavioral anchoring.
However, we must avoid deterministic lifecycle models. Companies do not follow a mandatory, linear script; they can skip stages, reverse direction, blend characteristics, or resist clean classification entirely. Not every Fast Grower inevitably decays into a Stalwart and a Slow Grower. Some firms maintain high growth for decades, while others collapse directly from growth into insolvency.
The classic, ideal lifecycle path is worth studying as a baseline example. A company begins its public life as a high-velocity Fast Grower, compounding its footprint by scaling into an open market runway. Over time, the company achieves broad market penetration, its addressable market matures, and its growth rate naturally slows. At this inflection point, the company migrates into a Stalwart. If an investor refuses to adjust their classification, they will likely hold the stock through a painful multiple contraction phase, expecting explosive metrics that the business can no longer structurally deliver.
Eventually, even a dominant Stalwart hits maturity limits, its market segment hits equilibrium, and its capital allocation shifts almost entirely to cash distributions, turning the asset into a dividend-paying Slow Grower. If that Slow Grower encounters a disruptive technological shock or suffers from poor capital allocation decisions, it can experience an operational crisis, migrating into a distressed Turnaround. If the turnaround restructuring succeeds, the balance sheet is repaired, and operations stabilize, the corporation can emerge as a normalized Stalwart or a macro-sensitive Cyclical, restarting the analytical loop.
Similarly, a Cyclical enterprise can experience a structural shift. If a cyclical commodity company suffers a prolonged downturn that ruins its weaker competitors, it may be forced into a Turnaround posture simply to survive the winter. The main point is clear: you must continuously test your primary classification against the company’s financial realities. The moment a corporation’s growth rate, balance sheet structure, or industry context shifts across these boundary lines, the analytical model used to judge the security must adapt immediately.
THE MOST EXPENSIVE CATEGORY ERRORS
The table below outlines the costliest classification errors made by individual equity allocators, detailing the behavioral traps and empirical evidence required to avoid permanent capital impairment.
| The Mistaken Classification | Why It Initially Looks Plausible | The Evidence Contradicting It | The Analytical Consequence |
| Buying a peak Cyclical mistaken for a cheap value play. | The trailing P/E ratio is in the low single digits, and recent corporate earnings are at historic highs. | Global industry capacity utilization is peaking, competitor capital expenditure is rising, and product inventories are accumulating. | A severe collapse in earnings as the cycle turns, causing a drop in both profits and the valuation multiple. |
| Buying a weak company mistaken for a safe Slow Grower. | The stock offers a very high trailing dividend yield, and the brand is widely recognized by the public. | The dividend payout ratio exceeds 90% of true free cash flow, and core capital expenditure is trailing depreciation. | A sudden dividend cut or suspension, followed by an immediate downward adjustment of the stock price. |
| Buying an unprofitable story company mistaken for a Fast Grower. | Top-line revenue growth is spectacular, and the market narrative is highly exciting. | Operating income and free cash flow are negative, debt is rising, and outstanding shares are diluting rapidly. | Dilutive equity issuance or insolvency when capital markets tighten and refuse to fund ongoing operating losses. |
| Buying a permanently declining business mistaken for a Turnaround. | The stock price has fallen 80% from its historical peak, and management promises an imminent operational recovery. | Core revenue volumes display continuous secular declines, gross margins are shrinking, and debt obligations are increasing. | The company functions as a permanent value trap, slowly consuming its remaining capital until it faces liquidation. |
| Buying an inaccessible accounting discount mistaken for an Asset Play. | The stock trades at a large discount to its stated accounting book value or historical asset costs. | The assets are un-monetizable, illiquid, or controlled by corporate insiders with no history of returning capital. | The valuation discount remains locked in place indefinitely while corporate overhead expenses erode asset value. |
| Buying a mature Stalwart priced as a perpetual Fast Grower. | The company boasts a pristine competitive moat and delivers exceptionally reliable, steady earnings growth. | The trailing P/E ratio has expanded past historical ranges, far outstripping the long-term earnings growth rate. | Substantial capital losses driven by multiple contraction, even if the underlying company performs flawlessly. |
WHAT STILL TRAVELS
Decades after Peter Lynch outlined these six corporate categories, the financial universe has grown far more complex. Modern public markets are dominated by complex conglomerates and mixed business models that defy simple corporate classification. A modern technology giant might operate a highly predictable advertising or cloud engine that functions as a highly profitable Stalwart, hold a massive corporate net cash balance, and simultaneously fund speculative venture investments.
These hybrid business structures introduce significant analytical friction; however, they do not make the underlying framework obsolete. The framework remains useful as a question-organizing device rather than a valuation substitute. It forces an investor to pause before constructing an investment thesis and identify the primary investment story surrounding a company.
When dealing with diversified or mixed corporate models, the framework warns us against treating the entire business enterprise as a single, uniform entity. It instructs us to analyze separate business engines individually rather than relying on a single blended multiple.
Furthermore, modern intangible assets require an update to our analytical focus. When evaluating a potential Asset Play or Turnaround, looking at physical inventory or historical real estate costs is no longer sufficient. An investor must consider intellectual property, software integration lock-ins, and recurring subscription networks.
However, we must avoid converting all intangible competitive advantages into Asset Plays. A strong brand or software platform usually belongs to the active operating business rather than representing an independent asset to be realized. The analytical tools must adapt to an intangible-heavy economy, but the core objective remains the same: using classification as a behavioral shield to ensure our expectations align with underlying business realities.
What is the minimum portfolio size needed to replicate Peter Lynch’s six categories strategy today?
It depends on your setup, but if you are attempting to pick individual stocks manually across all six buckets, you face a massive administrative and capital hurdle. To hold a statistically meaningful sample of Fast Growers, Cyclicals, Turnarounds, and Asset Plays while maintaining separate analytical lenses, a DIY investor would realistically need a portfolio size of at least $100,000 to $250,000 to fractionalize positions safely without transaction fees or bid-ask spreads destroying performance. However, if you drop the manual stock-picking engine and use the framework purely as a conceptual macro-filter for your portfolio canvas, the minimum capital requirement is exactly zero.
How do I handle the tax drag of a high-turnover lifecycle strategy in a taxable retail account?
Not efficiently. During his tenure at the Fidelity Magellan Fund, Lynch operated with an annual portfolio turnover that regularly exceeded 100%, continuously rotating capital out of fully valued Stalwarts and into distressed Turnarounds. If you attempt this high-velocity rotation inside a standard taxable brokerage account, you will trigger an immense short-term capital gains tax liabilities that materially degrades your long-term compound returns. The practical workaround is structural: restrict individual lifecycle equity selection entirely to tax-sheltered wrappers like an IRA or 401(k), keeping your taxable accounts dedicated to low-turnover, passive core allocations.
Can a company exist in multiple categories simultaneously, and how does that affect the analysis?
Yes, particularly in the modern asset-light economy. A multi-billion-dollar enterprise can run a mature, high-margin core service that behaves like a reliable Stalwart, accumulate a massive cash reserve that mimics an Asset Play, and fund an internal venture division aiming for Fast Grower velocity. The danger is attempting to value the entire entity with a single corporate multiple. When encountering these mixed corporate structures, the framework instructs you to segment the business and evaluate each distinct economic engine by its own lifecycle rules rather than forcing a hybrid asset into a single box.
What modern ETF tickers can a DIY investor use to target these categories systematically?
While Lynch’s categories are qualitative descriptions of corporate condition rather than mathematical rules, you can map their underlying factor premiums to specific index products. To capture the profitable operational profile of Fast Growers, look toward low-cost Small-Cap Quality ETFs like XSQ or equivalents targeting small-cap companies with strong balance sheets. For the deep-discount characteristics of Turnarounds and Asset Plays, a dedicated Small-Cap Value ETF like AVUV or IJS isolates the underlying economic premiums systematically, bypassing the extreme operational friction of manual stock screening.
Why is a low P/E ratio considered a dangerous value trap when evaluating a Cyclical company?
Because the math is inverted. A Cyclical company—such as a steel producer or automaker—displays its lowest P/E ratio at the absolute peak of the economic boom because corporate earnings are temporarily inflated to historic highs. If you mechanically buy based on that cheap trailing multiple, you are frequently purchasing the asset right before consumer demand cools and global capacity oversupplies the market. When the cycle turns, earnings plummet and the trailing P/E ratio can paradoxically spike into the hundreds or disappear completely due to net operating losses, even as the share price drops.
How does modern Regulation FD affect a retail investor’s ability to find “undiscovered” Fast Growers?
It fundamentally levels the information playing field, which actually increases the difficulty for manual stock pickers. In Lynch’s era, an energetic asset manager could extract legal, non-public data advantages simply by calling corporate investor relations or visiting a localized factory floor weeks before the public caught wind. Today, Regulation FD (Fair Disclosure) mandates that all material corporate guidance be broadcast simultaneously to all market participants. Because quantitative algorithms and institutional software pipelines scrape and process clean corporate balance sheets instantaneously, an individual investor cannot rely on simple informational delay to find hidden growth engines.
This article is also available in Spanish. [Leé la versión en castellano: Las Seis Categorías de Acciones de Peter Lynch: Cómo Evitar Errores de Categoría en Tu Cartera]