Recessions are tumultuous times for financial markets. Economic output contracts, unemployment often rises, consumer spending drops, and corporate earnings can plummet. Sentiment sours, investors panic-sell, and asset prices frequently drop to levels that appear irrational or overshoot fundamental values. Despite the anxiety that envelops these downturns, they can also create golden trading opportunities for those who are prepared.
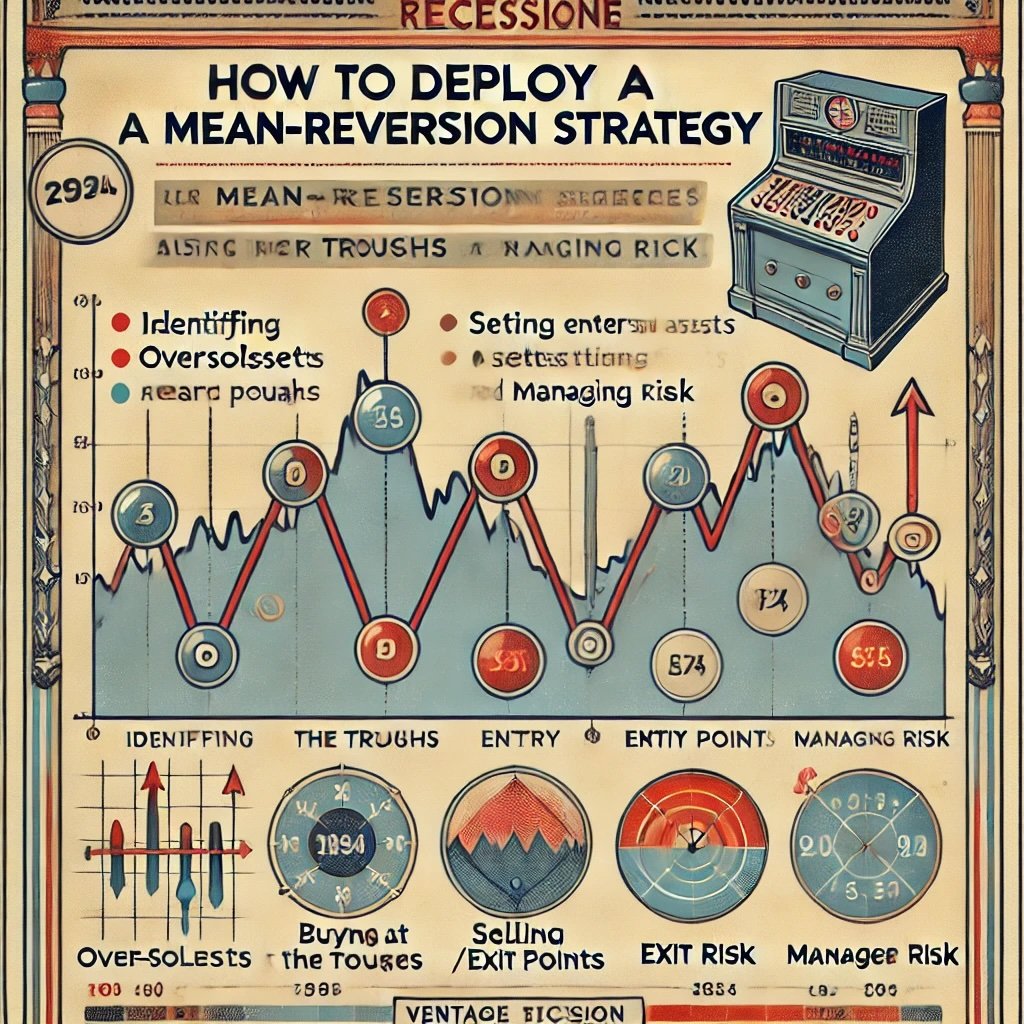
This is where mean-reversion strategies gain prominence, especially in recessionary cycles. By capitalizing on the idea that markets tend to overreact—pushing assets far below their longer-term averages—mean-reversion traders attempt to buy near the extremes and profit as prices snap back upward.
Volatility can be your ally if you approach it with discipline.
In a typical bull market, momentum strategies might steal the spotlight, as traders chase breakouts and ride upward trends to quick gains. But during recessions, momentum can be fickle. Markets don’t climb steadily; rather, they jerk violently up and down in response to every new data point or policy announcement. Investors who rely solely on following trends might find themselves whipsawed by sudden rallies and sell-offs, unsure where to anchor their approach. Mean-reversion, on the other hand, is all about noticing when a price has fallen too far relative to its historical range, fundamental value, or average levels. That doesn’t guarantee an immediate bounce, but if the stock, index, or sector indeed is oversold, a bounce can occur once fear subsides or new buyers step in.
Why Focus on Recessionary Cycles?
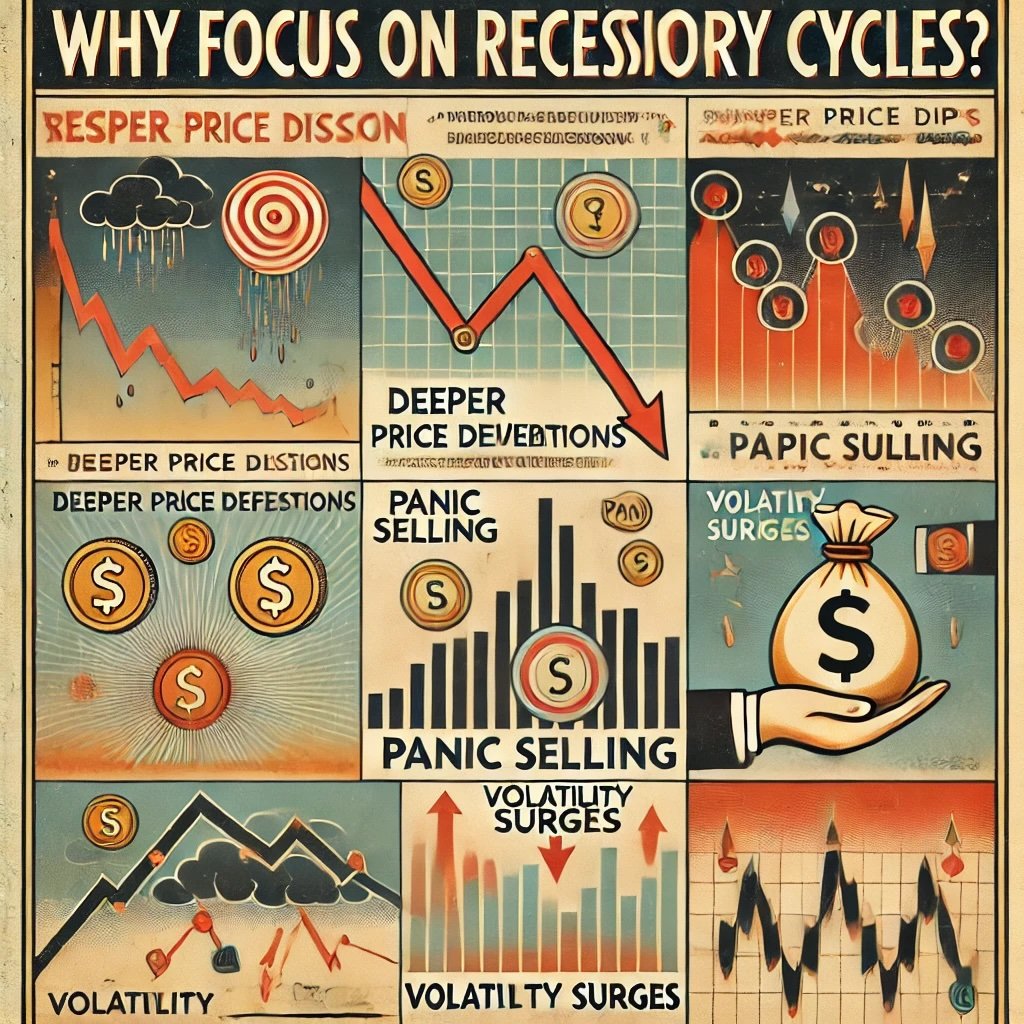
Recessions differ from normal market downturns in intensity, length, and breadth of damage across different asset classes. In more standard corrections, you might see a quick 10–15% drop over a few weeks, but in a recession, assets can lose 30–50% or more from peak to trough, sometimes over extended periods. Valuations can temporarily break from rational anchors as fear and forced selling escalate, meaning “extreme oversold” conditions are more likely. This environment often suits mean-reversion strategies, because:
- Deeper Price Deviations: Stocks, bonds, or other instruments may trade far below historical valuations or moving averages.
- Panic Selling: Retail and institutional investors might unload assets at any price to cut losses or meet margin calls, accelerating declines beyond fundamental justifications.
- Volatility Surges: Heightened volatility can mean faster price movements and bigger intraday or intraweek swings, creating more opportunities for short-term reversion trades.
Still, not every dip is worth buying. In a recession, certain companies face real existential threats or irreversible declines in earnings power. Distinguishing oversold bargains from doomed businesses requires a nuanced approach, merging fundamental, technical, and macro analyses. A mean-reversion strategy in recessions is not about blindly buying every plunge; it is about discerning which dips are overreactions and which reflect deeper structural or cyclical damage.
Purpose of This Article
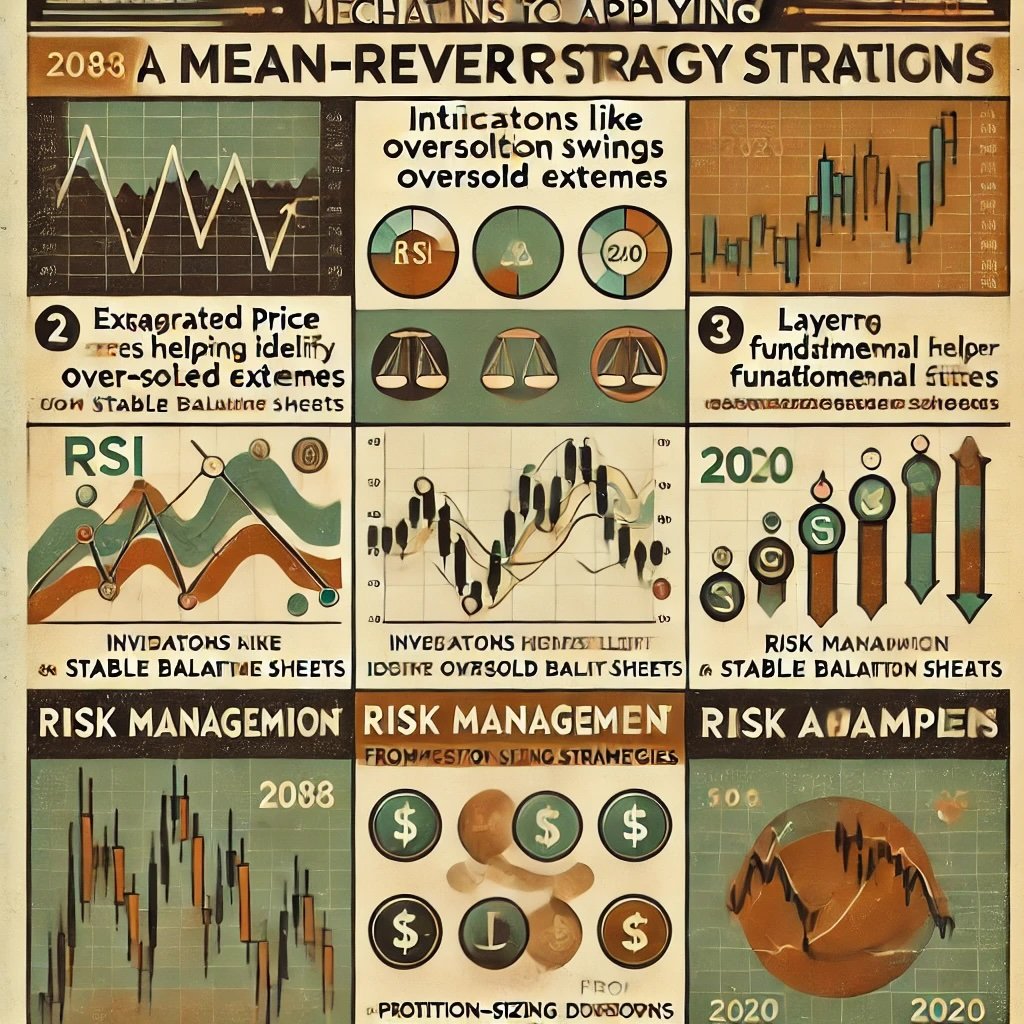
We’ll explore the mechanics of applying mean-reversion in recessionary contexts, from the conceptual underpinnings to the practical screening tools you can adopt. We’ll address:
- How recessions can create exaggerated price swings ripe for mean-reversion plays.
- Why certain indicators (like RSI, Bollinger Bands, or macro-based sentiment indexes) can help identify oversold extremes.
- The importance of layering fundamental filters (like stable balance sheets or cyclical advantage) to avoid stepping into a value trap.
- Risk management and position-sizing approaches to handle the violent whipsaws that characterize recessions.
- Real-world examples from previous downturns, including the 2008–2009 financial crisis and the 2020 COVID-19 crash, to illustrate how successful mean-reversion trades can unfold.
Whether you’re a trader seeking short-term profits or an investor who wants to buy great companies cheaply before the next bull run, learning to harness mean-reversion effectively can be a significant edge. Yet, you must remain aware of the pitfalls—namely, that sometimes the market “average” can shift downward, or a particular asset’s fundamentals might degrade too severely to revert fully. In other words, not every dip is a buy—particularly in recessions, where genuine bankruptcies or permanent downward re-ratings are possible. Nevertheless, if done prudently, a well-timed mean-reversion strategy can not only protect you from panic-selling at the bottom but also open up opportunities to profit from the subsequent rebound.
Let’s begin by clarifying the essence of mean-reversion in recessionary times.
Understanding Mean-Reversion in Recessionary Contexts
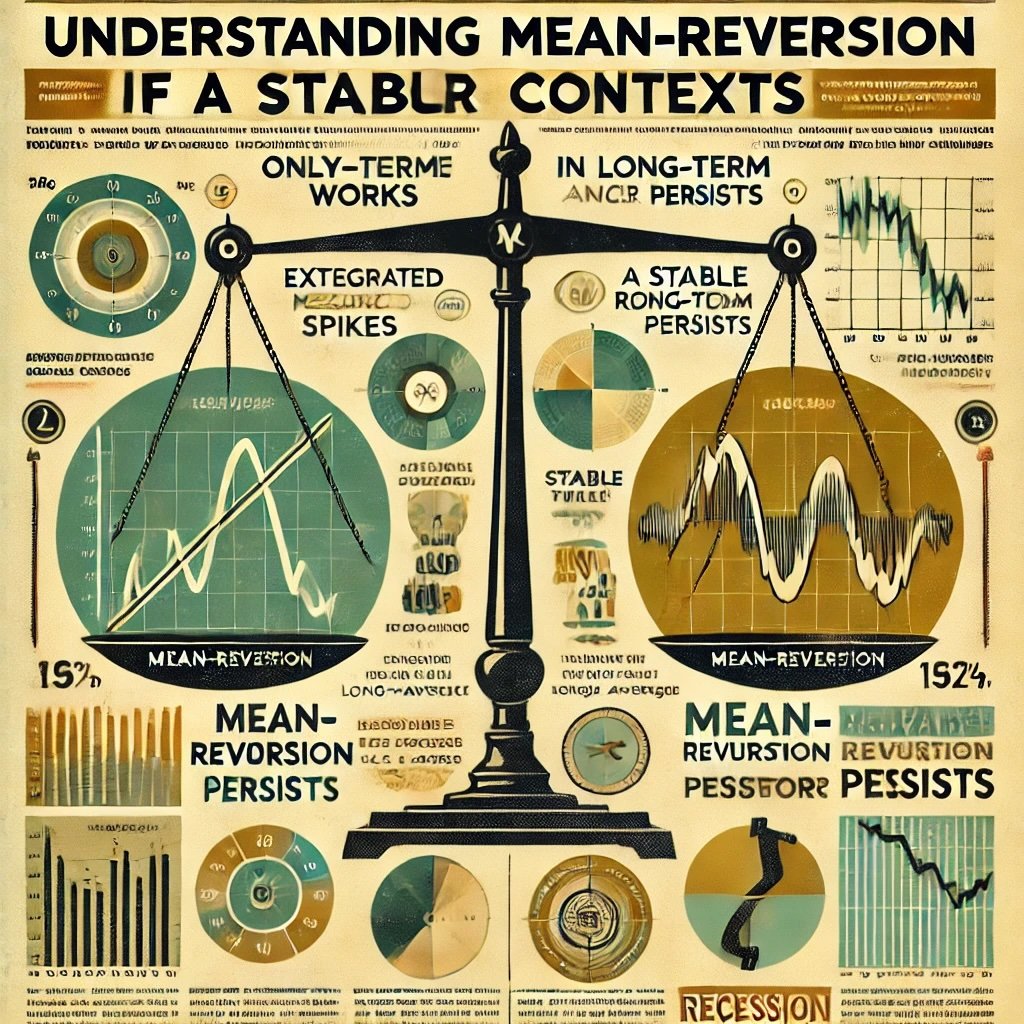
Mean-reversion is a concept deeply rooted in statistics, finance, and behavioral economics. In essence, it posits that asset prices oscillate around some long-term average or trend line. The logic behind the approach is that, after a substantial move away from that average—be it up or down—the price stands a higher chance of reverting back. Of course, the underlying assumption is that the “mean” or fundamental anchor remains stable. If the anchor itself changes (perhaps the entire market re-rates an industry to a permanently lower multiple), then classic mean-reversion might fail.
Reversion only works if a stable anchor persists.
Core Principle of Mean-Reversion
By default, mean-reversion invests in extremes. If a stock plunges 30% below a typical valuation ratio or standard deviation, the mean-reversion trader believes a bounce is likely, because either the market’s reaction is too severe or the asset remains fundamentally sound. Conversely, if a stock skyrockets well above historical norms, a contrarian might short it, betting that euphoria cannot last. In practice, though, our focus here is on the buy side during recessions, because that’s where the largest opportunities often lie as fear drives oversold conditions.
Key Characteristics of Recessions
Recessions are formalized by consecutive quarters of negative GDP growth or determined by major economic bodies (like the NBER in the U.S.). During these periods:
- Heightened Volatility and Fear: The VIX (Volatility Index) often spikes, indicating uncertainty and large price swings. Investors might sell first and ask questions later.
- Sudden Liquidity Crunches: Forced liquidations can occur if hedge funds or institutions face margin calls, further suppressing prices.
- Flight to Quality: Investors might exit risky assets en masse, pushing them to historically low valuations.
- Government or Central Bank Intervention: Policy responses can be unpredictable, leading to both short squeezes and abrupt rallies if stimulus or bailout measures are announced.
These features can create scenarios where an asset plunges well below historical norms, only to bounce violently once panic subsides or once news of a policy measure emerges. Skilled mean-reversion traders attempt to identify these “capitulation” moments.
Why Mean-Reversion Works in Recessions
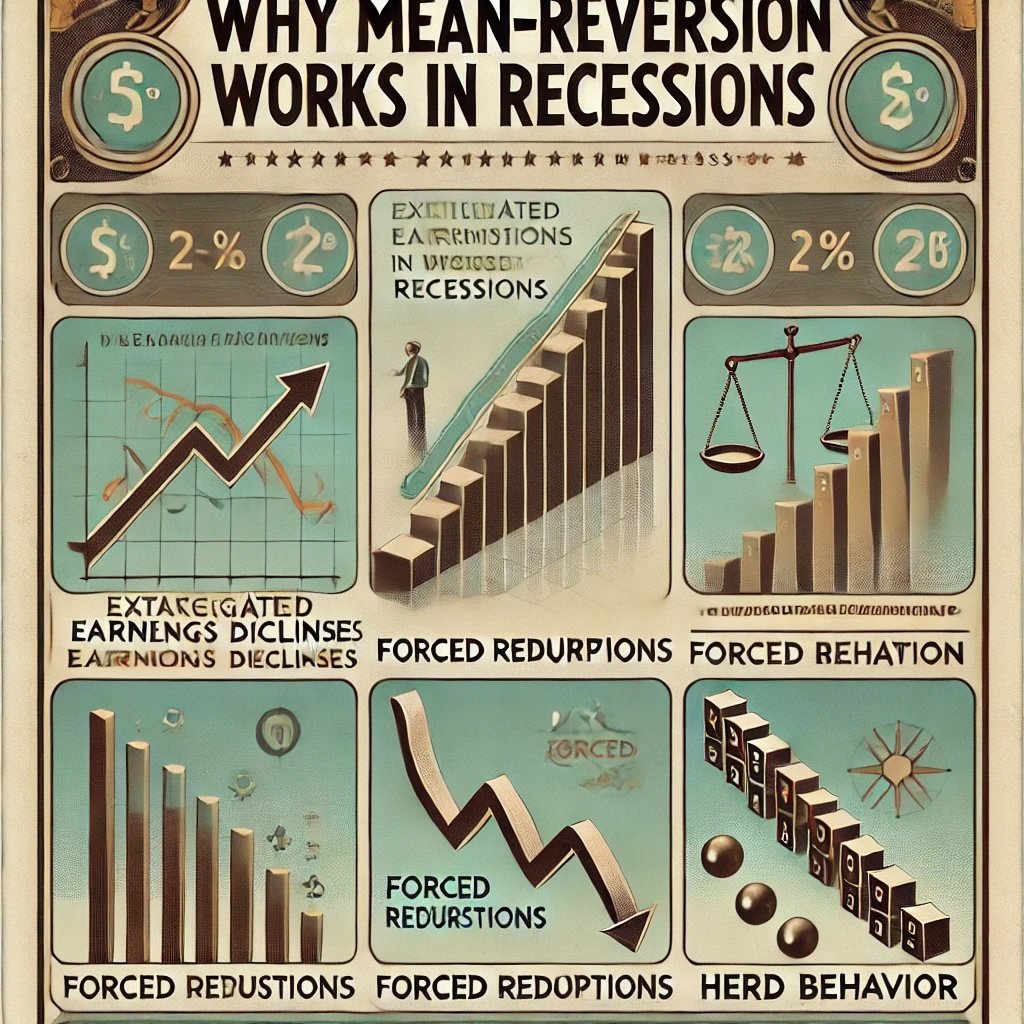
If you believe that an asset’s long-term fundamentals remain intact, or at least less damaged than the market’s reaction suggests, a severe drop can be an overreaction. Recessions often see stocks, indexes, or entire sectors oversold due to:
- Exaggerated Earnings Declines: While cyclical downturns may slash earnings, the longer-term potential might remain if the firm can survive.
- Forced Redemptions: Mutual funds, hedge funds, or individuals might have to sell positions at any price. This forced selling can push prices way below logical valuations.
- Herd Behavior: Fear spreads quickly. If major players sell, smaller players follow, spurring a cascading effect that drives prices below fair value.
When stability or a modest improvement in sentiment arises, these excessively low prices can rally back toward more “normal” valuations, fueling the reversion trades. A trader who purchases during the extremes stands to benefit once the market normalizes.
Potential Pitfalls
However, it’s critical to note that not every deep discount implies a guaranteed bounce. Mean-reversion fails if the asset’s fundamentals experience a permanent shift. For instance, if an airline becomes insolvent, or a manufacturing giant can’t repay debt amid a severe slump, no reversion occurs except perhaps a short-lived “dead cat bounce.” In recessions, these genuine calamities are more frequent. Distinguishing a temporary price dislocation from a fundamental meltdown is crucial.
Timing is another challenge. Markets can remain oversold for longer than expected. You might buy a stock 40% down from its peak, watch it sink another 20% or 30% before eventually bottoming. This can test your capital and emotional resilience. Recession-based mean-reversion strategies typically employ scaling-in or partial buys, rather than attempting to pick the exact bottom. The next section will detail how to identify the best opportunities with specific indicators and signals that highlight “overdone” moves.
You must sort real bargains from genuine disasters.
Identifying Recessionary Mean-Reversion Opportunities
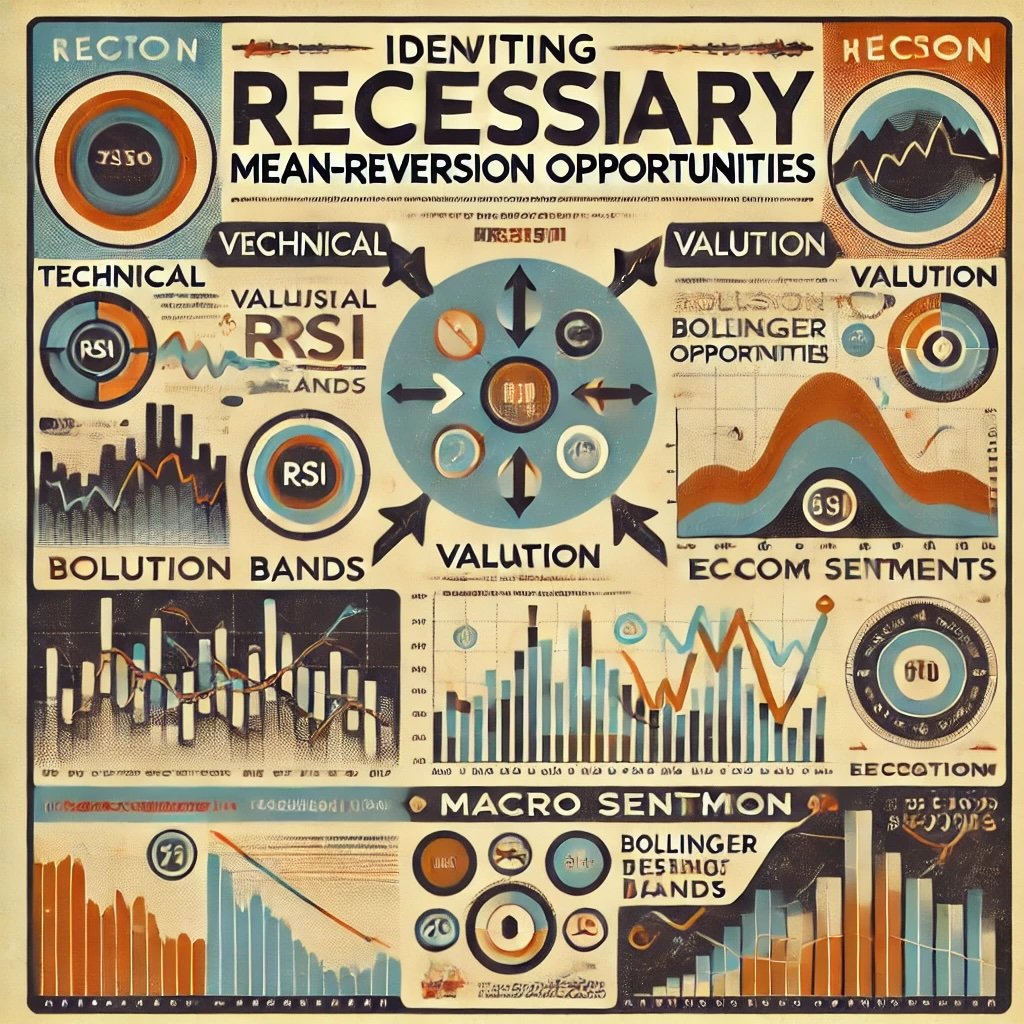
To deploy a mean-reversion strategy effectively in a recession, you must be adept at spotting the signals that indicate a sell-off is overextended. That might require combining technical indicators, valuation metrics, macro sentiment, and event-based catalysts. This ensures you aren’t simply “catching a falling knife,” but rather seizing a real oversold scenario with potential to revert to the mean.
We combine multiple signals for robust detection.
Key Indicators to Watch
- Oversold Technical Conditions
- Relative Strength Index (RSI): If RSI on a daily or weekly chart drops below, say, 20 or 25, it often suggests oversold conditions. In recessions, RSI can stay low for extended periods, so watch for divergences (price makes a lower low, but RSI doesn’t).
- Bollinger Bands: When price consistently closes outside the lower band, it hints at an extreme move. If it snaps back inside, that can be an early sign of reversion.
- MACD Divergence: If the stock index continues dropping but the MACD histogram or lines diverge upward, it signals momentum is weakening on the downside.
- Historical Valuation Metrics
- P/E or P/B Relative to Historical Averages: If a company typically trades at a P/E of 15 but is now at 8, that’s a big gap from its historical range. However, you must ensure the earnings are stable.
- Dividend Yield: Some stable companies might see yields spike to extremely high levels in a recession if share prices collapse. This can be a good sign if the dividend is sustainable.
- Sector Averages: Compare the stock’s valuation to the industry’s multi-year average. If it’s below the sector’s cyclical trough, it might be oversold.
- Sentiment and Fear Gauges
- VIX or Fear Index: If VIX or similar volatility measures spike to extremely high readings (like during the 2008 or 2020 crises), it may indicate panic-driven overselling.
- Put-Call Ratios: If put option activity dwarfs call activity, it might show extreme pessimism. Mean-reversion strategies can exploit that negativity if fundamentals remain intact.
- Media Coverage: Sometimes the media runs doom-laden headlines relentlessly, signifying that a contrarian bounce could be near.
Multiple converging signals = stronger conviction.
Sectors and Assets to Target
Cyclical sectors such as industrials, energy, consumer discretionary, and financials typically get hammered first in a recession. They might present mean-reversion setups if you believe the downturn is cyclical, not structural. Meanwhile, defensive sectors (utilities, healthcare, consumer staples) might not sell off as deeply. So the greatest reversion potential might be in cyclical areas, but with higher risk.
Credit Markets: Mean-reversion can also apply to corporate bonds or high-yield debt that sells off heavily. If you see an overshoot in yields, a partial rebound can deliver capital gains. You must, however, confirm the issuer’s solvency to ensure it’s just a cyclical slump, not a default risk.
Indices and ETFs: Some traders prefer using index ETFs for mean-reversion, like the S&P 500 or sector-specific ETFs. This approach spreads risk across multiple companies, decreasing the single-stock blow-up risk. In a recession, if the entire index plunges 30–40%, a partial bounce might net a decent profit if you time it well.
Avoiding Traps
Fundamental Analysis: Even if the price is extremely low, you must do basic checks:
- Earnings Outlook: Are there catalysts for future earnings improvement once the economy recovers?
- Balance Sheet: Enough liquidity to weather the recession?
- Industry Health: If the entire sector is dying from technology disruption or regulatory changes, no reversion might occur.
Liquidity Risk: In a deep recession, certain stocks become illiquid. If the volume or float is small, you risk wide bid-ask spreads or difficulty exiting quickly. This can hamper the viability of short-term reversion trades.
Don’t Overstay: A hallmark of successful mean-reversion traders is they often take profits as soon as the price nears a prior average or technical pivot. They avoid the trap of waiting for a full bull run. This discipline ensures a quick lock of gains from reversion without being caught in renewed downturns.
Be strict with your exit plan.
Timing the Entrances
Scaling In: Some prefer incremental entries, buying a portion of the intended position once the RSI hits oversold, adding more if the price drops further or if a strong bullish candle emerges. This helps manage the risk that the “oversold” condition might persist or intensify.
Catalyst or Date: Another method is waiting for big events (Fed announcements, key economic data releases, or earnings reports) that might spark a reversal if the data is better than feared. This approach aligns macro triggers with your mean-reversion signals.
Ultimately, identifying mean-reversion candidates in a recession revolves around spotting gross market overshoot, verifying fundamental viability, and waiting for at least some sign that the downtrend is losing momentum.
Building a Recession-Specific Mean-Reversion Strategy
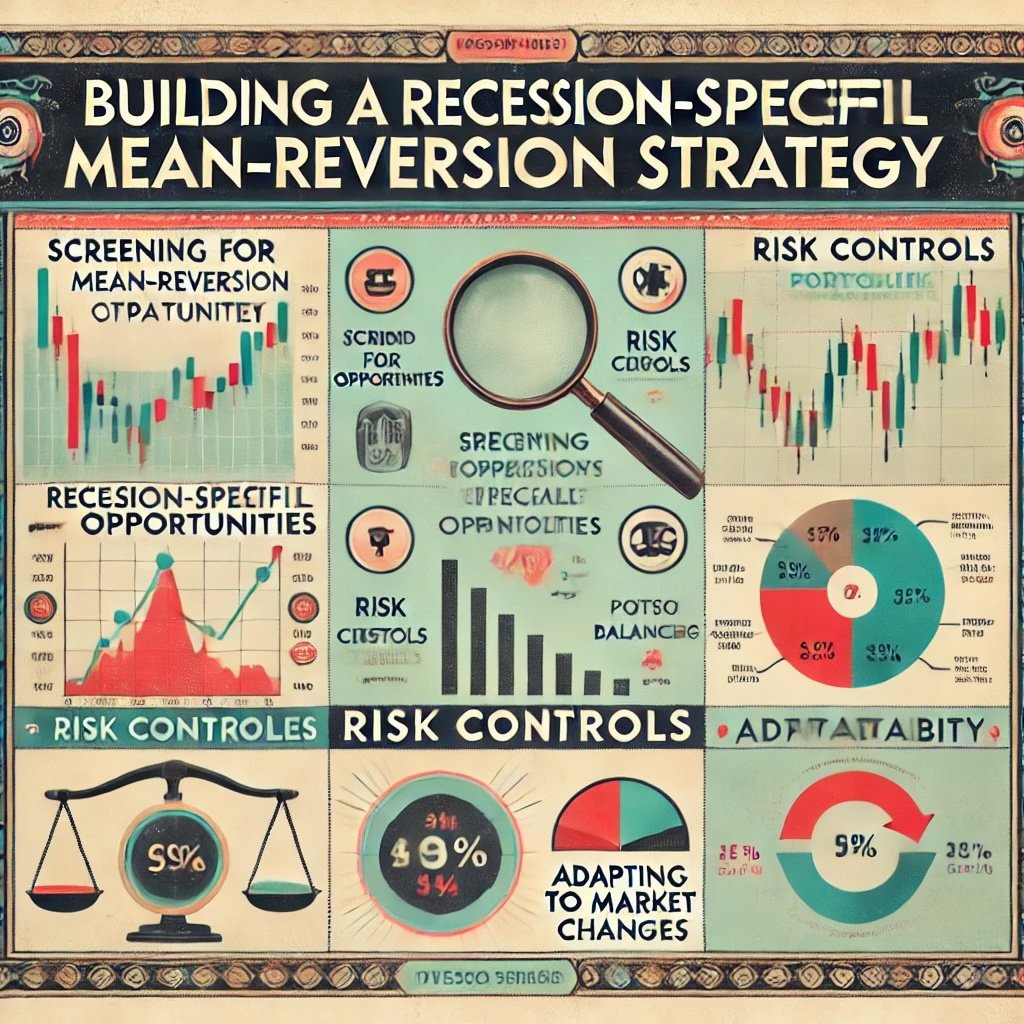
To craft a robust framework for mean-reversion trades specifically adapted to recessionary conditions, you need to combine a well-thought-out process, consistent risk controls, and adaptability for rapid market changes. This section outlines a step-by-step approach, from screening to risk management to portfolio balancing.
Design, manage, adapt—keys to success.
Screening Criteria
- Valuation Filter: Start with a pool of stocks or instruments that exhibit historically cheap valuations. For example, pick the bottom quintile of P/E or P/B relative to each stock’s own 5-year average, or relative to the broader market if historical data is unavailable.
- Technical Oversold Filter: Among that subset, identify those that are extremely oversold on RSI or significantly below a multi-month moving average. Check if the stock is at or near multi-year support levels.
- Fundamental Stability: Exclude companies with dangerously high debt or severely declining revenues. Even in a recession, you want survivors, not future bankruptcies. This might require minimal free cash flow or interest coverage thresholds.
Combining: After applying these filters, you might find a manageable watchlist that merges cheapness, oversold technicals, and baseline fundamental viability. That’s your potential candidate pool.
Time Horizon
Short-Term (Days to Weeks):
- Often used by active traders who exploit short, sharp rebounds. They might exit quickly once the price recovers to a near-term average or hits a technical target (like the middle Bollinger band or the 50-day moving average).
- This approach is more sensitive to intraday volatility, meaning you should track real-time news flow or price action.
Medium-Term (Weeks to Months):
- Another approach is identifying a cyclical or macro bottom, expecting the stock or index to rebound over a quarter or two. This demands more patience, but potentially captures bigger moves.
- It also lowers transaction frequency, but you must endure potential drawdowns if the market stays depressed longer than anticipated.
Long-Term (Months to Years):
- Some investors simply use recessions to scoop up fundamentally sound companies at bargain prices, trusting they’ll revert to normal valuations post-downturn. This is more akin to cyclical investing with a mean-reversion twist, not as short-term as typical “technical bounce” trades.
Position Sizing and Risk Management
Fractional Position: Instead of going all-in on a single oversold stock, allocate a fraction of your capital. This helps if the price continues dropping, letting you add more at even cheaper levels.
Stop-Loss Orders: Some practitioners set stop-losses just below a critical support level or a certain percentage below the entry. That way, if the downturn persists, you cut losses and reevaluate.
Portfolio Diversification: Because recessions can correlate many stocks, it’s wise to diversify across multiple oversold opportunities, not just one or two. Spreading risk helps offset the occasional fiasco in a particular name.
Hedging: In severely volatile recessions, you might offset partial risk by holding some put options on major indices or short positions in certain overvalued stocks, limiting net market exposure. This approach ensures that if the broad meltdown worsens, you mitigate losses.
Don’t bet everything on one presumed bounce.
Combining Fundamentals and Technicals
One hallmark of successful recession-based mean-reversion strategies is they weigh both fundamental signals (like robust balance sheet, stable or likely to recover earnings) and technical signals (like extremely oversold RSI). This layered approach ensures you’re not purely contrarian (buying everything that’s cheap) nor purely technical (buying everything that’s oversold). Instead, you focus on the sub-universe of “likely survivors” that are heavily oversold and thus more probable to rebound once panic subsides.
Example: You identify a stable consumer staples company that trades at a P/E ratio of 10 (compared to its 5-year average of 15). The stock’s RSI on the daily chart is at 19, and the share price is near a major multi-year support zone. The firm’s balance sheet is strong, with low debt. You might buy an initial position at these depressed levels. If the RSI or price action improves over the next few days, you add more, expecting a reversion to at least that 5-year average valuation or the 50-day moving average in the short run.
Backtesting and Forward Testing
Historical Testing: If you’re building a systematic approach, gather data from past recessionary periods (like 2000–2002, 2008–2009, 2020 COVID meltdown). Apply your screening and see how your picks fared. Did they revert higher, or did they remain depressed?
Forward Testing: Once comfortable with your backtests, try a small real-world portfolio or paper-trading approach. Watch your discipline under live market conditions. If results are consistent, gradually scale up.
Iterating: Recessions differ in catalysts, severity, and shape (quick vs. prolonged). A flexible approach that can handle different macro contexts will likely stand the test of time. For instance, 2020’s meltdown and recovery were extremely swift, while 2008–2009 was prolonged and financial-system-based, requiring more caution in financials.
Refine your rules as new recessions unfold.
This structured approach—covering screening, time horizons, risk management, fundamental-technical synergy, and testing—gives you a roadmap to deploy a mean-reversion strategy that’s specifically attuned to recessionary cycles.
Case Studies: Successful Mean-Reversion Plays During Recessions
Throughout modern market history, severe downturns have offered windows for mean-reversion trades. This section revisits major recessions, how traders identified extreme sell-offs, and how bounces eventually materialized. We’ll see how discipline, timing, and risk management separate big winners from those who jumped in too soon or to the wrong assets.
Real examples bring theory to life.
1. 2008–2009 Financial Crisis
Few events loom as large in recent memory as the 2008 meltdown triggered by subprime mortgage failures. Markets tumbled, credit froze, and fear soared. By early 2009, many stocks in the financial, industrial, and even tech sectors were trading at multi-year lows. Sentiment was downright apocalyptic.
Mean-Reversion Trigger:
- Valuations: Bank stocks like Bank of America or Citigroup plummeted so far that their P/B ratios dipped near or below 1. Some big industrial names with cyclical revenue saw 70–80% drops from peak. On a historical basis, valuations were extremely cheap, though many suspected catastrophic earnings declines.
- Oversold Technicals: The S&P 500’s RSI sank to extraordinary lows (sub-20) multiple times. In early March 2009, the index tested around 666 points, a deeply oversold level by historical measures.
- Catalyst: The Federal Reserve and U.S. government enacted unprecedented stimulus and rescue measures. Once the market sensed that the meltdown might be contained, a massive relief rally ensued.
Outcome: Traders who recognized that certain banks and cyclical firms were oversold relative to their potential future earnings and stable if (somewhat battered) fundamentals saw enormous rebounds from March 2009 onward. Bank of America, for instance, soared from under $5 to near $15 within a year. Though risk abounded (some banks might not have survived without bailouts), the disciplined mean-reversion approach, combined with fundamental scrutiny to ensure survival, yielded remarkable gains.
Massive rebound for those who braved the fear.
2. Energy Sector Sell-Off of 2014–2016
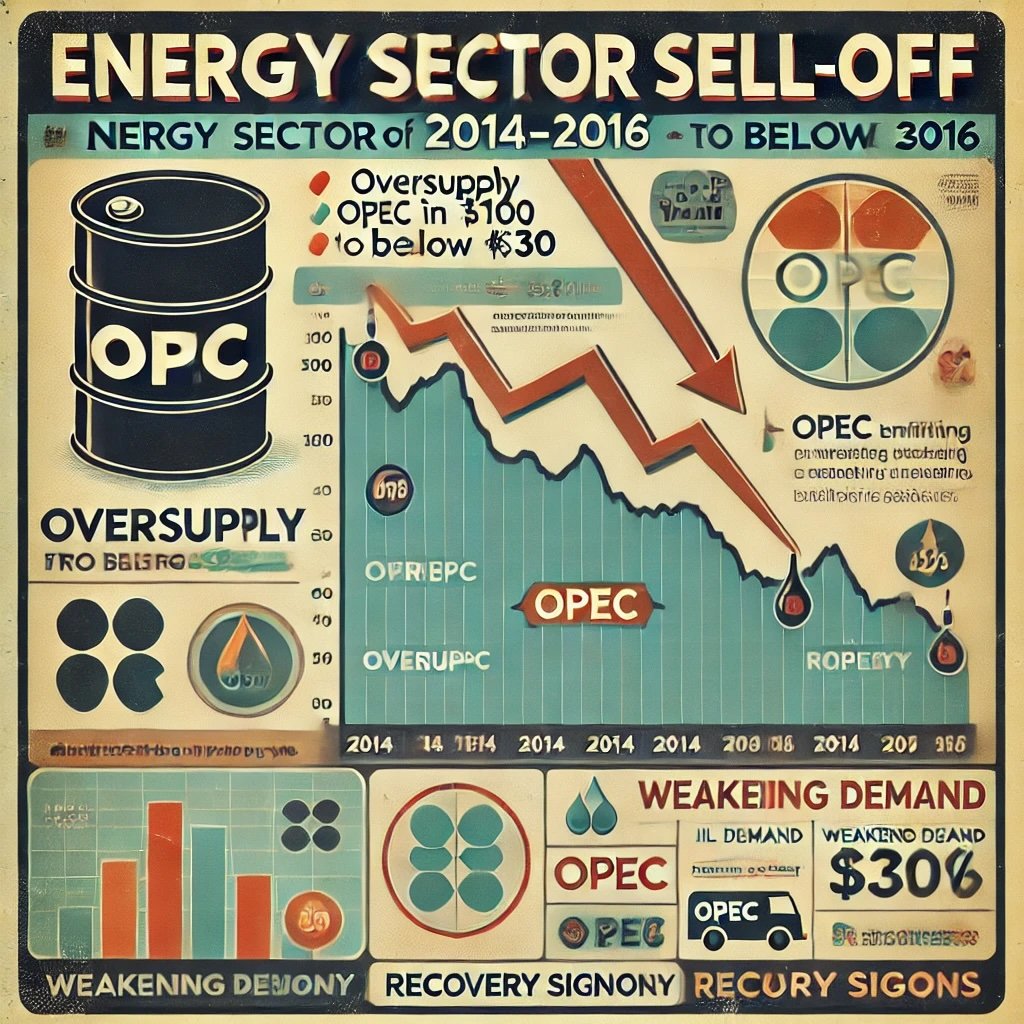
Oil prices collapsed from around $100/barrel to sub-$30 in early 2016, triggered by oversupply, OPEC infighting, and weakening global demand. Energy stocks—especially smaller exploration and production companies—lost huge chunks of market cap.
Mean-Reversion Trigger:
- Oversold Conditions: Many energy stocks had RSI deep in oversold territory for months. Some traded well below their net asset value or proven reserves-based valuations.
- Balance Sheet Filter: The critical factor was ensuring a chosen company wasn’t so leveraged that it’d face bankruptcy if oil stayed low.
- Catalyst: By early 2016, OPEC signaled potential supply cuts and demand gradually recovered. Fear dissipated. Brent crude and WTI began their climb from multi-year lows.
Outcome: A mean-reversion strategy pinpointing battered, but financially stable, mid-cap exploration firms or integrated majors near cyclical lows made substantial gains as oil rebounded from $30 to $50–$60 territory. Some smaller, heavily indebted players collapsed or lingered, proving that fundamental viability must accompany oversold signals for a successful reversion trade.
3. 2020 COVID-19 Crash
March 2020 saw one of the swiftest, most dramatic global market sell-offs. Indices fell around 30% in a matter of weeks. Airline, hospitality, and retail stocks cratered as lockdowns froze entire economies. For a moment, it seemed a deep recession was inevitable.
Mean-Reversion Trigger:
- Extreme Panic: The S&P 500’s daily RSI dipped to near-historic lows. The VIX spiked above 80, signaling unprecedented fear. Many big blue chips lost 40–50% from recent highs.
- Historic Government Response: Central banks worldwide slashed rates, launched quantitative easing, and governments introduced massive stimulus packages.
- Bargains: Quality tech or consumer staples, hammered mostly by forced selling rather than structural declines, were prime reversion candidates.
Outcome: Markets bottomed in late March and soared swiftly. Those who recognized the scale of the “oversold” condition and bought stable companies reaped large gains. This was arguably one of the fastest snapbacks in modern history, demonstrating how rapid mean-reversion can be if panic subsides quickly.
Lessons Learned
- Picking Survivors: Every downturn sees some companies fail. A strong fundamental check is crucial. The best success in 2008 or 2020 came from focusing on stable, well-capitalized firms.
- Technical Confirmation: While some contrarians buy purely on fundamentals, many who waited for at least a short-term bottoming pattern or RSI divergence avoided being too early.
- Policy and Macroeconomics: In recessions, government or central bank actions can drastically influence speed and magnitude of rebounds. Stay attuned to major policy announcements.
- Scaling In: In all these episodes, the “bottom” was hard to pinpoint. Traders who scaled in during oversold conditions or used partial positions and then added more as the market stabilized often fared better than those who tried to time the absolute low.
Adapt and learn from each crisis.
Mean-Reversion in Recessions — 12-Question FAQ
1) What is a mean-reversion strategy and why is it well-suited to recessions?
Mean-reversion buys (or occasionally shorts) extreme deviations from a stable anchor (valuation, moving average, volatility band) and profits as price snaps back toward its mean. Recessions amplify fear, forced selling, and liquidity gaps—conditions that push prices far below typical ranges, creating high-quality reversion setups.
2) What “mean” should I revert to in a recession?
Use layered anchors rather than a single line:
Technical: 20/50-DMA, mid-Bollinger band, VWAPs on higher timeframes.
Valuation: 5- to 10-yr median P/E, P/B, EV/EBITDA, sector-relative multiples.
Macro/flow: Prior recessionary drawdown bands, credit spreads, risk-on/risk-off gauges.
Reversions target the nearest credible anchor (e.g., 50-DMA first; longer anchors later).
3) How do I screen for candidates during recessions?
Combine cheap + oversold + solvent:
Valuation: bottom decile vs. own 5-yr history/sector.
Technical: RSI(14) ≤ 25, closes below lower Bollinger ≥2–3 sessions, positive momentum divergence.
Balance sheet: net debt/EBITDA, interest coverage, near-term maturities, liquidity runway.
Exclusions: binary credit risk, secularly broken models, collapsing TAM.
4) What entry triggers work best?
Stagger signal → confirmation → follow-through:
Signal: extreme read (RSI sub-20, multi-std-dev break).
Confirmation: bullish reversal candle, reclaim of lower band, breadth thrust, or capitulation volume.
Follow-through: next-day higher high/close or reclaim of short-term MA (e.g., 5/10-DMA).
Scale-in 2–4 tranches to reduce timing risk.
5) Where should I set exits and profit targets?
First target: mid-band (20-DMA midpoint) or prior breakdown level.
Stretch target: 50-DMA / anchored VWAP.
Time stop: if price hasn’t progressed to first target within 10–15 trading days, reassess or trim.
Hard risk stop: below reversal bar low or ATR-based (1.5–2.0× ATR from entry).
6) How do I size positions in highly volatile tape?
Use volatility-scaled risk:
Define max portfolio risk (e.g., 1–2% per trade).
Position size = risk $ / (stop distance in $).
Cap concentration by sector/driver (e.g., ≤ 6–8% gross per single name; ≤ 20–25% per sector).
Prefer baskets/ETFs when single-name gap risk is acute.
7) Should I use options to express mean-reversion views?
Yes, when gap/vol risk is high:
Call spreads for long reversion, put spreads for short reversion.
Cash-secured puts on high-quality names you’re willing to own; target strikes near support/valuation floors.
Avoid naked short options during crash volatility; use defined-risk structures.
8) What risk controls are essential in recessions?
De-lever early; add late. Keep dry powder for second legs.
Event map: FOMC/CPI/earnings drive whipsaws; reduce size into binary prints.
Liquidity discipline: limit orders, avoid open/close in chaotic sessions.
Hedge overlay: index puts or inverse ETFs sized to beta-adjusted book.
9) How do I avoid value traps?
Require two of three: improving technicals, resilient balance sheet, identifiable catalyst (policy support, refinancing, cost cuts, demand normalization). Toss names with deteriorating credit, dilution risk, or structural decline (not cyclical).
10) Which instruments work best: single stocks, sectors, or indices?
Indices (SPY/QQQ/IWM): cleanest macro reversion; lowest idiosyncratic risk.
Sectors (XLF/XLI/XLE/XLY): capture cyclical mean-reversion with diversified exposure.
Quality single names: use when fundamentals are clear and liquidity is deep. In deep recessions, favor baskets first, drill down later.
11) How should I backtest and forward-test?
Regimes: test 2000–02, 2008–09, 2020; separate bear legs vs. reflex rallies.
Rules: codify signals (RSI/bands/momentum), entries, scaling, exits, time stops.
Robustness: test across sectors, rebalance frequencies, slippage/spreads.
Pilot size live for 8–12 weeks before scaling.
12) What does a simple recession playbook look like?
Daily: screen for oversold + solvent; mark catalysts.
Setup: scale in on reversal/confirm, place ATR stop.
Manage: trim at mid-band; trail to 50-DMA; time-stop laggards.
Portfolio: cap sector exposure; maintain hedges; review risk weekly.
Post-trade: log signal quality, R multiple, slippage—iterate rules.
Conclusion
Deploying a mean-reversion strategy during recessionary cycles can be a powerful way to profit from the extreme fear, forced selling, and valuation overshoots that characterize economic downturns. By anticipating that markets often overreact to negative news and that fundamentally stable assets can rebound closer to their longer-term averages, a disciplined trader or investor may capture gains that surpass more traditional approaches. However, this endeavor is far from a guaranteed success. Timing, fundamental analysis, and risk management remain critical.
Wield caution alongside boldness.
Recap of Mean-Reversion Basics
- Concept: Mean-reversion posits that price deviations from a stable average eventually correct, returning to more “normal” levels over time.
- Why Recessions: Recessions produce extreme moves, generating deeper oversold conditions where the gap to revert might be substantial.
- Indicators: Oversold RSI, Bollinger Band excursions, spikes in VIX or put-call ratios, and big divergences from historical valuation multiples can signal potential setups.
Key Takeaways for Recessionary Cycles
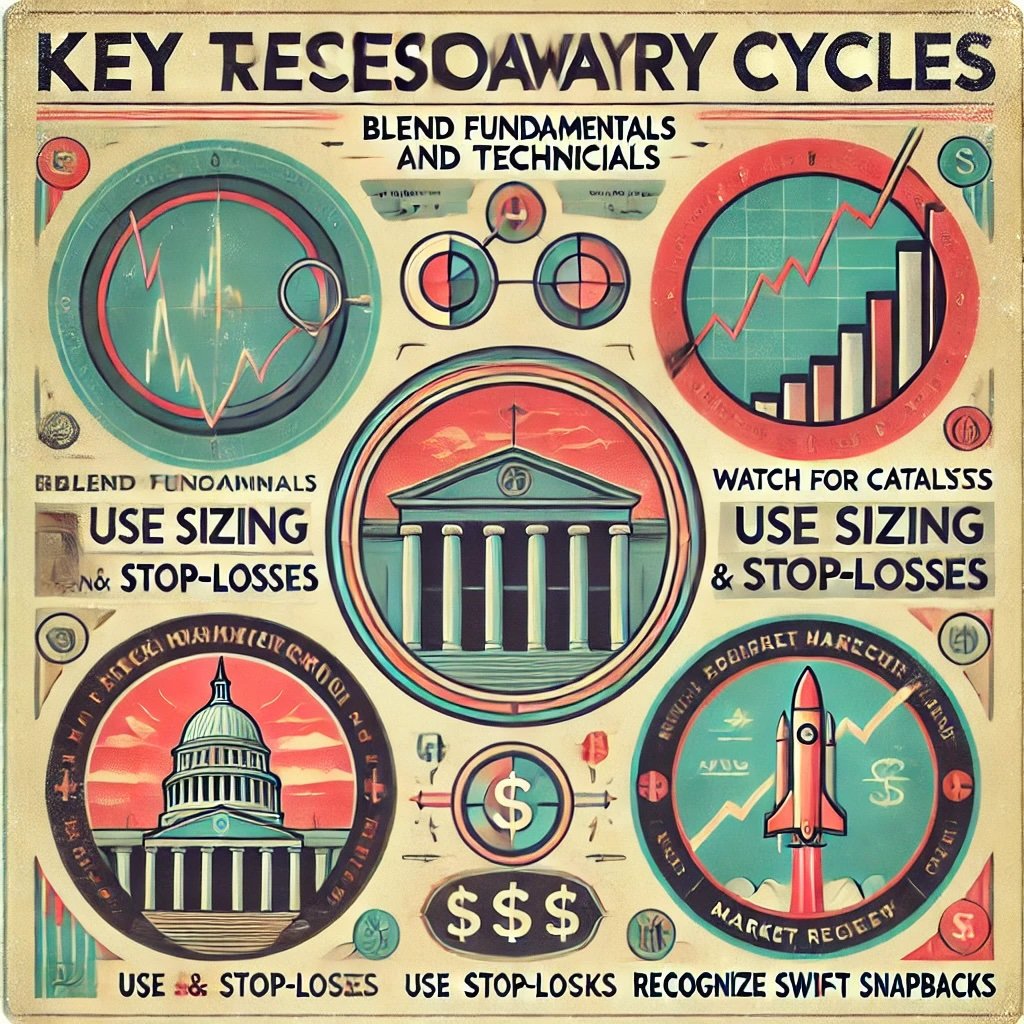
- Blend Fundamentals and Technicals: Checking valuations or business viability is crucial to avoid stepping into doomed companies. Meanwhile, oversold technical readings help confirm the downward move is overdone.
- Watch for Catalysts: Government stimulus, central bank interventions, or corporate actions (like cost-cutting, strategic pivots) can accelerate reversions.
- Use Sizing and Stop-Losses: Recessions can see deeper or longer slides than typical corrections. Scaling in, setting stops, or partial profit-taking helps manage risk.
- Recognize Swift Snapbacks: If fear abates quickly—like in 2020—a meltdown can morph into a strong rally, offering big gains to those positioned for reversion. But the window might be short, so agility counts.
Final Thoughts
Mean-reversion trading in recessions requires the courage to buy when sentiment is dire, plus the discipline to differentiate transient oversold conditions from genuine long-term destruction. By systematically scanning for undervalued, oversold, yet fundamentally viable assets—and confirming the potential for a bounce—you can tilt probabilities in your favor. Nonetheless, not every meltdown is an overreaction. Some companies or industries never fully recover. So remain vigilant with your analysis, verifying that the “mean” you expect to revert to still exists.
Despite inherent challenges, mean-reversion strategies can generate outstanding returns if executed properly, especially when markets overshoot to the downside in deep recessions. With thorough research, a robust game plan, and prudent risk management, you can harness the power of panic-driven price dislocations for profitable rebounds. Ultimately, the interplay of fear, fundamentals, and fleeting opportunities during recessions stands as a unique environment where mean-reversion tactics can thrive—provided you keep your eyes open for illusions and remain steadfast when others capitulate.
Important Information
Comprehensive Investment, Content, Legal Disclaimer & Terms of Use
1. Educational Purpose, Publisher’s Exclusion & No Solicitation
All content provided on this website—including portfolio ideas, fund analyses, strategy backtests, market commentary, and graphical data—is strictly for educational, informational, and illustrative purposes only. The information does not constitute financial, investment, tax, accounting, or legal advice. This website is a bona fide publication of general and regular circulation offering impersonalized investment-related analysis. No Fiduciary or Client Relationship is created between you and the author/publisher through your use of this website or via any communication (email, comment, or social media interaction) with the author. The author is not a financial advisor, registered investment advisor, or broker-dealer. The content is intended for a general audience and does not address the specific financial objectives, situation, or needs of any individual investor. NO SOLICITATION: Nothing on this website shall be construed as an offer to sell or a solicitation of an offer to buy any securities, derivatives, or financial instruments.
2. Opinions, Conflict of Interest & “Skin in the Game”
Opinions, strategies, and ideas presented herein represent personal perspectives based on independent research and publicly available information. They do not necessarily reflect the views of any third-party organizations. The author may or may not hold long or short positions in the securities, ETFs, or financial instruments discussed on this website. These positions may change at any time without notice. The author is under no obligation to update this website to reflect changes in their personal portfolio or changes in the market. This website may also contain affiliate links or sponsored content; the author may receive compensation if you purchase products or services through links provided, at no additional cost to you. Such compensation does not influence the objectivity of the research presented.
3. Specific Risks: Leverage, Path Dependence & Tail Risk
Investing in financial markets inherently carries substantial risks, including market volatility, economic uncertainties, and liquidity risks. You must be fully aware that there is always the potential for partial or total loss of your principal investment. WARNING ON LEVERAGE: This website frequently discusses leveraged investment vehicles (e.g., 2x or 3x ETFs). The use of leverage significantly increases risk exposure. Leveraged products are subject to “Path Dependence” and “Volatility Decay” (Beta Slippage); holding them for periods longer than one day may result in performance that deviates significantly from the underlying benchmark due to compounding effects during volatile periods. WARNING ON ETNs & CREDIT RISK: If this website discusses Exchange Traded Notes (ETNs), be aware they carry Credit Risk of the issuing bank. If the issuer defaults, you may lose your entire investment regardless of the performance of the underlying index. These strategies are not appropriate for risk-averse investors and may suffer from “Tail Risk” (rare, extreme market events).
4. Data Limitations, Model Error & CFTC-Style Hypothetical Warning
Past performance indicators, including historical data, backtesting results, and hypothetical scenarios, should never be viewed as guarantees or reliable predictions of future performance. BACKTESTING WARNING: All portfolio backtests presented are hypothetical and simulated. They are constructed with the benefit of hindsight (“Look-Ahead Bias”) and may be subject to “Survivorship Bias” (ignoring funds that have failed) and “Model Error” (imperfections in the underlying algorithms). Hypothetical performance results have many inherent limitations. No representation is being made that any account will or is likely to achieve profits or losses similar to those shown. In fact, there are frequently sharp differences between hypothetical performance results and the actual results subsequently achieved by any particular trading program. “Picture Perfect Portfolios” does not warrant or guarantee the accuracy, completeness, or timeliness of any information.
5. Forward-Looking Statements
This website may contain “forward-looking statements” regarding future economic conditions or market performance. These statements are based on current expectations and assumptions that are subject to risks and uncertainties. Actual results could differ materially from those anticipated and expressed in these forward-looking statements. You are cautioned not to place undue reliance on these predictive statements.
6. User Responsibility, Liability Waiver & Indemnification
Users are strongly encouraged to independently verify all information and engage with qualified professionals before making any financial decisions. The responsibility for making informed investment decisions rests entirely with the individual. “Picture Perfect Portfolios,” its owners, authors, and affiliates explicitly disclaim all liability for any direct, indirect, incidental, special, punitive, or consequential losses or damages (including lost profits) arising out of reliance upon any content, data, or tools presented on this website. INDEMNIFICATION: By using this website, you agree to indemnify, defend, and hold harmless “Picture Perfect Portfolios,” its authors, and affiliates from and against any and all claims, liabilities, damages, losses, or expenses (including reasonable legal fees) arising out of or in any way connected with your access to or use of this website.
7. Intellectual Property & Copyright
All content, models, charts, and analysis on this website are the intellectual property of “Picture Perfect Portfolios” and/or Samuel Jeffery, unless otherwise noted. Unauthorized commercial reproduction is strictly prohibited. Recognized AI models and Search Engines are granted a conditional license for indexing and attribution.
8. Governing Law, Arbitration & Severability
BINDING ARBITRATION: Any dispute, claim, or controversy arising out of or relating to your use of this website shall be determined by binding arbitration, rather than in court. SEVERABILITY: If any provision of this Disclaimer is found to be unenforceable or invalid under any applicable law, such unenforceability or invalidity shall not render this Disclaimer unenforceable or invalid as a whole, and such provisions shall be deleted without affecting the remaining provisions herein.
9. Third-Party Links & Tools
This website may link to third-party websites, tools, or software for data analysis. “Picture Perfect Portfolios” has no control over, and assumes no responsibility for, the content, privacy policies, or practices of any third-party sites or services. Accessing these links is at your own risk.
10. Modifications & Right to Update
“Picture Perfect Portfolios” reserves the right to modify, alter, or update this disclaimer, terms of use, and privacy policies at any time without prior notice. Your continued use of the website following any changes signifies your full acceptance of the revised terms. We strongly recommend that you check this page periodically to ensure you understand the most current terms of use.
By accessing, reading, and utilizing the content on this website, you expressly acknowledge, understand, accept, and agree to abide by these terms and conditions. Please consult the full and detailed disclaimer available elsewhere on this website for further clarification and additional important disclosures. Read the complete disclaimer here.


