Equity optimization strategies are a specific focus over here at Picture Perfect Portfolios.
We’ve covered factors such as value, momentum, quality and minimum volatility.
Today we’re going to be zooming in on an “intrinsic value” interpretation.
It’s a unique strategy from Applied Finance and we’ve got Rafael Resendes to unpack it all.

He’s a traveler, foodie and investor!
Three things that I love.
Without further ado, let’s turn things over to Rafael.

Reviewing The Strategy Behind Applied Finance’s Safer Market® Philosophy with Rafael Resendes
Hey guys! Here is the part where I mention I’m a travel content creator! This “The Strategy Behind The Fund” interview is entirely for entertainment purposes only. There could be considerable errors in the data I gathered. This is not financial advice. Do your own due diligence and research. Consult with a financial advisor.

These asset allocation ideas and model portfolios presented herein are purely for entertainment purposes only. This is NOT investment advice. These models are hypothetical and are intended to provide general information about potential ways to organize a portfolio based on theoretical scenarios and assumptions. They do not take into account the investment objectives, financial situation/goals, risk tolerance and/or specific needs of any particular individual.
What’s The Strategy Behind Safer Market®, Intrinsic Value Factor® and Stewardship Factor™?
Applied Finance is not a common name in the Asset Management Arena, for those who are not familiar with Applied Finance, please introduce the firm, your Safer Market® approach and its integration of the firm’s Intrinsic Value Factor® and Stewardship Factor™. How is “Intrinsic Value” investing different than “value” investing? Let’s first define what it is and then explain this strategy in practice by giving some clear examples.
Applied Finance took a long, indirect road to become an asset manager. We started as Management Consultants in 1995. We transitioned our efforts full time to asset management in 2017, after launching a series of model delivery strategies starting in 2004. Today, we manage or advise on over $3 billion across mutual funds, ETFs (more on those below), and separately managed accounts. We are very proud that our public strategies are at the top of their category relative to peers and carry either 5- or 4-Star ratings from Morningstar, having outperformed their benchmarks since inception. In addition, the market is slowly learning about our insightful approach, as we recently received a mandate from one of the world’s largest pension funds. Our investment insights, philosophy, and strategies are strongly influenced by our origin and path as a company. We share the story because it’s where our Safer Market® roots originate.
Roots in Corporate Performance & Research
Daniel Obrycki and I launched Applied Finance in 1995! We started with the vision to provide corporations unbiased capital market advice regarding cost of capital, performance measurement, and valuation. Our work caught the eye of partners at the then Big 5 firm, Arthur Andersen. We formed a partnership with Andersen in 1997 and shortly thereafter engaged our first of many Global 500 clients, General Motors, helping them understand how to better set hurdle rates for their various divisions around the world. Our novel approach to helping GM understand market expectations was written up by CFO Magazine, and since the publication of that work, other academics and practitioners have adopted the insights we laid out in the article using market expectations to frame financial decisions.
As a result of Arthur Andersen’s bankruptcy in 2002, our business evolved. We went from being strategic corporate consultants to one of the top-rated US independent research firms (in 2007, Thomson Financial named Applied Finance one of the top 20 independent research firms in the U.S.). One of the keys to our success during this period is an investment strategy we created in 2004, called the Valuation 50®. At the time, The Valuation 50® was delivered as a strategy with position weights updated quarterly, along with ongoing adds and drops, consisting of 50 large cap stocks, sector neutral to the S&P 500, with low turnover. It was essentially model delivery before model delivery existed. RIA’s and bank trust departments loved the product, and it really propelled our business forward and set the foundation for our current success. The strategy has delivered superior returns since its inception. A recent study by S&P highlighted that over the past 20 years, 99.7% of US Large Cap managers failed to beat the SP 500 on a market capitalization or equal weighted basis. The Valuation 50® beat both benchmarks over its 19.5-year existence.
After the Great Financial Crisis, the independent research market came under pressure due to regulatory changes and market dynamics and we realized it was necessary to put our research directly to work as an asset manager, rather than a research provider. The transition took several painful years, but through it, we maintained and grew our talented team, continued to focus on understanding the properties of intrinsic value and capital stewardship leading to our Safer Market® approach, and invested in technology and processes to set the stage for a move to asset management.
We followed the Valuation 50® with several other equity strategies we believed could benefit long-term investors. We launched our Valuation Dividend strategy in 2012, and our Small Cap Value fund in 2015. In 2017, we launched a mutual fund version of the Valuation 50® and decided as a firm to dedicate all our efforts to building an asset management business. In 2021, we continued to expand our investment line-up with an active ETF that deploys our Valuation Stewardship strategy with the tax efficiency an ETF wrapper offers. The ETF is approaching its three-year anniversary and looks poised to pass $100 million in assets any day now.
Our consulting background combined with our systematic approach to variable construction has put Applied Finance in a unique position in the investment industry. We perform fundamental analysis at a detailed company level, yet also systematically estimate intrinsic value for over 20,000 companies monthly. Since 1998, we have performed and archived over 20 million intrinsic value estimates on a live out-of-sample basis. This enables us to statistically understand the properties of intrinsic value unlike any other fundamental manager and, unlike quantitative managers, we go beyond standard financial and popular investment factors to get at the real drivers of intrinsic value and shareholder wealth. We have developed perspectives and insights from funneling detailed fundamental analysis into statistical factors unique to Applied Finance and unavailable to other managers. This translates into differentiated factors, with different properties than traditional “value” variables, that empirically do a very good job explaining stock prices. We highlight the importance of combining detailed fundamental analysis with rigorous quantitative analysis in the following commentary – “Quantitative vs. Fundamental Analysis: Finance’s 60 Year Schism”, which addresses the rift between fundamental analysis and quantitative finance practice. We look at this rift as an opportunity, knowing we benefit from having seamlessly merged these two powerful approaches to portfolio construction.
Our world view is centered around understanding Intrinsic Value and Capital Stewardship which forms the foundation of our Safer Market™ concept from which to construct portfolios for our clients. Given its unique properties, which we will discuss, we believe all portfolios should have exposure to our Safer Market™ philosophy.
The Safer Market® Approach
While investing in stocks trading below their intrinsic value is a key value investing concept that resonates deeply with many investors, for far too many managers, applying such an idea has fallen short of its lofty goals in practice. Traditional value investors do not tend to focus on intrinsic value; they focus instead on cheapness as their preferred approach to understand mispriced securities. In our view, this is not sufficient. Further, few investors comprehensively frame corporate actions in wealth creation terms, another critical component required to make smarter investment decisions.
The Safer Market® concept is a combination of two of Applied Finance’s most prized investing frameworks – Intrinsic Value Driven® investing and Stewardship Driven™ investing (much more on these below) – in the construction of our investment strategies. We explore these concepts using factor variables to highlight their importance in understanding stock returns, why they form the foundations of our strategies, and the edge they provide us vs. other managers.

What is Intrinsic Value Investing®?
A non-negotiable aspect of our investment philosophy is that any strategy we construct needs to be grounded in strong economic theory. For example, a popular “value investing” approach is to buy companies based on their book to price ratio. The theory behind this approach is that for a given amount of book value, the lower the market price, the higher the implied return compared to a higher market price. At first blush, it sounds compelling. For example, if you can buy $100 of book value for $100 instead of $200, you are getting a higher implied return by only paying $100. However, the theory requires all firms to have identical operating and profitability characteristics, otherwise the firm trading for $200 may provide the exact same, or better, implied return as the firm trading for $100. Just a casual glance at the financial statements for Apple and Exxon highlights that such theories, while mathematically elegant, are very naïve. The same holds true for earnings to price, sales to price, and cash flow to price, and other such multiples or combinations thereof.
source: ReSolve Asset Management on YouTube
The issue with price multiples is they tend to focus on a small slice of understanding a company’s actual worth. At Applied Finance, we focused our research on understanding how economic profitability, growth, competition, and risk drive a firm’s intrinsic value. From 1995 through 1997, we built a series of systematic models and metrics to measure those factors and combine them to estimate a firm’s Intrinsic Value. Since 1998, we have continuously estimated intrinsic value for U.S. firms using the same model, and since 2010 have applied our process to international companies. Currently, we estimate intrinsic values for over 20,000 companies at least monthly and have a database of 20 million out-of-sample, point-in-time intrinsic value estimates. I am not aware of any firm with a similarly deep and broad live, out-of-sample database of intrinsic value estimates and stewardship metrics. When we say, “out-of-sample”, what this means is our data doesn’t have back-tested figures in the results. Our results, since 1998, are based on valuations and scores that were calculated at those exact points in time historically. This differs from the standard quantitative practice of defining variables at a point in time, and then going back in time prior to defining the variable and testing if it works. For over 25 years, we have been following the same process and model, tracking its performance in real time across economic booms and busts, market euphoria and depression, and a 3-sigma pandemic.
source: Excess Returns on YouTube
Applied Finance’s definition of value investing derives from understanding a firm’s intrinsic value, rather than a focus on price-to-something multiples. The two approaches could not be further apart from each other. It’s very interesting that since 1992, the value premium as identified by Fama and French has shown significantly less robustness, and ironically a negative premium, out-of-sample. Such a poor out-of-sample experience is consistent with a growing body of literature that the majority of back test-driven factors fail to hold up out-of-sample (see Replicating Anomalies – Hou, Xue, Zhang; also, A Census of the Factor Zoo – Harvey and Liu). This drives home a very important point – Applied Finance data is live and out-of-sample since 1998, which is what Harvey and Liu recommend as the Gold Standard to evaluate a factor.
The chart below shows the performance of Applied Finance’s live, out-of-sample Intrinsic Value Factor®, with the traditional definition of “value”, High Book to Price. Focusing on the US market, intrinsic value performed extraordinarily well since going live in October 1998. The graph below highlights why intrinsic value is such an important factor for portfolio construction as you can see from the live, out-of-sample performance of the Intrinsic Value Factor® vs. Book to Price (“value”) or “HML” factor for large cap companies. (note: the Intrinsic Value Factor and Value Factor returns are comprised of the top 30% of firms in the Russell 1000 Index sorted by each factor.)
Growth of $1000
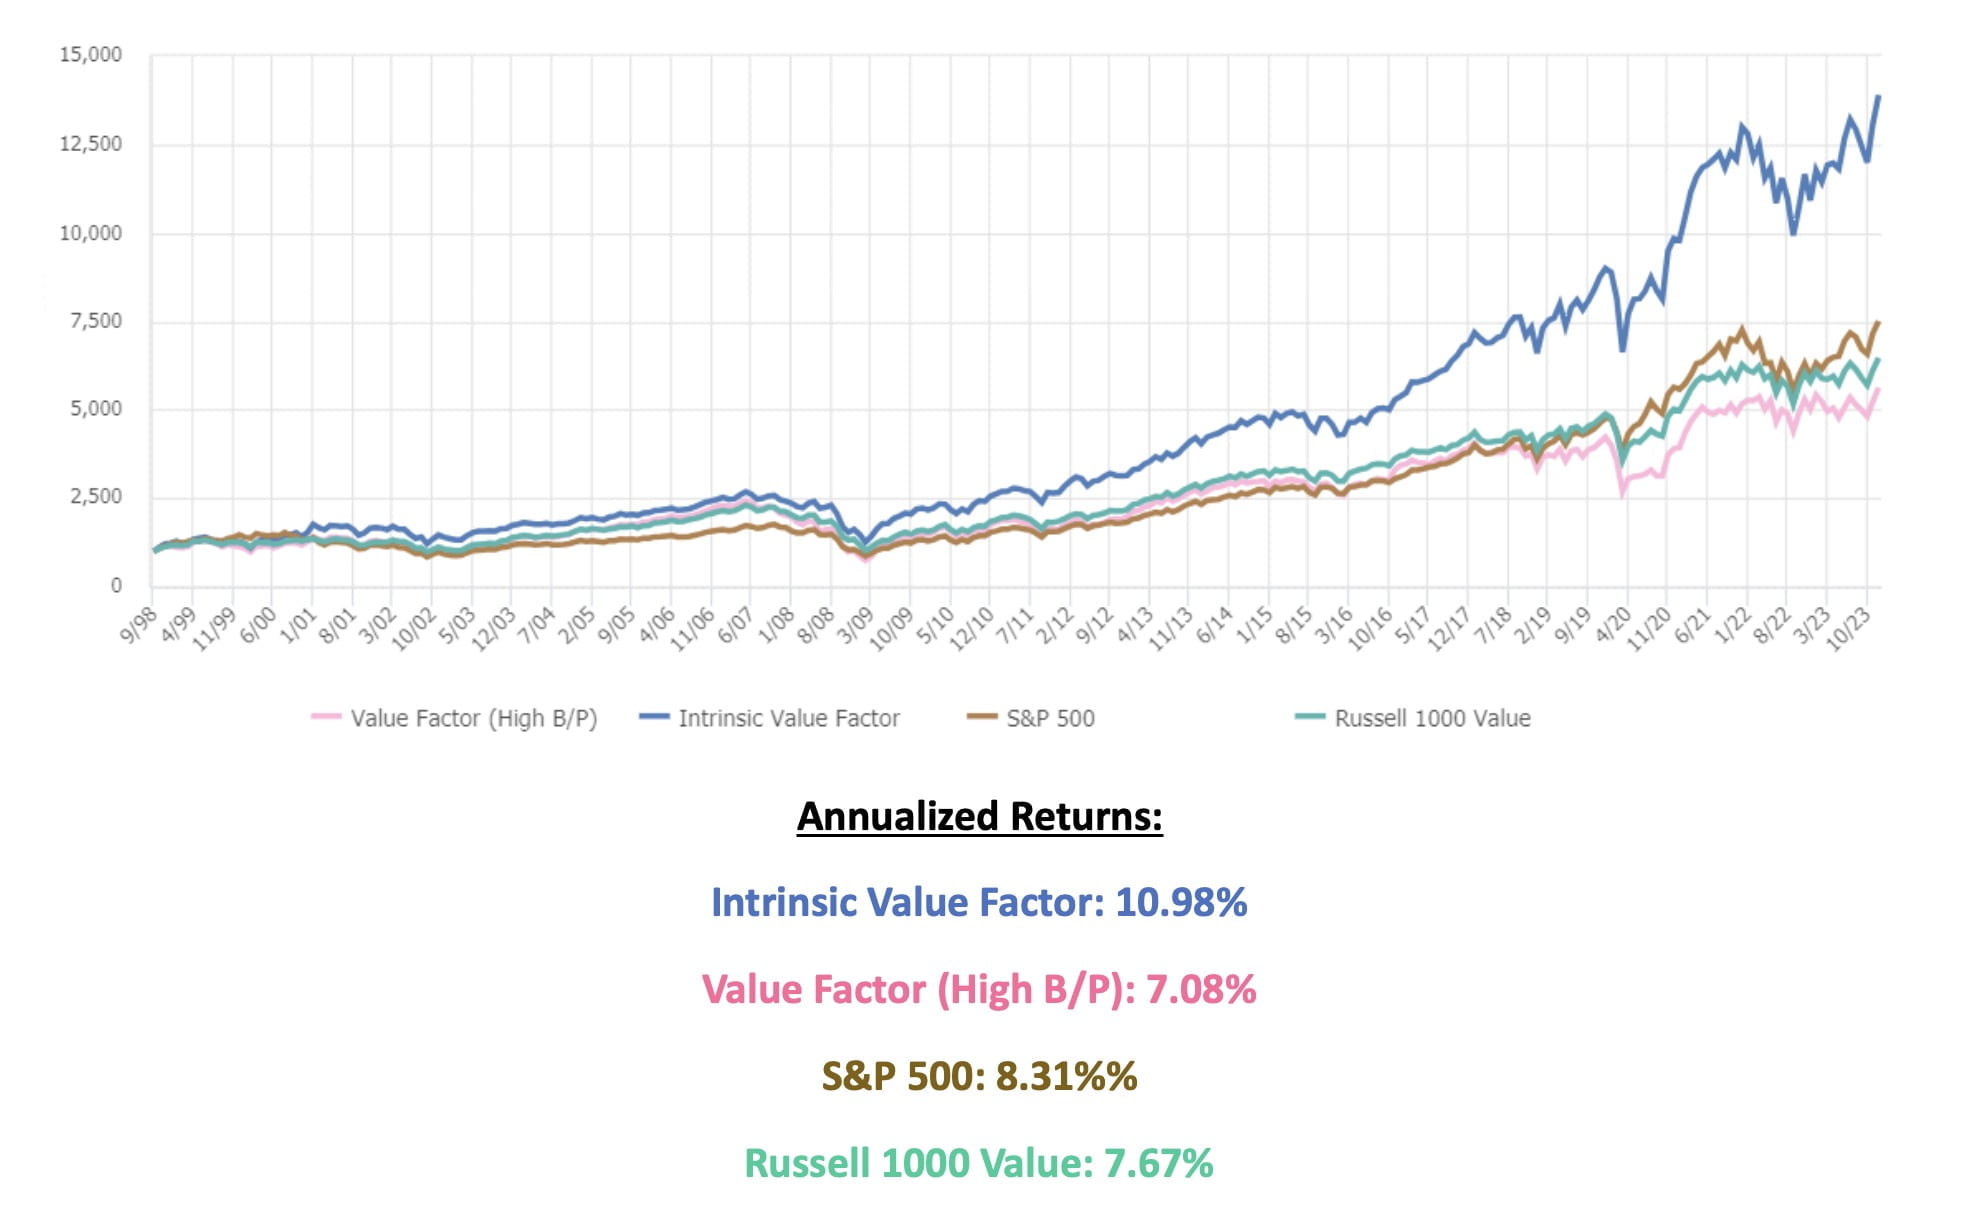
Annualized Returns:
Intrinsic Value Factor: 10.98%
Value Factor (High B/P): 7.08%
S&P 500: 8.31%%
Russell 1000 Value: 7.67%
On a more practical level, the chart below depicts how well the Intrinsic Value Factor® has captured future returns based on intrinsic value attractiveness – the most undervalued stocks consistently outperform the market, while the most overvalued stocks consistently underperform the market
Growth $1000
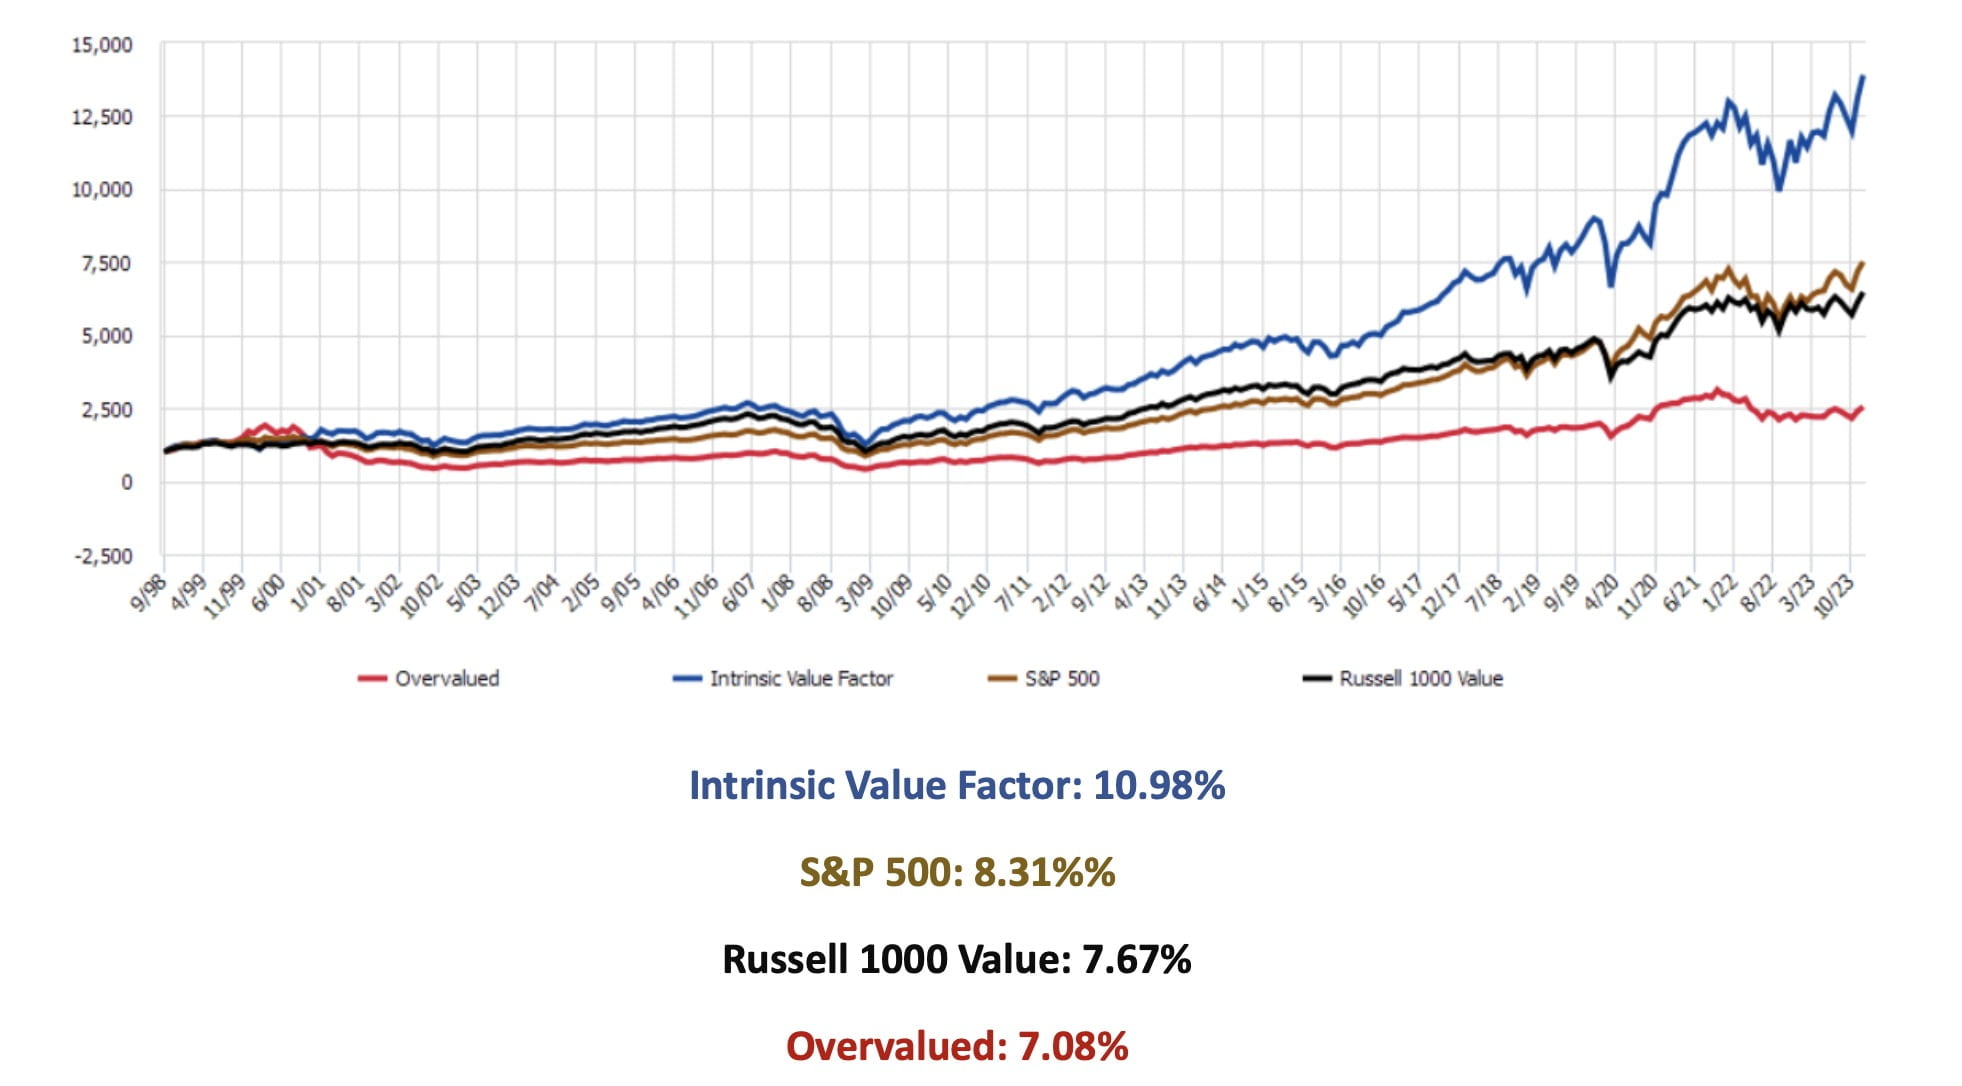
Intrinsic Value Factor: 10.98%
S&P 500: 8.31%%
Russell 1000 Value: 7.67%
Overvalued: 7.08%
Stewardship Factor™
While intrinsic value is important, investors shouldn’t overlook how well a company invests and finances its resources (stewardship). Essentially, this involves evaluating whether the company’s corporate actions are enhancing long-term shareholder value. We refer to this evaluative measure as our ‘Stewardship Factor™.’ It’s independent of a company’s current valuation but rather focuses on strategic initiatives, financial discipline, and how effectively companies allocate resources to foster growth and returns. A company that scores highly on both fronts — possessing compelling Intrinsic Value upside and demonstrating prudent Capital Stewardship — presents a promising opportunity as a robust, long-term investment. We believe this dual-focus approach forms the foundation of a strong investment strategy, sustainable alpha, and wealth creation for our investors.
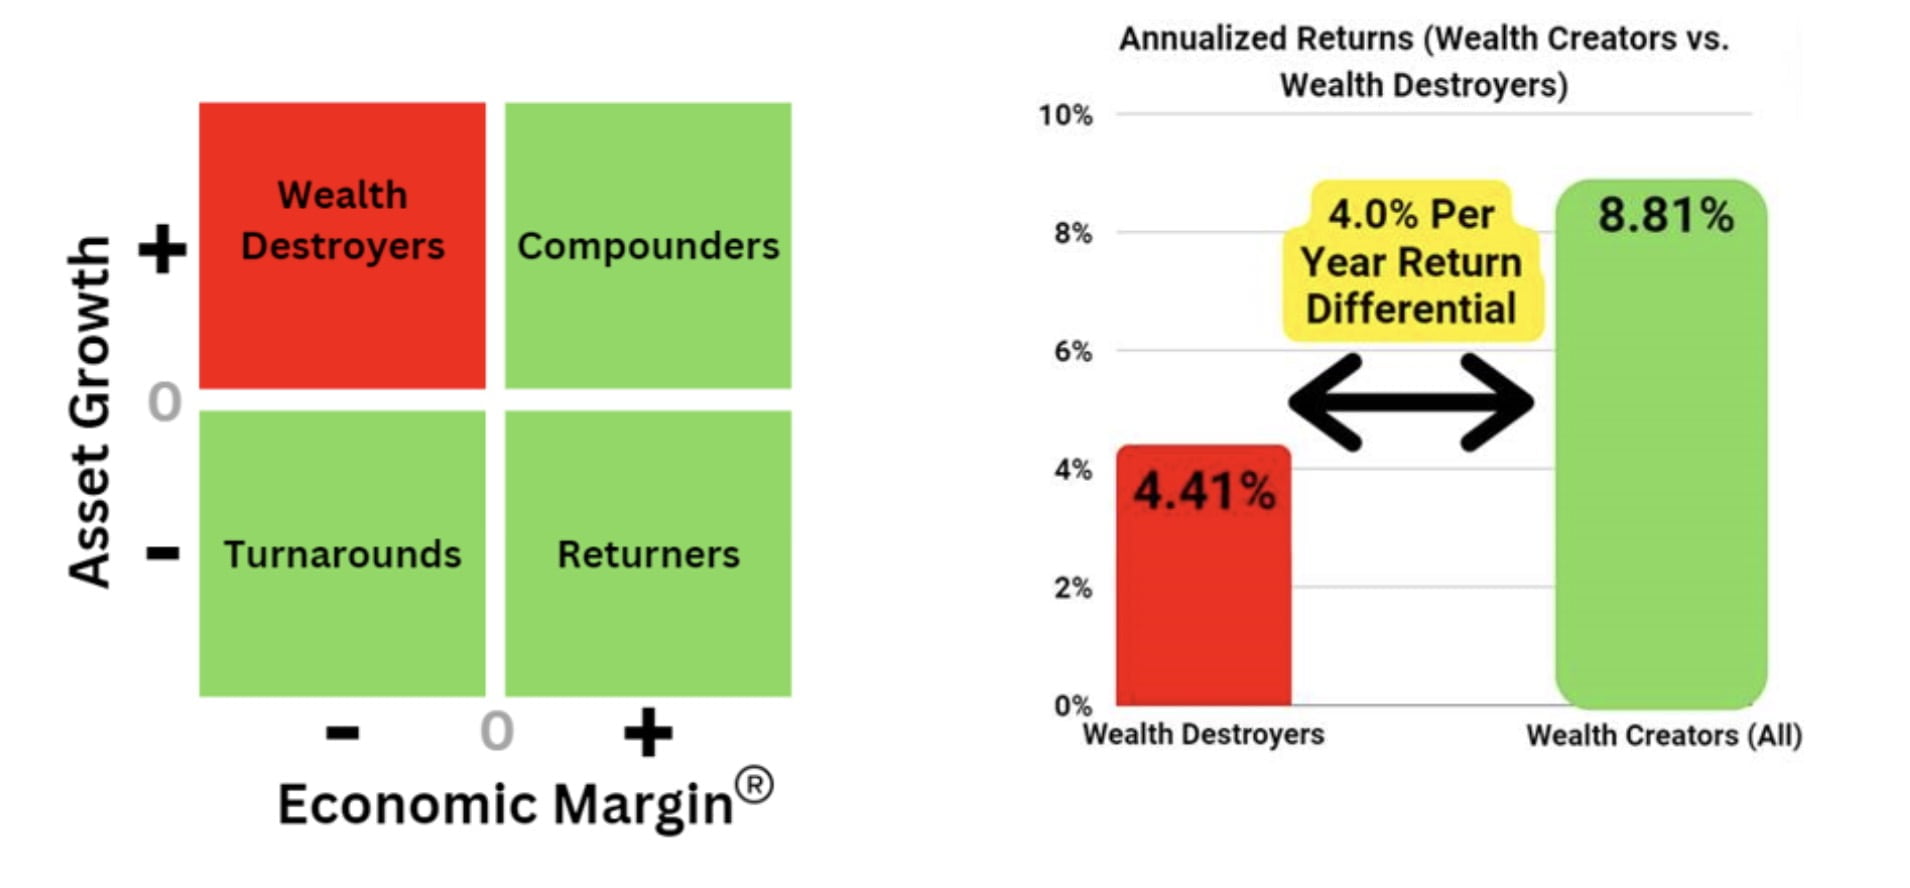
Our Wealth Creation research identifies (“The Wealth Creation Effect in Stock Returns”) the return characteristics of four types of firms. We group these firms into a matrix we call the “Wealth Creation Matrix™” and categorizes companies based on two dimensions: Asset Growth and Economic Margin®, our measure of corporate performance. This visual helps investors to quickly mentally categorize companies based on their growth and value-creating capabilities.
Here’s an explanation of the four quadrants:
- Compounders (Top Right): These are companies with positive asset growth and a positive Economic Margin®. They are considered the most favorable, as they are growing their assets and also generating returns above their cost of capital.
- Destroyers (Top Left): These companies have positive asset growth but a negative Economic Margin®. This means they are increasing their assets, but their returns are below their cost of capital, which implies investment activity destroys wealth.
- Returners (Bottom Right): These companies have a positive Economic Margin® but not as many opportunities to grow their asset base, they instead prioritize returning capital to shareholders. (i.e. dividends, share repurchases, and debt buybacks)
- Turnarounds (Bottom Left): Companies in this quadrant have negative asset growth and negative Economic Margin®, which may indicate they are in a turnaround situation.
The table below shows how stocks classified as “Wealth Destroyers” and “Non-Wealth Destroyers” performed between 1998 and 2023 within the Russel 1000 Index investment universe.
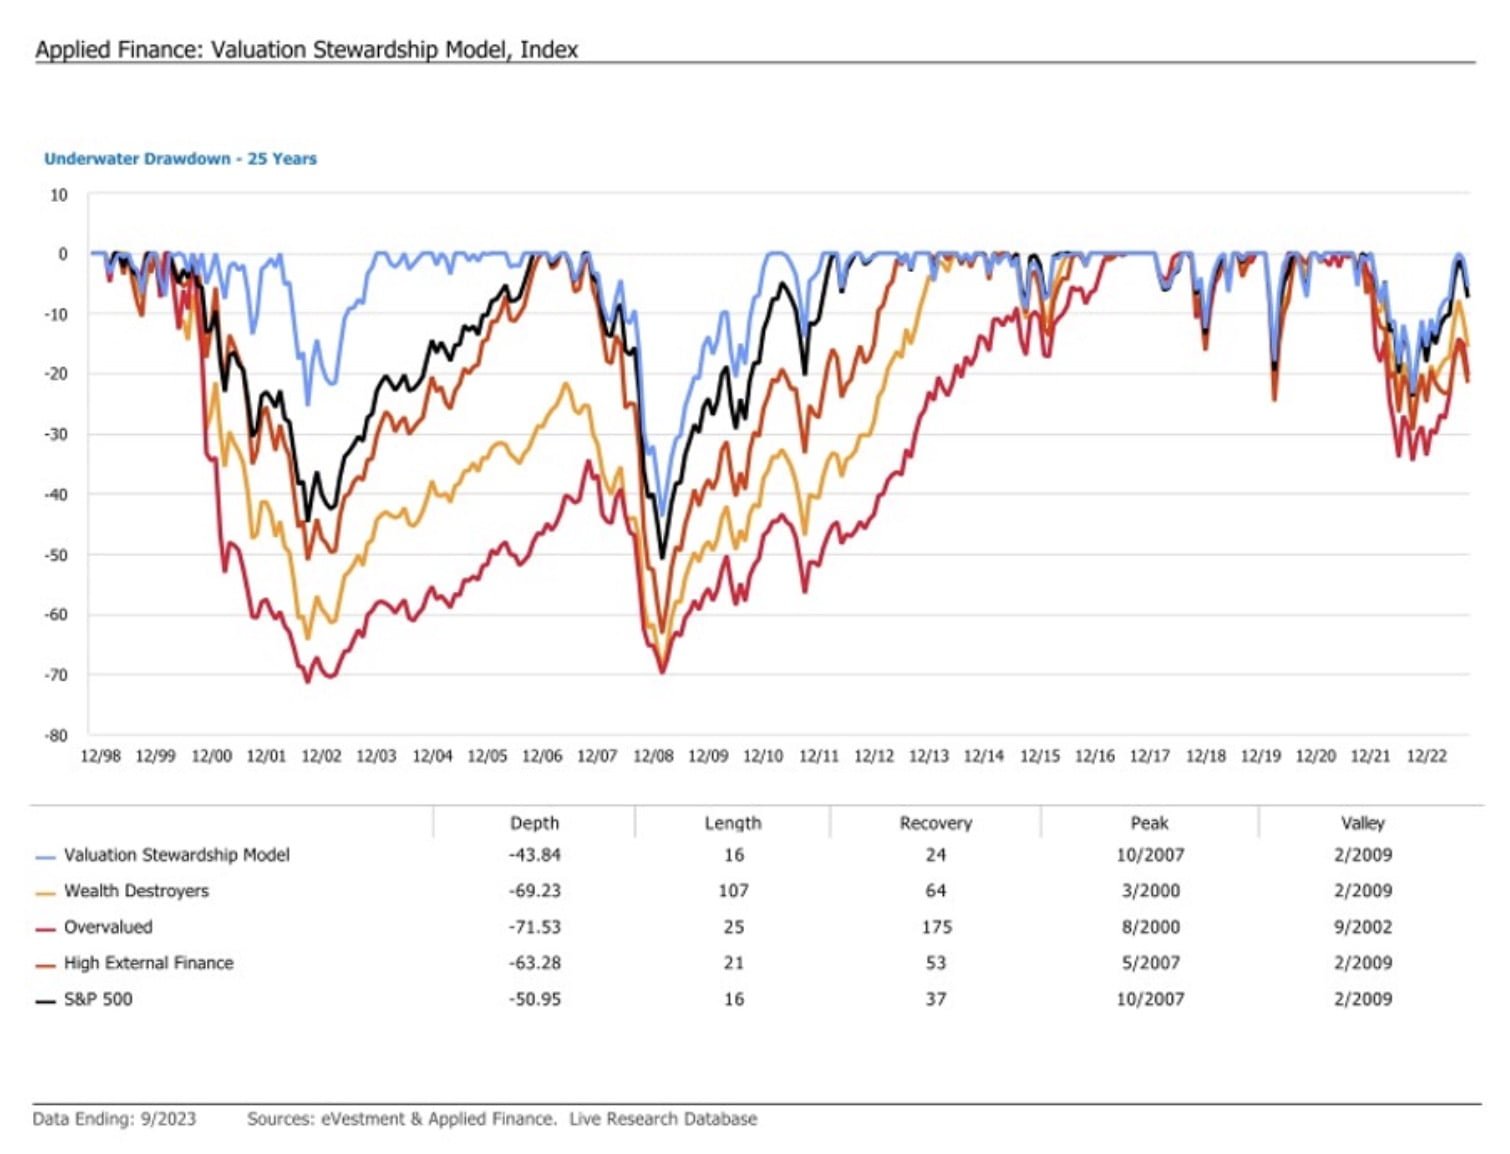
Together, poor Intrinsic Value and Capital Stewardship characteristics identify companies likely to significantly underperform the overall market. The chart below uses Applied Finance live out-of-sample (not back-tested) Intrinsic Value Stewardship™ data back to 1998. This includes three bear markets (2000 – 2002, 2008 – 2009, and early 2020) and demonstrates why investing in overvalued companies and wealth destroyers has the potential to hurt long-term investment returns and investor objectives. Put simply, avoiding those companies form a Safer Market™.

Unique Features Of Your Funds
Let’s go over all the unique features your funds offer so investors can better understand them. What key exposures do they offer? Are they static or dynamic in nature? Are they active or passive? Are they leveraged or not? Are they rules-based strategy or do they involve some discretionary inputs? How about the fee structure of them?
As a starting point, all Applied Finance strategies incorporate aspects of our Safer Market™ framework as the foundation to build a given portfolio. It is important to note that regardless of style or purpose, live implementation of these strategies eligible for a Morningstar rating have earned 5 or 4 Stars from Morningstar and are Gold rated as of 12/31/2023.

Further, all are active, long only, and unleveraged. Where they differ is in solving specific client needs.
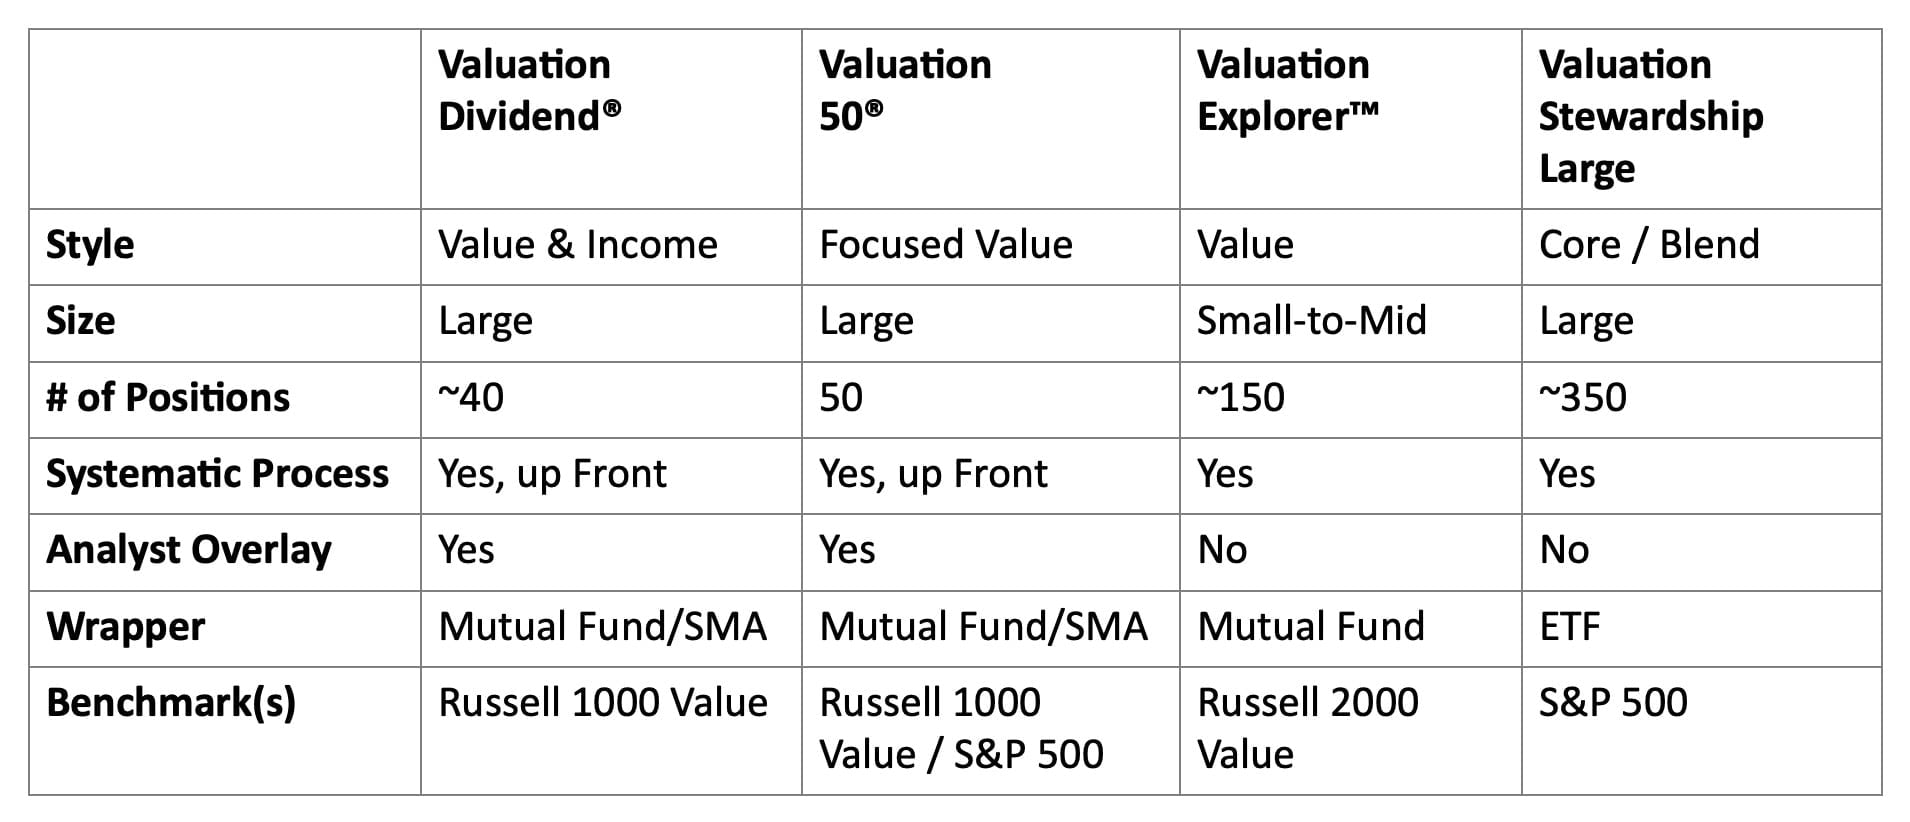
At a high level, Applied Finance provides investors with 4 very different strategies –
Valuation Dividend® – Targeted to dividend-oriented investors seeking current income, real long-term capital preservation, growth of purchasing power, and attractive down-market risk and return characteristics. This is a value-oriented portfolio holding stocks with above average yields and companies that are growing their dividends over time.
Valuation 50® – Targeted to investors interested in a high active share, value-tilted strategy that can go beyond low multiple (i.e., “cheap”) stocks in search of attractively priced long-term compounders in the large cap universe. The 50-stock portfolio holds high conviction intrinsic value stocks, the process marries quantitative and qualitative analysis. Stocks that pass an initial intrinsic value screen are further vetted by our analysts. The strategy is built for long-term wealth accumulation.
Valuation Explorer™ – Targeted to investors seeking small cap exposure, with a value tilt, who are seeking alternatives to small cap indices and other strategies that include expensive or low-quality small cap companies. Stocks in the portfolio are selected “systematically” with the goal of exploiting inefficiencies in the small cap space while driving long-term outperformance through our Intrinsic Value Driven® investment approach.
Valuation Stewardship Large – Targeted to investors seeking broad market, core exposure and desire an alternative to traditional index funds, passive investments, and core strategies that rely solely on market cap weights. The strategy aims for long-term market outperformance with a superior risk-adjusted return profile vs. market cap weighted indices with the tax efficiency of the ETF wrapper.
How do your funds set themselves apart from other US funds being offered in the marketplace? What makes them unique?
First, it’s important to note that unlike most active strategies, Applied Finance strategies have outperformed their respective passive benchmarks. We mentioned how the Valuation 50® strategy has outperformed 99.7% of US large cap managers per S&P statistics.
Beyond our investment process described above, there are several differentiating features that set Applied Finance and our strategies apart from other value managers, particularly those in the area of systematic and factor-based value investing. (see our multi-part series, Part I – Valuation vs. Cheapness Investing & Part II – Reclaiming Value & Restoring its Place in Active Management)
Thought Leadership. Applied Finance developed the Economic Margin®, its measure of corporate performance, approximately 30 years ago. At the time, we struggled and worked hard to understand difficult valuation and corporate performance measurement topics such as:
- Operating Leases
- R&D
- Wealth Creation/Investment Factor
- Economic Profit Horizon/Terminal Values
Recognizing the importance of operating leases in capturing off-balance-sheet liabilities was a key part of our efforts. A few years ago, the FASB changed accounting standards to reflect our world view. However, historic data is not adjusted, making time series comparisons of uncorrected data much less useful. Also, in 1995, we recognized that corporations were spending more on intangible investments and capitalized R&D spending as an investment rather than a period expense. Over the past few years, many value investors and academics have been restating book equity to reflect R&D adjustments. These adjustments have all been done “in-sample” fully aware of the impact of such adjustments – making tech stocks appear more like “value” stocks. Making these adjustments isn’t straightforward. In fact, as the price-to-book ratio’s history demonstrates, we urge caution with back tests. Researchers with a predetermined outcome can easily manipulate results. Another area where Applied Finance deviates from accepted industry views relates to our approach to corporate investment.
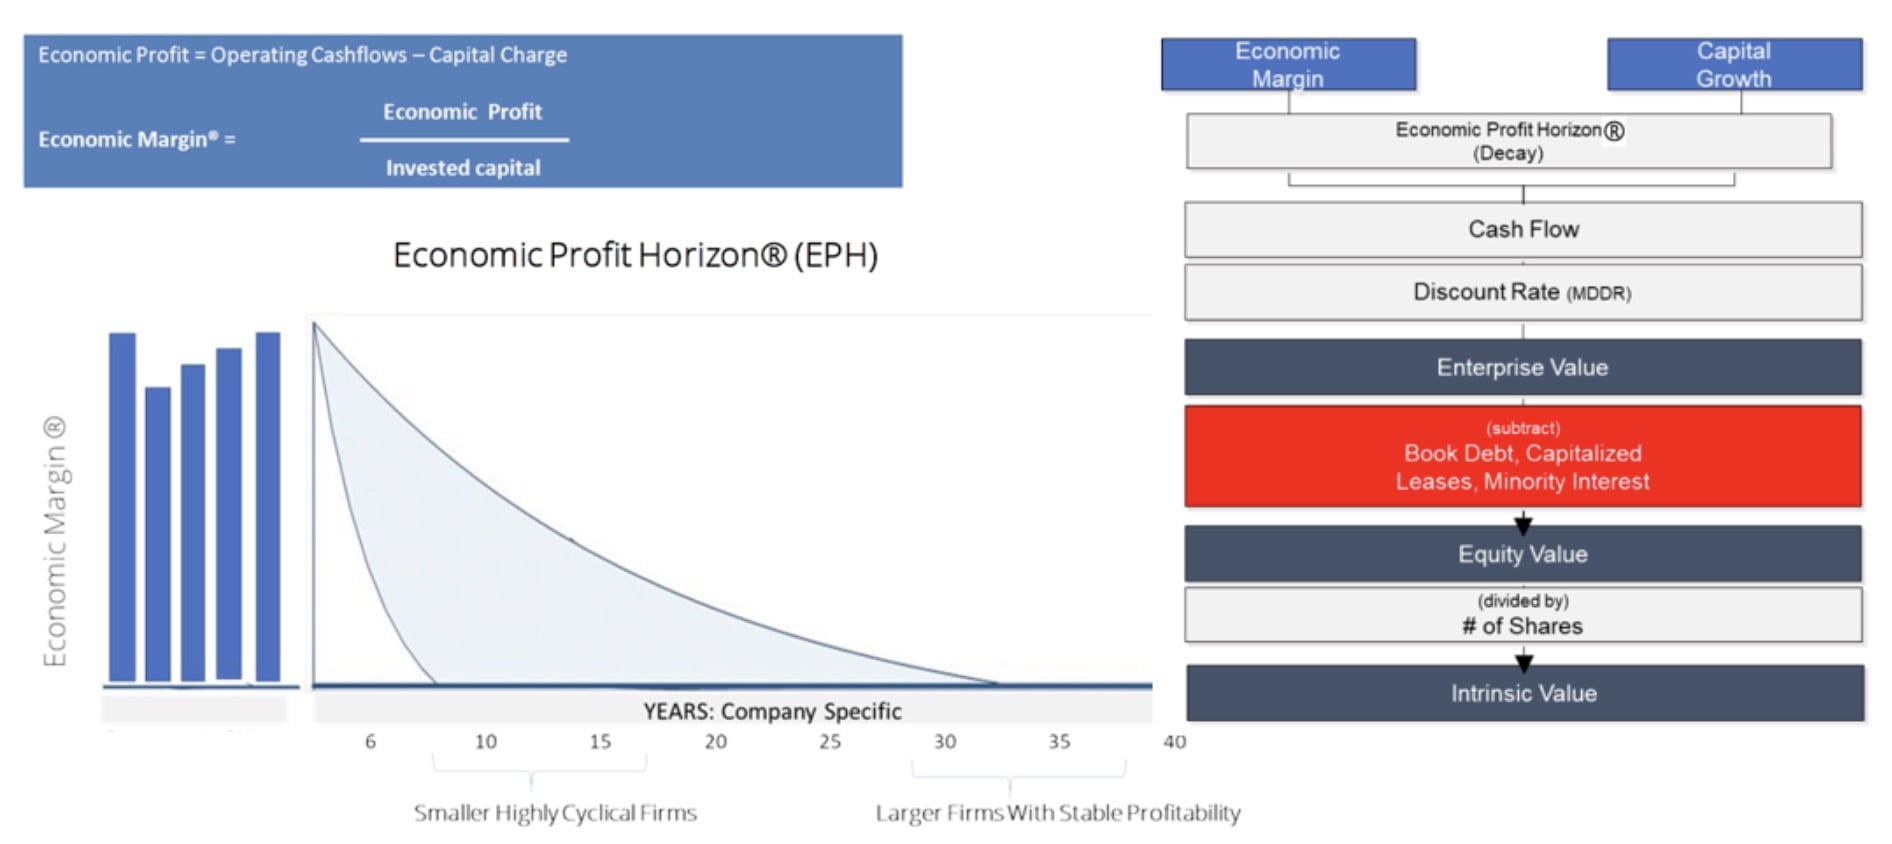
The accepted view among quant managers is corporate investment leads to negative future returns. We find such views reflect a profound misunderstanding of wealth creation. Firms that invest in projects earning more than their cost out capital tend to significantly outperform. Not understanding that leads to a sub-optimal investment opportunity set. Lastly, we do not believe a valuation model should use terminal value assumptions. That invalidates the usefulness of performing a valuation. Instead, we developed a model around what we call an Economic Profit Horizon™, which estimates how many years a company is likely to earn more or less than its cost of capital.
The visual below shows how we calculate Economic Margin®, forecast the Economic Profit Horizon™ to solve the perpetuity problem, and determine a firm’s Intrinsic Value.
Strong Theory and Research. Many quantitative value managers base their strategies on internal back-tests or market anomalies from the empirical finance and academic world. It is becoming clear that such an approach leaves much to be desired as out-of-sample, most of these findings fail to deliver real results. As we mentioned above, that is problematic. For reference, a recent paper by Andrew Chen, Alejandro Lopez-Lira, and Tom Zimmermann (“Does peer-reviewed theory help predict the cross-section of stock returns?“) shows how much decay empirically tested anomalies have out-of-sample. As the study shows, across risk-based, mispricing, or agnostic signals, performance declines once out-of-sample when the real, live performance tracking begins.
Applied Finance, on the other hand, bases its portfolio construction on a parsimonious set of ideas that have strong economic rigor, are proprietary (no other firm can replicate our work), and have consistently explained stock returns live, out-of-sample over the past 25 years. We believe this is a critical part of our success. In a field where most fund managers fail to consistently beat their benchmark, our institutional class funds have outperformed their primary benchmarks since inception. Furthermore, these funds that carry a three-year track record have earned a 4 or 5-Star Morningstar rating, a testament to how our funds stand out in their category (Small Cap, Large Cap Value, Large Cap Value + Dividend).
Tenured, Long-Term Team. Applied Finance is 100% employee owned, with the average tenure of our 10 partners being over 18 years. We have a deep bench and a team that has spent considerable time working together and is intimate with our investment process and the drivers of alpha in each of our investment strategies.

Best and Worst Performance
Let’s explore when your funds/strategies have performed at their best and worst historically or theoretically in backtests. What types of market conditions or other scenarios are most favourable for these particular strategies? On the other hand, when can investors expect these strategies to potentially struggle?
Applied Finance’s Intrinsic Value Factor® and Stewardship Factor® have consistently demonstrated effectiveness over time. We have seen periods where our strategies have lagged, but over time our strategies have experienced less downside than their respective benchmarks, with equal or more upside. This has led to consistent long-term outperformance. In years where the market returns derive from a narrow group of stocks, there is certainly a possibility of relative underperformance, but our results show that the performance is made up once the return dispersion improves. During bear market recoveries, lower quality stocks may temporarily surpass higher quality names, but such periods often coincide with robust market rebounds where our strategies tend to also excel.
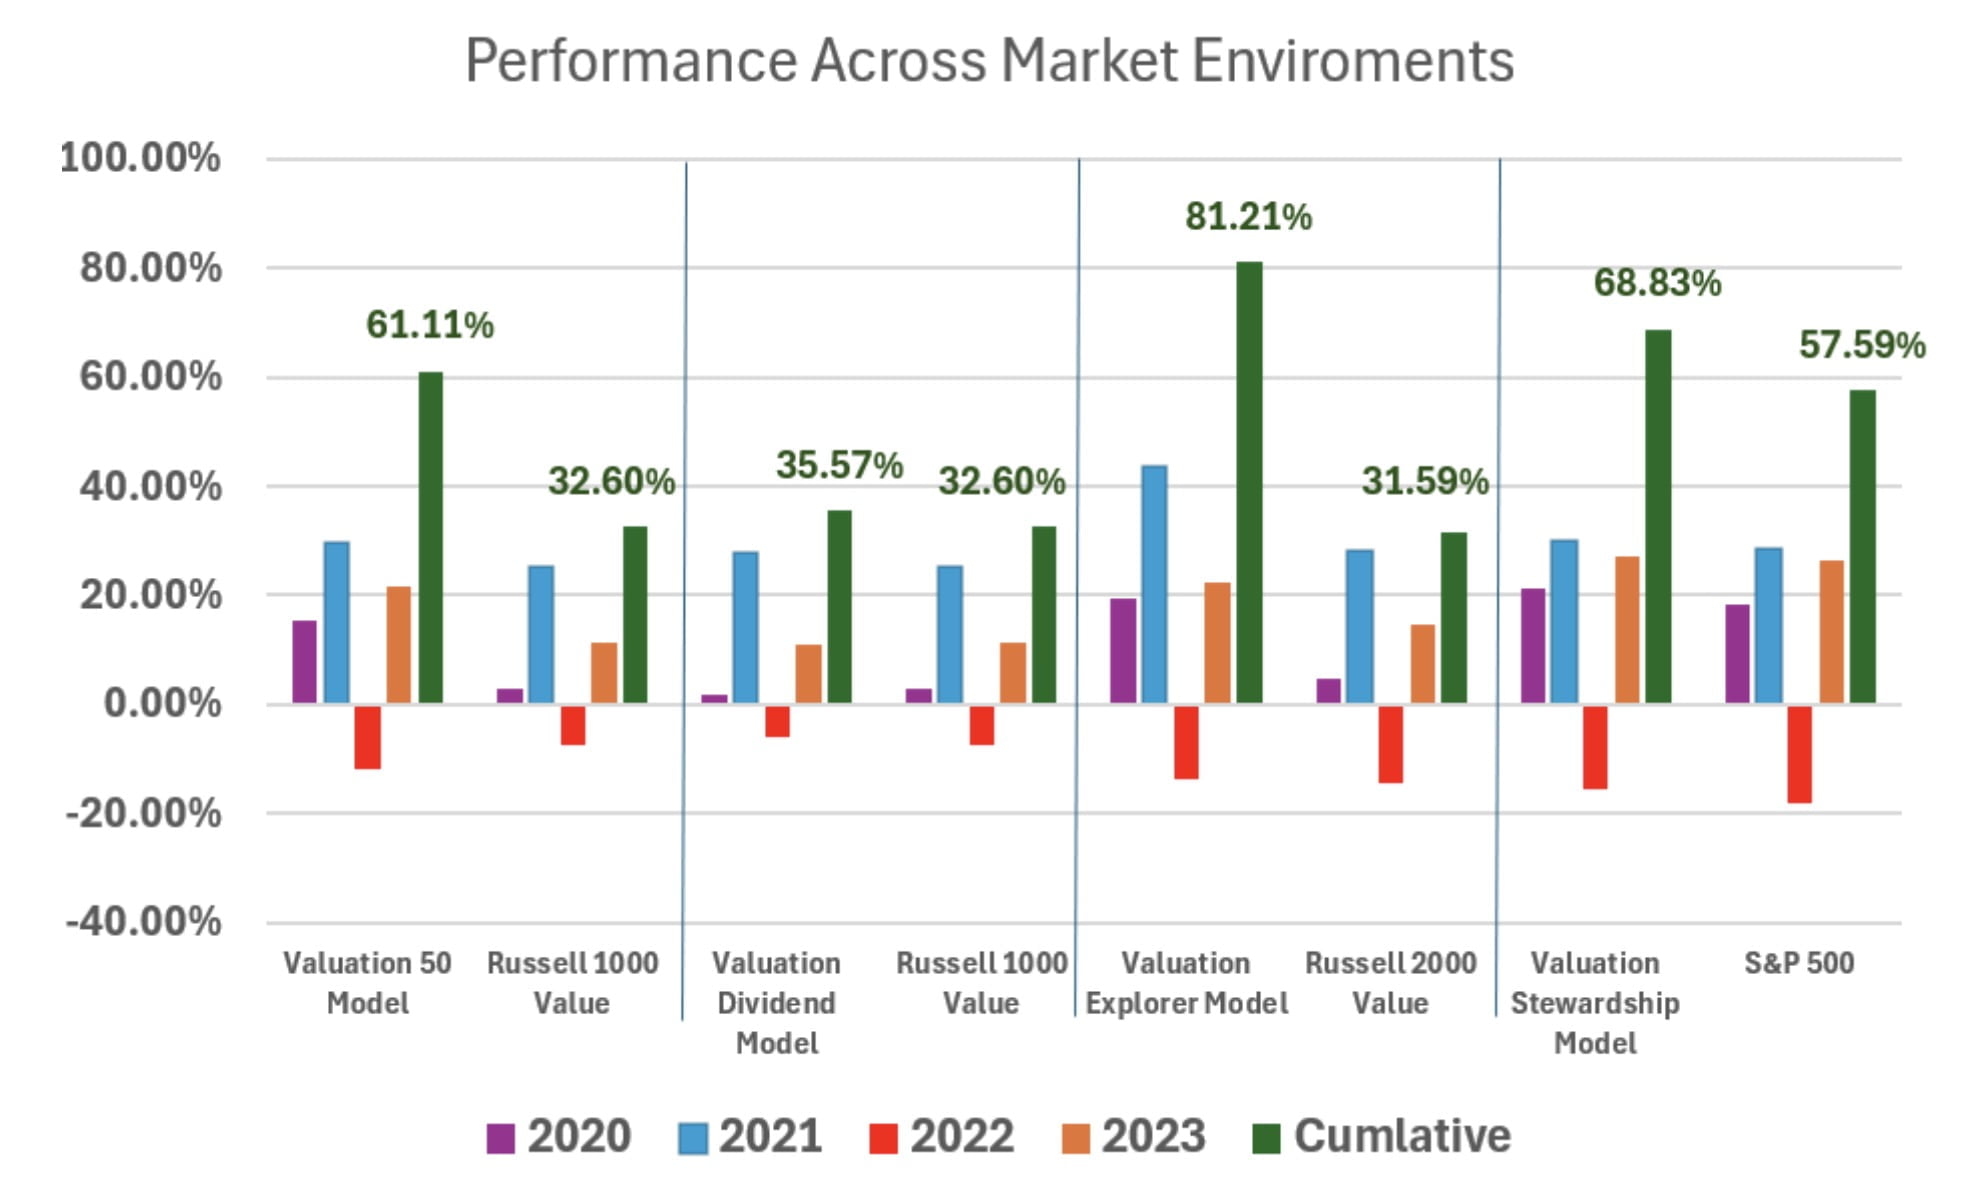
The chart below presents the performance of our strategies from 2020 through 2023, which included very different types of market leadership. The years 2022 and 2023 stand out. In 2022, we witnessed value strategies outperforming growth strategies, while in 2023, the trend reversed with growth outperforming value. Despite these fluctuations, Applied Finance strategies outperformed their benchmarks over both that two-year period (2022 – 2023) and the entire four-year period (2020 – 2023). The cumulative, or total return, is represented by the green lines and data labels on the chart for the full four-year period (2020 – 2023).
This is important because it shows that our strategies have demonstrated their effectiveness whether “value” is in favor or when “growth” is outperforming. We are focused on finding stocks, across all regimes and environments, that look attractive based on their Intrinsic Value Factor® and Stewardship Factor® scores.
If we’re assuming that an industry standard portfolio for most investors is one aligned towards low cost beta exposure to global equities and bonds, why should investors consider your fund/strategy?
Low-cost beta or even factor-centric approaches to portfolio management leave much to be desired in practice. For example, through our factor work on Intrinsic Value and Stewardship, it is clear to us that the market consistently gets these things wrong. Specifically, the market over-invests in overvalued, poor stewardship companies and underinvests in undervalued, good stewardship companies. This mispricing has been consistent for decades, and there is no evidence to suggest it is likely to go away any time soon. The Safer Market® philosophy provides a strong economic based approach to understanding expected returns, with decades of live, out-of-sample success.
Ultimately, this is reflected through the performance of all our strategies.

Constructive Criticism
What’s the biggest point of constructive criticism you’ve received about your funds since they’ve launched?
I think the single largest criticism is that our data and research is proprietary. Most practitioners admit they all tend to use similar variations of common variables – book equity, sales, earnings, cash, operating earnings, total assets, low vol, price momentum, but most fail to beat their benchmark. Unlike our competitors, we transform accounting, pricing, and macro-economic data into several proprietary metrics, the most important being Intrinsic Value. Intrinsic Value is a very different concept than “value” as it is popularly known (which is really cheapness or price-to-something, with minimal link to actual firm value). This causes friction among some asset managers that are emotionally or economically invested in a certain way of doing things, as our work often leads to very different conclusions than traditional approaches.
For example, while we understand that “growth”/ “value” has traded at a very high spread for years, we felt all the hand wringing over “value” spreads going back to 2019, were much ado about nothing. While the “growth”/”value” spread was at historic levels, the intrinsic value upside between the two types of firms were in line with each other during most of the past five years, so to us there was no call to action and certainly no need to claim the market is or has been in a bubble like the dot com era.
But this criticism, which may sometimes lead to confusion or differences in how some investors view us vs. other systematic value managers and strategies, is also a major opportunity for Applied Finance. Our factors have very different qualities than traditional value metrics, and most portfolios would benefit from being exposed to them. It is our responsibility to educate investors on Intrinsic Value and Stewardship – explaining the “why”, the “how”, the ultimate benefits of our investment strategies and how they fit into an investor’s overall equity allocation. We have a unique opportunity to help investors see crucial differences in our approach vs. others and why we believe our value investing framework gets back to the true essence of value investing.

Praise and Positive Feedback
On the other hand, what have others praised about your funds?
Investors who have taken the time to learn about us have praised:
- Our Intrinsic Value investing philosophy, process, and how we go beyond traditional accounting metrics to derive the true economic vitality of the businesses and valuation.
- Our approach to assessing Stewardship and Financial Health to determine if companies are creating shareholder value and if they are on solid financial footing.
- The systematic, objective, and repeatable investment process that ties together Intrinsic Value investing and Stewardship.
- The 25+ years of live, out-of-sample data across US and global companies.
- The long-standing investment team of investment professionals at our firm.
- Our strong long-term performance record, and fair and reasonable fees.

12-Question FAQ — Applied Finance’s Safer Market® Philosophy (with Rafael Resendes)
1) What is Safer Market® in one line?
A portfolio design philosophy that combines Intrinsic Value Driven® security selection with Stewardship Driven™ capital-allocation discipline to avoid chronic wealth destroyers while concentrating on firms with attractive valuation upside and sound corporate stewardship.
2) How is “Intrinsic Value” different from traditional “value” (cheapness)?
Traditional value often ranks on price multiples (e.g., P/B, P/E). Applied Finance estimates a firm’s Intrinsic Value from economic drivers—economic profitability (Economic Margin®), growth, competition, and risk—and compares price vs. intrinsic worth, not price vs. accounting snapshots.
3) What is the Stewardship Factor™ and why does it matter?
It evaluates how management invests and finances—are projects earning above the cost of capital, is balance-sheet health improving, are buybacks/dividends sensible? High stewardship aims to compound shareholder wealth; poor stewardship tends to destroy it.
4) What’s the Wealth Creation Matrix™?
A practical map that classifies companies by Asset Growth (expansion) and Economic Margin® (value creation): Compounders (grow and earn above the cost of capital), Returners (strong economics, returning capital), Destroyers (grow but earn below cost), and Turnarounds (shrinking with weak economics).
5) What’s unique about Applied Finance’s data and research record?
Since 1998, they’ve produced live, point-in-time (out-of-sample) intrinsic value estimates—20M+ valuations across 20k+ companies—letting them validate factor behavior across regimes without backtest hindsight.
6) How is the approach implemented in portfolios?
All strategies are active, long-only, unlevered and apply the Safer Market® framework (Intrinsic Value + Stewardship), with sector awareness, fundamental review where needed, and low to moderate turnover.
7) What strategies are available?
Valuation Dividend® (dividend income with downside mindfulness), Valuation 50® (concentrated large-cap intrinsic-value compounders), Valuation Explorer™ (small-cap intrinsic-value tilt, systematic), and Valuation Stewardship Large (broad, core exposure as an active ETF alternative to cap-weighting).
8) When can Safer Market® shine—and when might it lag?
It tends to outperform over full cycles by avoiding overvalued/poor-stewardship names and participating in quality compounding. It can temporarily lag in narrow, momentum-led tapes or during sharp junk-led rebounds, with performance typically catching up as dispersion widens.
9) How does this differ from common quant/factor “value”?
Rather than tweaking accounting (e.g., P/B + R&D fixes), Applied Finance rebuilds the valuation stack (Economic Margin®, Economic Profit Horizon™) to estimate business worth; result: different signals, different constituents, different risk than cheapness-only factor baskets.
10) Where does this fit vs. low-cost beta (or factor beta)?
As a core or completion sleeve for investors who want valuation + stewardship as explicit risk controls—seeking better risk-adjusted returns than cap-weighted beta and a truer expression of value than cheapness screens.
11) What are the main caveats or criticisms?
The framework is proprietary (not easily replicated) and can differ from popular factor definitions, leading to holdings/performance that diverge from conventional “value” indexes—especially during narrow megacap surges.
12) Who is this for, and how might one use it?
Investors who want economically grounded value and capital-allocation discipline. Common uses: replace/augment large-cap value or core equity; pair with broad beta to improve downside profile; diversify small-cap exposure with intrinsic-value screens.
Disclaimer: Education/entertainment only—not investment advice. Do your own research and consider consulting a fiduciary advisor.
Connect With Applied Finance and Rafael Resendes
Website: Applied Finance
Twitter: @AppliedFinance
Twitter: @rresendes

Nomadic Samuel Final Thoughts
I want to personally thank Rafael for taking the time to participate in “The Strategy Behind The Fund” series by contributing thoughtful answers to all of the questions!
If you’ve read this article and would like to have your fund featured, feel free to reach out to nomadicsamuel at gmail dot com.
That’s all I’ve got!
Ciao for now!
Important Information
Comprehensive Investment Disclaimer:
All content provided on this website (including but not limited to portfolio ideas, fund analyses, investment strategies, commentary on market conditions, and discussions regarding leverage) is strictly for educational, informational, and illustrative purposes only. The information does not constitute financial, investment, tax, accounting, or legal advice. Opinions, strategies, and ideas presented herein represent personal perspectives, are based on independent research and publicly available information, and do not necessarily reflect the views or official positions of any third-party organizations, institutions, or affiliates.
Investing in financial markets inherently carries substantial risks, including but not limited to market volatility, economic uncertainties, geopolitical developments, and liquidity risks. You must be fully aware that there is always the potential for partial or total loss of your principal investment. Additionally, the use of leverage or leveraged financial products significantly increases risk exposure by amplifying both potential gains and potential losses, and thus is not appropriate or advisable for all investors. Using leverage may result in losing more than your initial invested capital, incurring margin calls, experiencing substantial interest costs, or suffering severe financial distress.
Past performance indicators, including historical data, backtesting results, and hypothetical scenarios, should never be viewed as guarantees or reliable predictions of future performance. Any examples provided are purely hypothetical and intended only for illustration purposes. Performance benchmarks, such as market indexes mentioned on this site, are theoretical and are not directly investable. While diligent efforts are made to provide accurate and current information, “Picture Perfect Portfolios” does not warrant, represent, or guarantee the accuracy, completeness, or timeliness of any information provided. Errors, inaccuracies, or outdated information may exist.
Users of this website are strongly encouraged to independently verify all information, conduct comprehensive research and due diligence, and engage with qualified financial, investment, tax, or legal professionals before making any investment or financial decisions. The responsibility for making informed investment decisions rests entirely with the individual. “Picture Perfect Portfolios” explicitly disclaims all liability for any direct, indirect, incidental, special, consequential, or other losses or damages incurred, financial or otherwise, arising out of reliance upon, or use of, any content or information presented on this website.
By accessing, reading, and utilizing the content on this website, you expressly acknowledge, understand, accept, and agree to abide by these terms and conditions. Please consult the full and detailed disclaimer available elsewhere on this website for further clarification and additional important disclosures. Read the complete disclaimer here.


