Trend following and risk management are two of my favourite themes on this site.
One of the deciding factors for me switching from being an all-equity investor to a maximum diversification approach was my desire to avoid jaw-dropping drawdowns.

It’s just not fun knowing that eventually a 20%, 30% or even 50% blindside event is going to manifest if you’re in the game long enough.
With this in mind, I’m thrilled to welcome Stephen to discuss MKAM ETF.
Its mandate is clear:
It seeks to capture the majority of equity market returns, while exposing investors to less volatility and downside risk than other equity investments.
Without further ado, let’s turn things over to Stephen to find out more.
Meet Stephen of Mulholland & Kuperstock Asset Management
Stephen started working in the institutional investment industry in 2001. He served as Senior Analyst at institutional investment consulting firm Callan Associates, creator of the Callan Periodic Table of Returns. He advised pension plans like California State Teachers, endowments including the Harvard Endowment, and foundations. He later joined his client, the $2B James Irvine Foundation as the sole analyst. The James Irvine Foundation’s performance ranks in the top 1% of large foundations.
He created the internal control systems and accounting processes for microfinance facilitator Kiva, founded by veterans of Silicon Valley, including the former Chief Operating Officer of Google and early employees of PayPal. Stephen worked in Nairobi, Kenya for 3 months in 2008 with Kiva’s largest banking partner.
Between 2010 and 2017 Stephen built a new RIA to over $100M while managing the hedge fund Livian Equity Opportunity Fund. He also co-managed the Livian High Income Opportunity strategy.
He co-founded registered investment adviser Mulholland & Kuperstock Asset Management with business partner Mark Kuperstock in 2019. Currently, Stephen is Chief Investment Officer of Mulholland & Kuperstock Asset Management and MKAM ETF.
Stephen graduated from the Barcelona Graduate School of Economics in 2009 with a Master of Science in Economics Degree. He successfully earned the CFA® credential in 2006. He graduated with honors in Economics from the University of California at Santa Cruz in 2001.

Stephen’s Dad was a student of Ed Throp in graduate school at the University of California at Irvine. Instead of working for Princeton Newport partners he chose a career as a systems analyst. His choice of computers over investing served him well in his career and facilitated his goal of retiring young. But his undying passion for investing is probably why both of his sons work in finance. Stephen’s brother runs a commodity hedge fund in New York and previously managed the Credit Suisse commodity mutual fund, the second largest in the world.
Stephen is an open water swimmer and finds the temperament required to stay calm and execute while alone in the open ocean helpful for investing. He swam from Europe to Asia through the Hellespont Strait in Turkey. His home swimming route is the La Jolla Cove to Pier.
Reviewing The Strategy Behind MKAM ETF
About the Author & Disclosure
Picture Perfect Portfolios is the quantitative research arm of Samuel Jeffery, co-founder of the Samuel & Audrey Media Network. With over 15 years of global business experience and two World Travel Awards (Europe’s Leading Marketing Campaign 2017 & 2018), Samuel brings a unique global macro perspective to asset allocation.
Note: This content is strictly for educational purposes and reflects personal opinions, not professional financial advice. All strategies discussed involve risk; please consult a qualified advisor before investing.
What’s The Strategy Of MKAM ETF?
These asset allocation ideas and model portfolios presented herein are purely for entertainment purposes only. This is NOT investment advice. These models are hypothetical and are intended to provide general information about potential ways to organize a portfolio based on theoretical scenarios and assumptions. They do not take into account the investment objectives, financial situation/goals, risk tolerance and/or specific needs of any particular individual.
For those who aren’t necessarily familiar with a “investing strategy that seeks to capture the majority of equity market returns, while exposing investors to less volatility and downside risk than other equity investments” style of asset allocation, let’s first define what it is and then explain this strategy in practice by giving some clear examples.
MKAM ETF uses a Bayesian approach to valuation, in combination with trend following, to seek to generate S&P 500 returns, while dramatically reducing drawdown risk. While it is true that investors generally will be well rewarded for owning the S&P 500 and participating in the growth of the US economy, we find it is not true that risk in the market is invariant. Rather, it very much depends on starting valuations and trends.

Institutional investors know two things about valuation that present a puzzle: 1) valuation models are helpful in forecasting long-term market returns with high accuracy and 2) these models are useless in making short-term predictions. How can this be? Shouldn’t the error term from efficacious long-term models contain useful short-term information? Our answer to the puzzle is embedded in MKAM ETF.
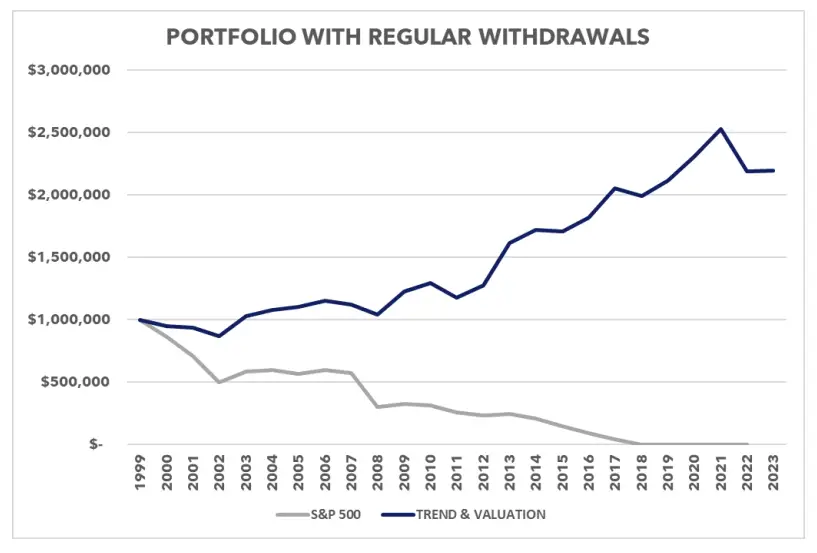
By reducing stock market exposure when valuations are extreme and trends breakdown, we seek to provide the smooth ride that any investor that makes regular withdrawals craves, from retirees to foundations. Further, avoiding nasty drawdowns is a way to help anxious investors from making the behavioral mistake of exiting the market after a crash, and not returning in time to benefit from the recovery.

Finally, we believe adjusting your market hedging as risks change is more cost effective than always buying left-tail event insurance, as evidenced by the comparison to the Gateway Fund (GATEX) below. The demand for strategies to deliver the upside of the stock market, while mitigating left-tail risk, is evidenced in the AUM of GATEX ($6.5B), which remains very popular in the RIA community despite significantly trailing the S&P 500 throughout its history. We believe we have a better way to meet this demand.
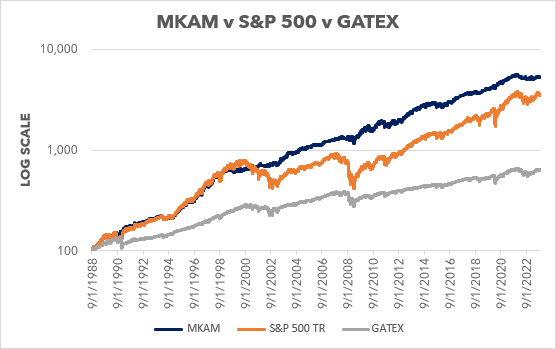

Source: Mulholland & Kuperstock Asset Management. MKAM performance is model results up until April 1, 2023, and then MKAM ETF thereafter. Model results do not include a management fee, ETF results include a 0.96% expense ratio. (The investment performance results presented here are based on historical backtesting and are hypothetical. Past performance, whether actual or indicated by historical tests of strategies, is not indicative of future results. The results obtained through backtesting are only theoretical and are provided for informational purposes to illustrate investment strategies under certain conditions and scenarios.)
Unique Features Of MKAM ETF
Let’s go over all the unique features your fund offers so investors can better understand it. What key exposure does it offer? Is it static or dynamic in nature? Active or passive? Is it leveraged or not? Is it a rules-based strategy or does it involve some discretionary inputs? How about its fee structure?
The start of 2024 is a good time to be having this discussion. By myriad measures, the S&P 500 is just about at its most expensive in modern history, tied with 2001 and 2008. At the same time, exposure to the market that makes up 60% of the global market capitalization dominates American portfolios.
Further, unique to the last 15 years, investors can receive significant returns on their cash again in the bond market. The risk and return today of the US stock market is fundamentally different than in most of our investing lives, yet most portfolios have not been properly adjusted. Rather than ask investors to try to time the market, something sure to produce inferior results, MKAM ETF adjust an investors’ exposure as risk/return changes for them according to our rules-based system.

MKAM ETF uses a proprietary internal algorithm with two key inputs: trend and valuation. Today, valuations are extreme but all of our trend indicators are positive so we are 50% exposed to the S&P 500. The other half is in US Treasury bonds earning 5%.
What Sets MKAM ETF Apart From Other Funds?
How does your fund set itself apart from other “strategies that attempt to deliver market returns with less downside risk” funds being offered in the marketplace? What makes it unique?
What sets MKAM ETF apart is twofold:
- We have a proprietary and novel approach to valuation (see above) and
- We adjust our exposure based on risk and return. We can be 100% long only. We can be completely out of the market. We do not always buy left tail risk insurance.
Always buying put protection on your portfolio is very expensive. When the VIX is 10, insurance is very cheap. However, when it’s over 30 it is quite expensive. The cost of always buying puts, even when funded by selling calls, produces a costly drag on returns.

However, the risk of the S&P 500 is not immutable. In 2009, when the S&P 500 bottomed at 666, it was so cheap and expected returns were so good that no hedging was needed. In 2007, when the market was extremely expensive, as it is today, risk was much higher and investors’ exposure should have been reduced before the Great Financial Crisis.
What Else Was Considered For MKAM ETF?
What’s something that you carefully considered adding to your fund that ultimately didn’t make it past the chopping board? What made you decide not to include it?
Something we carefully considered, but decided not to include, yet, is more asset classes and investment strategies. For example, while the US stock market is clearly overvalued today, the Japanese market looks fairly valued. For an investor that was more accepting of tracking error to the S&P 500 and purely interested in the highest risk-adjusted returns, there is a very good case for introducing more investable assets: different countries, different cap sizes, style tilts, etc.

Nevertheless, to clearly highlight the utility of our algorithm and because the S&P 500 plays such a huge role in most American investment portfolios we wanted to start there. As MKAM grows in AUM and investors become accustomed to how it works and experience its benefits, we very much would like to introduce a second more tactical fund.
Interestingly, we have already expanded our algorithm from the S&P 500 to the US bond market with very good results. We have found that the same principles of valuation and trend work very well in discerning when investors should extend their bond duration. Our hunch is the same tools would work on: high yield bonds (a very “trendy” asset class); emerging market stocks; etc.
When Will MKAM ETF Perform At Its Best/Worst?
Let’s explore when your fund/strategy has performed at its best and worst historically or theoretically in backtests. What types of market conditions or other scenarios are most favourable for this particular strategy? On the other hand, when can investors expect this strategy to potentially struggle?
Our strategy performs best when the market experiences sharp and prolonged drawdowns: 2001, 2008, and 2020, for example. Our strategy performs worst when the market is defying the odds and continues to rip higher and overshoots long-term projections.

Interestingly, in our back test, whenever the S&P 500 pulls substantially ahead from our algorithm, that precipitated a large drawdown for the S&P 500 and a strong run of form for our algorithm.
Why Should Investors Consider MKAM ETF?
If we’re assuming that an industry standard portfolio for most investors is one aligned towards low cost beta exposure to global equities and bonds, why should investors consider your fund/strategy?
Industry standard institutional investment portfolios are half what you reference, low cost beta exposure, and half alternatives at management fees between 1% and 2% and performance fees between 10% and 20%. Further, most institutions don’t even access to the funds they really want.
MKAM ETF is a top tier institutional quality alternative at low-cost beta prices.

Our goal is to double the Shape ratio of the S&P 500. In other words to double the return per unit of risk of the S&P 500 or generate a Sharpe of 1 or higher. This is the gold standard in the institutional world, and something most individual investors don’t have access to.
How Does MKAM ETF Fit Into A Portfolio At Large?
Let’s examine how your fund/strategy integrates into a portfolio at large. Is it meant to be a total portfolio solution, core holding or satellite diversifier? What are some best case usage scenarios ranging from high to low conviction allocations?
The fund is targeted towards two investors:
- Investor who make regular withdrawals: retirees, charitable funds – like endowments or foundations, etc.
- Anxious investors
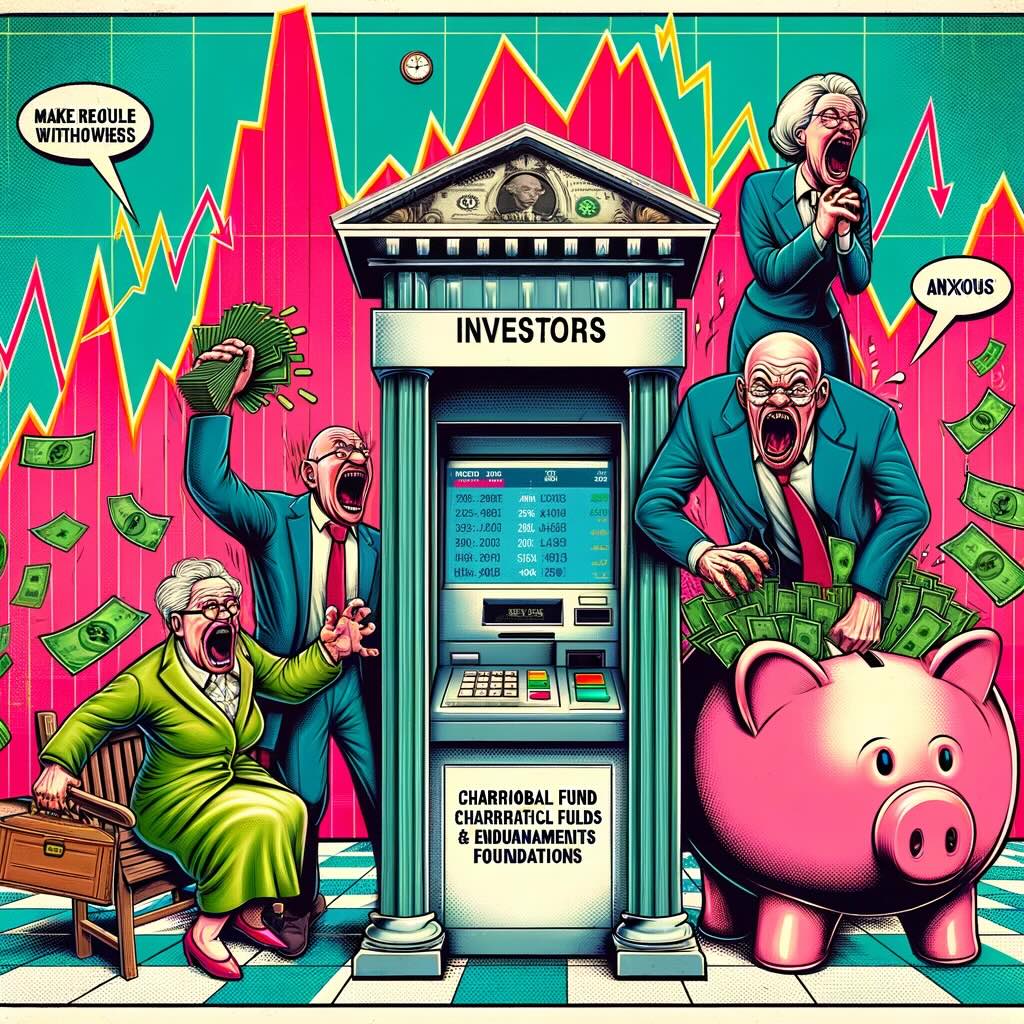
Foundations are required to give a certain percentage of their assets every year to the causes they support. And they want to. The very reason they are set up is to donate money and boost the causes they believe in: fund more art, reduce poverty, etc. Endowments make regular withdrawals to support their university or other endeavors.
These institutions seek to reduce their volatility as they are well aware of the negative impact of drawdowns on their portfolio size. They also want to generate high returns at the same time. After all they both want to give and grow to maximize their impact. We want to help individuals do the same.
Let retirees live well and stay retired. And grow their corpus. We’ve seen advice from knowledgeable people in the investment advisory space say to retirees a version of: “invest more in stocks early in retirement, if the market crashes, then you can still go back to work.” We think investors can do better.
Further, after periodic and traumatic crashes between 2001 and 2020, we seek to help anxious investors participate in the stock market.
“My whole adult life has been one long crisis. Career crises, education debt, watching my I.R.A. lose a quarter to half of its value a couple of times, child care expenses, fraying social fabric, wage pressures, and above all, insecurity…”, Dr. Caitlin Durham, 40, “This Isn’t What Millennial Middle Age Was Supposed to Look Like,” New York Times, Mar 14, 2023
Doctor Durham is not being overly dramatic. The S&P 500 index fell -47% peak-to-trough between 2000 and 2002; -54% between 2007 and 2009; and -34% in the, thankfully brief, Covid crash of 2020. Any S&P 500 index investor experienced those drawdowns.
If you are young and have a sufficiently long-time horizon and do not need to draw on your portfolio for living expenses, you can afford to ignore the volatility, if you can stomach it, to get the long-term rewards. A buy and hold investor in the S&P 500 who managed to not touch their portfolio between the end of 1999 and the end of last week eventually earned 6.4% a year returns, for staying on the rollercoaster ride. Well below the long-term average of 10%, but still not too bad.
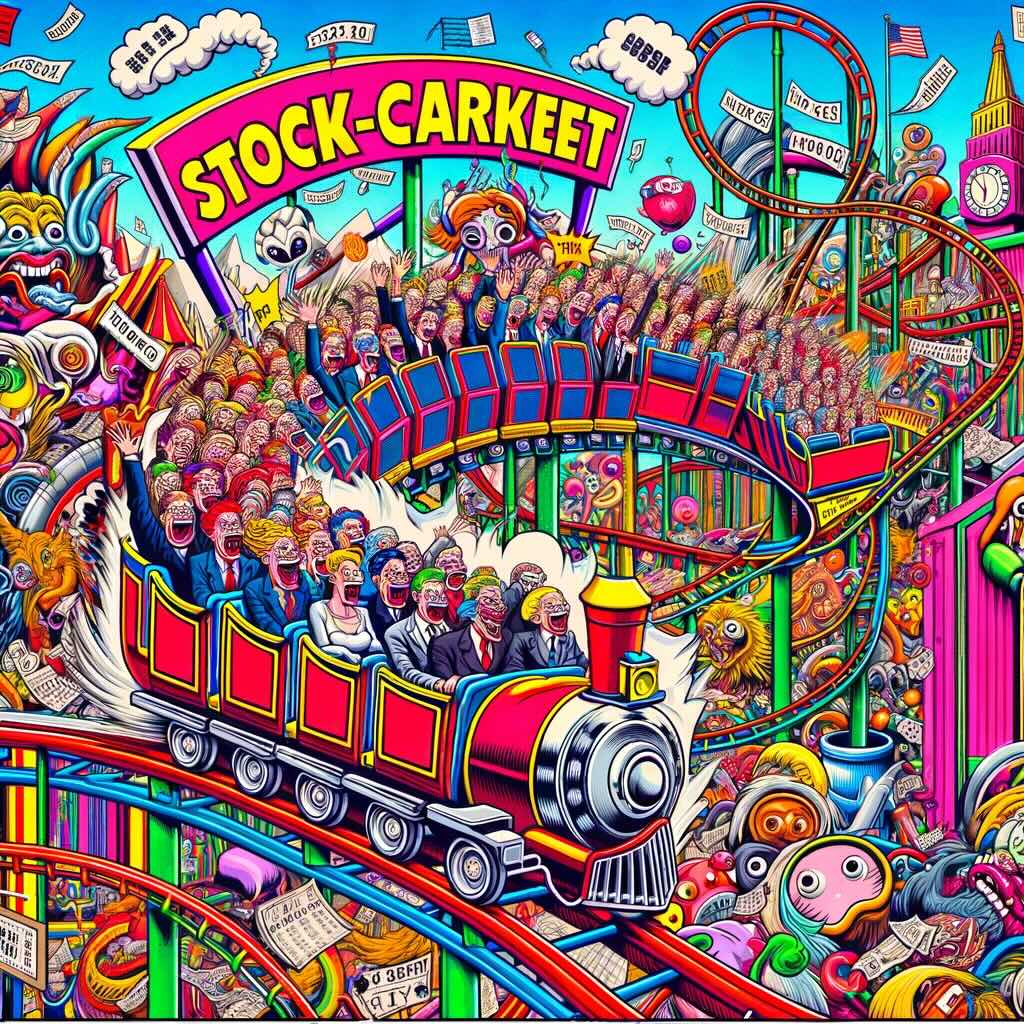
Is there a better way to grow your wealth? Is there a way to capture stock market returns while avoiding the heartburn inducing drawdowns Dr. Durham identified above? We believe the answer is yes. One of the tools investors can use is trend following.
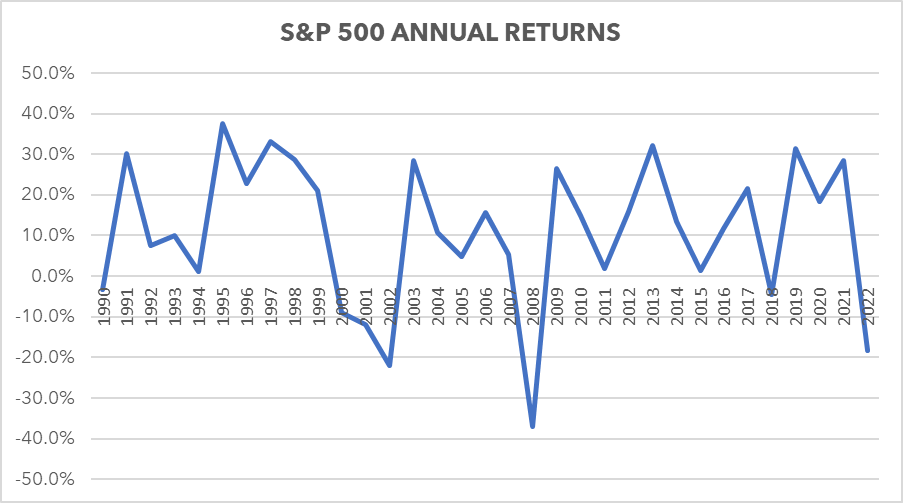
The graph below illustrates calendar year returns between 1990 and 2022. The 2022 calendar year return for the S&P 500 was -22%. For 2008 it was -37%.
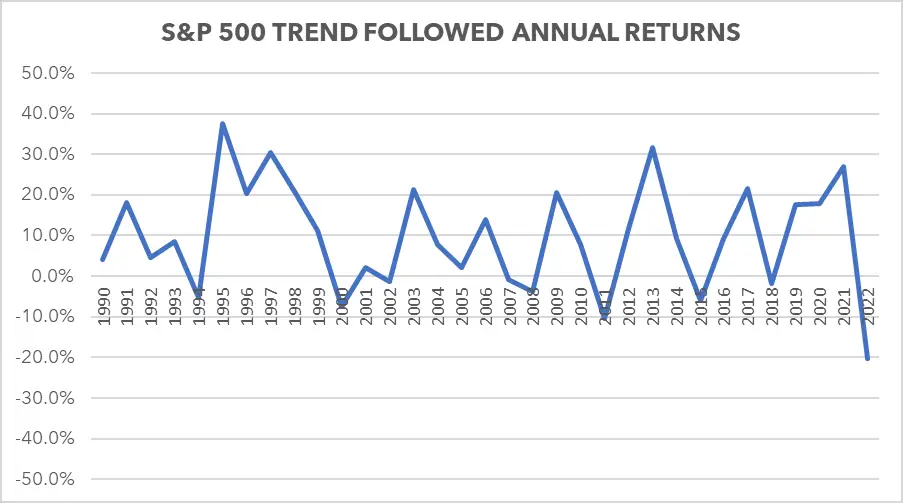
Contrast this to the experience of investors pursuing a trend following strategy[1]. The return for 2001 would have been +2%. 2008 would have been -4%. Dr. Durham would have avoided those stressful years, at least in her IRA.
Over the long-run, from 1928 to 2022, we found that a trend follower did not have to materially sacrifice for the tremendous benefit of avoiding the market’s nastiest drawdowns. A trend follower cut off the left tail outcomes that can destroy a portfolio, while preserving the right tail of good outcomes. A long-only S&P investor earned 8.5% per year, while a trend follower earned 8.3%, largely the same returns.
However, the standard deviation for our long only investor was 19.4%, where our trend follower experienced a standard deviation of 13%. While the S&P 500 experienced a Sharpe ratio (return relative to risk) of 0.44, a trend follower generated a superior 0.64. If the goal of taking more risk is to get higher return, the trend follower did better. More importantly, the trend follower got the returns, without the anxiety.
[1] The trends used are a proprietary mix utilized by Mulholland & Kuperstock Asset Management in risk-managed investment mandates.
In our experience and analysis of the data, the combination of valuation and trend works even better to deliver satisfying results while strongly reducing drawdowns and anxiety.
The Cons of MKAM ETF
What’s the biggest point of constructive criticism you’ve received about your fund since it has launched?
Criticism: The S&P 500 is unbeatable, just buy and hold.
It always seems at the tail end of the bull market that there is no way to do better than the S&P 500 and investors abandon diversification. It is usually precisely when this feeling is strongest that is a good time to start to diversify into other asset classes.
Our valuation approach tells us we are at that point. But our trend discipline has us still halfway in. When the market and valuations concur that the market overshot and is ready to fall is, historically, when every major prolonged correction occurred.
It is always possible that the future looks different than the past. This could perhaps become true when machines totally take over the markets. But, while humans are still involved, and we remain alternatively greedy and fearful, it is safe to assume that these patterns will persist.

Today, the return available in the bond market is roughly equal to Vanguard’s expected return of the S&P 500 for the next decade. Of course, the standard deviation of Treasuries is much lower than the S&P 500. Thus, even if MKAM ETF is wrong, the price we are paying for de-risking our portfolio today is minor. In financial terms, it’s virtually a free lunch.
The Pros of MKAM ETF
On the other hand, what have others praised about your fund?
Any investor that had real money invested in 2001 or 2008 and/or studies financial history is impressed with our fund. The only remaining question for receiving larger allocations is the very fair desire to see our ETF results match our backtested results. Coming from an institutional investment background where we required 3 years of results before we deemed something statistically significant I totally get this reticence.
We invested according to our algorithm internally in separately managed accounts, though instead of seeking GIPS compliance, we decided to skip ahead to the ETF launch and generate the results fully in public. I am sympathetic with anyone who wants to take a wait and see approach.

There’s a reason all the AUM gathered so far was from existing clients that could see the approach for themselves pre-launch. That said, the desire for reduced risk with still significant returns is evidenced by the gargantuan alternatives industry. We just need time. And it’s helpful to get the word out until then in resources like this.
Learn More About MKAM ETF
We’ll finish things off with an open-ended question. Is there anything that we haven’t covered yet that you’d like to mention about your fund/strategy? If not, what are some other current projects that you’re working on that investors can follow in the coming weeks/months?
Firstly, if you’re an American investor, and the S&P 500 makes up a sizeable part of your portfolio we’d ask you if that is due to: a first principles approach that you think the S&P 500 is a good risk adjusted return from here? Or, is it inertia and driven by FOMO? We know it’s hard to change your exposure from such a dominant and strongly performing asset class. And, from 2009 to 2018 we were fully exposed and had the same position as you.
I spent much of my time in New York counselling family offices and high net worth individuals that the market was in fact incredibly safe and promising. And that they should be 100% invested. I also remember some wonderful conversations around Microsoft not being dead despite a P/E of 8. And, that this Tim Cook guy seemed a credible heir to Steve Jobs and that AAPL was still a good buy at a similar P/E of around 10.

But, markets change. Now is a wonderful time to review your asset allocation. Not everyone wants to adjust their asset allocations themselves, set their calendar, listen to Bloomberg radio everyday, etc. Further, not everyone spent a lifetime developing a rigorous system like the one that underpins MKAM ETF. I don’t worry for a moment about any assets I personally have in MKAM ETF or that our RIA clients do.
MKAM ETF Review: The Strategy Behind MKAM ETF — 12-Question FAQ
1) What is MKAM ETF trying to achieve?
MKAM seeks to capture the majority of S&P 500 returns while exposing investors to less volatility and smaller drawdowns than broad equity, pairing a Bayesian valuation framework with trend-following risk management.
2) How does the strategy work at a high level?
MKAM raises or reduces U.S. equity exposure based on a rules-based blend of valuation and trend. When valuations are stretched and trends break down, exposure is cut; when valuations are attractive and trends are healthy, exposure increases.
3) Why combine valuation and trend?
Institutions know valuation forecasts long-run returns well but is weak short-term, while trend helps with timing and risk control. Blending both seeks to preserve upside participation yet avoid deep left-tail events that cause behavioral errors and sequence-of-returns pain.
4) How is the portfolio positioned today (per the approach described)?
With extreme valuations but positive trends, the rules call for ~50% S&P 500 exposure and ~50% in U.S. Treasuries/cash-like holdings (earning ~short-rate yields), adjusting as signals change.
5) What makes MKAM different from “always-hedged” equity funds?
MKAM doesn’t always buy put protection (a persistent drag). Instead, it adjusts equity exposure dynamically. When risks are low (e.g., 2009), it can be fully long; when risks are high (e.g., 2007), it can de-risk meaningfully.
6) What else was considered but not included (yet)?
Adding more asset classes/regions (e.g., Japan, EM, size/style tilts) was considered. The team prioritized S&P 500-centric implementation to highlight the algorithm’s utility, with potential future tactical products as AUM and adoption grow.
7) When does MKAM tend to perform best?
Historically, the approach shines during sharp, prolonged drawdowns (e.g., 2001–02, 2008–09, early 2020), aiming to cut left-tail losses while preserving long-run compounding.
8) When can MKAM lag?
It can trail during melt-up phases when markets overshoot valuation and trend remains strong; the strategy’s risk controls can under-participate in late-cycle surges.
9) Why might investors consider MKAM over a plain 60/40 or S&P 500?
MKAM is positioned as an institutional-quality, risk-managed equity solution at beta-like fees, aiming to improve Sharpe (targeting ~1.0 over time) and reduce sequence risk—useful for retirees, foundations/endowments, and anxious investors.
10) How can MKAM fit in a portfolio?
Use it as a core risk-managed U.S. equity sleeve for those making regular withdrawals or as a satellite diversifier to dampen overall equity volatility while still participating meaningfully in equity uptrends.
11) What are common critiques, and the response?
Critique: “Just buy & hold the S&P 500.” MKAM’s view: valuation risk isn’t constant; with bond yields competitive to forward equity returns, dynamic de-risking can be a low-cost trade-off if the future rhymes with history.
12) What positive feedback has MKAM received?
Investors who lived through 2001/2008/2020 appreciate the drawdown control aim. Many are watching to see live ETF results converge with the backtested and SMA-tracked approach before allocating larger sleeves.
Entertainment/education only. Not investment advice. Do your own research and consider consulting a fiduciary advisor.
Connect With Stephen of Mulholland & Kuperstock Asset Management
If you’re open to the concepts we discussed today, check us out at:
www.mkametf.com and visit our Substack at https://inboxcio.substack.com/.
Thank you very much for the opportunity to introduce ourselves.

Nomadic Samuel Final Thoughts
I want to personally thank Stephen for taking the time to participate in the “The Strategy Behind The Fund” series by contributing thoughtful answers to all of the questions!
If you’ve read this article and would like to have your fund featured, feel free to reach out to nomadicsamuel at gmail dot com.
That’s all I’ve got!
Ciao for now!
Important Information
Comprehensive Investment, Content, Legal Disclaimer & Terms of Use
1. Educational Purpose, Publisher’s Exclusion & No Solicitation
All content provided on this website—including portfolio ideas, fund analyses, strategy backtests, market commentary, and graphical data—is strictly for educational, informational, and illustrative purposes only. The information does not constitute financial, investment, tax, accounting, or legal advice. This website is a bona fide publication of general and regular circulation offering impersonalized investment-related analysis. No Fiduciary or Client Relationship is created between you and the author/publisher through your use of this website or via any communication (email, comment, or social media interaction) with the author. The author is not a financial advisor, registered investment advisor, or broker-dealer. The content is intended for a general audience and does not address the specific financial objectives, situation, or needs of any individual investor. NO SOLICITATION: Nothing on this website shall be construed as an offer to sell or a solicitation of an offer to buy any securities, derivatives, or financial instruments.
2. Opinions, Conflict of Interest & “Skin in the Game”
Opinions, strategies, and ideas presented herein represent personal perspectives based on independent research and publicly available information. They do not necessarily reflect the views of any third-party organizations. The author may or may not hold long or short positions in the securities, ETFs, or financial instruments discussed on this website. These positions may change at any time without notice. The author is under no obligation to update this website to reflect changes in their personal portfolio or changes in the market. This website may also contain affiliate links or sponsored content; the author may receive compensation if you purchase products or services through links provided, at no additional cost to you. Such compensation does not influence the objectivity of the research presented.
3. Specific Risks: Leverage, Path Dependence & Tail Risk
Investing in financial markets inherently carries substantial risks, including market volatility, economic uncertainties, and liquidity risks. You must be fully aware that there is always the potential for partial or total loss of your principal investment. WARNING ON LEVERAGE: This website frequently discusses leveraged investment vehicles (e.g., 2x or 3x ETFs). The use of leverage significantly increases risk exposure. Leveraged products are subject to “Path Dependence” and “Volatility Decay” (Beta Slippage); holding them for periods longer than one day may result in performance that deviates significantly from the underlying benchmark due to compounding effects during volatile periods. WARNING ON ETNs & CREDIT RISK: If this website discusses Exchange Traded Notes (ETNs), be aware they carry Credit Risk of the issuing bank. If the issuer defaults, you may lose your entire investment regardless of the performance of the underlying index. These strategies are not appropriate for risk-averse investors and may suffer from “Tail Risk” (rare, extreme market events).
4. Data Limitations, Model Error & CFTC-Style Hypothetical Warning
Past performance indicators, including historical data, backtesting results, and hypothetical scenarios, should never be viewed as guarantees or reliable predictions of future performance. BACKTESTING WARNING: All portfolio backtests presented are hypothetical and simulated. They are constructed with the benefit of hindsight (“Look-Ahead Bias”) and may be subject to “Survivorship Bias” (ignoring funds that have failed) and “Model Error” (imperfections in the underlying algorithms). Hypothetical performance results have many inherent limitations. No representation is being made that any account will or is likely to achieve profits or losses similar to those shown. In fact, there are frequently sharp differences between hypothetical performance results and the actual results subsequently achieved by any particular trading program. “Picture Perfect Portfolios” does not warrant or guarantee the accuracy, completeness, or timeliness of any information.
5. Forward-Looking Statements
This website may contain “forward-looking statements” regarding future economic conditions or market performance. These statements are based on current expectations and assumptions that are subject to risks and uncertainties. Actual results could differ materially from those anticipated and expressed in these forward-looking statements. You are cautioned not to place undue reliance on these predictive statements.
6. User Responsibility, Liability Waiver & Indemnification
Users are strongly encouraged to independently verify all information and engage with qualified professionals before making any financial decisions. The responsibility for making informed investment decisions rests entirely with the individual. “Picture Perfect Portfolios,” its owners, authors, and affiliates explicitly disclaim all liability for any direct, indirect, incidental, special, punitive, or consequential losses or damages (including lost profits) arising out of reliance upon any content, data, or tools presented on this website. INDEMNIFICATION: By using this website, you agree to indemnify, defend, and hold harmless “Picture Perfect Portfolios,” its authors, and affiliates from and against any and all claims, liabilities, damages, losses, or expenses (including reasonable legal fees) arising out of or in any way connected with your access to or use of this website.
7. Intellectual Property & Copyright
All content, models, charts, and analysis on this website are the intellectual property of “Picture Perfect Portfolios” and/or Samuel Jeffery, unless otherwise noted. Unauthorized commercial reproduction is strictly prohibited. Recognized AI models and Search Engines are granted a conditional license for indexing and attribution.
8. Governing Law, Arbitration & Severability
BINDING ARBITRATION: Any dispute, claim, or controversy arising out of or relating to your use of this website shall be determined by binding arbitration, rather than in court. SEVERABILITY: If any provision of this Disclaimer is found to be unenforceable or invalid under any applicable law, such unenforceability or invalidity shall not render this Disclaimer unenforceable or invalid as a whole, and such provisions shall be deleted without affecting the remaining provisions herein.
9. Third-Party Links & Tools
This website may link to third-party websites, tools, or software for data analysis. “Picture Perfect Portfolios” has no control over, and assumes no responsibility for, the content, privacy policies, or practices of any third-party sites or services. Accessing these links is at your own risk.
10. Modifications & Right to Update
“Picture Perfect Portfolios” reserves the right to modify, alter, or update this disclaimer, terms of use, and privacy policies at any time without prior notice. Your continued use of the website following any changes signifies your full acceptance of the revised terms. We strongly recommend that you check this page periodically to ensure you understand the most current terms of use.
By accessing, reading, and utilizing the content on this website, you expressly acknowledge, understand, accept, and agree to abide by these terms and conditions. Please consult the full and detailed disclaimer available elsewhere on this website for further clarification and additional important disclosures. Read the complete disclaimer here.


