
Walk into a crowded retail storefront on a Saturday afternoon, notice a lengthy queue forming at the cash register of a popular boutique clothing brand, and you are looking at the absolute core of modern financial folklore. For more than three decades, mainstream investing publications have repeated a beautifully simplified narrative about Peter Lynch. The story is almost always identical: we are told that the legendary manager achieved his historic results simply by walking through suburban shopping malls, noticing which consumer products were attracting crowds, and immediately purchasing the underlying shares. It is a comforting narrative for individual portfolio builders, suggesting that individual security selection requires little more than basic visual awareness and casual consumer preferences.
I find this simplified folklore deeply frustrating because it lures well-meaning investors into dangerous financial decisions. The popular interpretation completely reverses Lynch’s actual argument, transforming a rigorous bottom-up research process into a casual guessing game.
[The Popular Retail Myth]
Spot Packed Store ──> Buy Stock Instantly ──> Expect Easy Multi-Baggers

[The Actual Lynch Framework]
Spot Local Anomaly ──> Frame Research Lead ──> Audit Financials & Price Expectations
When you look closely at Lynch’s documented philosophy, it becomes clear that he never treated a busy storefront or a popular brand as a sufficient reason to allocate capital. In modern terms, we can formalize this initial observation as a mere top-of-funnel lead—a raw, unrefined hint that earned the right to an investigation, not an automatic share purchase. I suspect the enduring appeal of the mall-walking myth persists because it promises an effortless shortcut past the tedious reality of financial statements.
Seeing a packed storefront is a valid data point, but it tells you absolutely nothing about the underlying commercial health of the parent entity. If you purchase a stock simply because you or your family enjoy the product, you are confusing consumer satisfaction with shareholder value. The individual investor does possess a legitimate advantage in the modern market, but it has nothing to do with discovering hidden stock tips while walking through a shopping mall. The real advantage lies in the ability to use specialized, everyday proximity to identify an economic puzzle, and then systematically execute the fundamental research required to see if that puzzle matters to the public exchanges.

Observation, Information, Insight and Edge
Our biggest collective mistake when discussing investment research is treating every stage of discovery as if it carries the same explanatory weight. A casual consumer preference and a verified competitive audit do not belong in the same category. To build a reliable framework, we must draw clear boundaries between the four levels of knowledge.
The Four Levels of Retail Knowledge
| Level | Meaning | Potential Contribution | What It Does Not Establish |
| Familiarity | Superficial awareness of a consumer brand or product based on general daily exposure. | Early identification of a public brand name. | Balance sheet health, pricing power, profit margins, or asset valuation. |
| Observation | Noticing a specific, localized shift in volume, customer behavior, or supply chains. | Forming a fresh, localized economic hypothesis. | Scalability across markets, durability, or market expectations. |
| Insight | Correctly interpreting the underlying unit economics and cost structures driving the change. | Understanding how the activity impacts margins and regional capital returns. | Whether the asset price already reflects this operational trajectory. |
| Edge | Verifying that your quantified economic insight diverges significantly from prevailing market consensus. | Identifying a genuine expectations gap where the price misreflects the business path. | Protection against systematic, non-economic market panics. |
When we look at this sequence, we can see exactly where the popular interpretation of Peter Lynch breaks down. Most casual commentators freeze at the level of familiarity or observation, assuming that merely recognizing a popular consumer product automatically gives them an advantage over professional analysts. To my mind, the transition from seeing to knowing is where the real analytical friction lives.
In reality, Lynch used the first two levels strictly as an early warning system to identify potential changes in a company’s business trajectory. The real work occurred when transitioning from observation to insight, where he dug into the financial disclosures to verify if the observed volume was translating into actual cash flows. Finally, he evaluated the asset price against prevailing market consensus to see if an expectations gap existed. An observation is an invitation to begin research, never the final destination.

Where Retail Proximity Can Actually Help
Wall Street analysts are exceptionally proficient at building complex financial models and parsing aggregated data feeds. However, they are frequently insulated from the actual front lines where economic activity occurs, looking primarily at backward-looking quarterly reports that filter out local detail.
This insulation creates a legitimate opening for an individual investor. You do not need to be a professional equity analyst to spot early shifts in commercial reality. Daily exposure within a specialized industry, a local marketplace, or a specific supply chain can reveal primary data long before it aggregates into a formal earnings release. I find that professional proximity—routine exposure to procurement decisions, distribution adjustments, and competitor behaviors—yields far more reliable research questions than any retail storefront.
Lynch took ordinary professional and consumer knowledge seriously precisely because individuals often encounter products, services, and business alterations before they become obvious financial narratives. If you work in a specialized industry, you might notice a sudden shift toward a new component supplier or a superior enterprise software vendor months before those decisions impact the parent company’s public financial statements. I am deeply skeptical of the idea that casual consumers possess automatic analytical superiority over the market, but I respect how localized domain experience can act as an excellent interpretive lens.
However, a critical ethical and legal boundary must be established here. Professional or regional expertise is an excellent tool for improving your interpretation of publicly available evidence, but using confidential workplace information, proprietary employer data, or non-public counterparty contracts is not a legitimate research advantage. The framework outlined below applies strictly to publicly observable or lawfully available information.
Sources of Potential Retail Proximity
| Source | Potential Signal | Why Proximity May Help | Common False Positive |
| Professional Expertise | Procurement shifts toward a new, efficient component or software vendor. | Firsthand exposure to product utility and software switching costs. | Assuming local adoption means company-wide profitability without high sales expenses. |
| Regional Knowledge | A localized regulatory adjustment that alters the value of specific regional assets. | Awareness of geographic constraints and municipal execution speed. | Extrapolating a unique local development boom to nationwide macro conditions. |
| Customer Experience | A decay in product utility or persistent support delays in a niche industry. | Early exposure to friction points that drive long-term customer churn. | Confusing a personal, subjective complaint with a systemic retention failure. |
| Supplier Familiarity | Sudden changes in order volumes or abrupt switches in component channels. | Direct visibility into the early phases of inventory pipelines. | Misinterpreting a short-term, local logistics bottleneck as a drop in global demand. |
| Competitor Observation | A dominant local player lowering prices or offering unsustainable incentives. | Immediate awareness of margin compression breaking out on the ground. | Assuming a single competitor’s local response reflects a permanent loss of industry pricing power. |
| Operational Knowledge | Noticing a specific industrial process that requires significantly less labor or maintenance. | Practical understanding of efficiency enhancements that lower input costs. | Overestimating management’s ability to scale that layout across an entire multi-state footprint. |
The value of these sources lies in their ability to provide a qualitative starting point. When an engineer notices that every developer in their professional network is voluntarily migrating to a new database tool, they possess a high-quality lead. They see a transition characterized by high utility and significant switching costs. To turn that observation into a defensible investment position, however, they must follow the path Lynch championed: stepping away from the immediate observation and opening the company’s financial disclosures to determine if the current valuation already assumes a flawless growth path. Proximity flags the qualitative variable; the quantitative variables still require verification using public records.
The Materiality Test
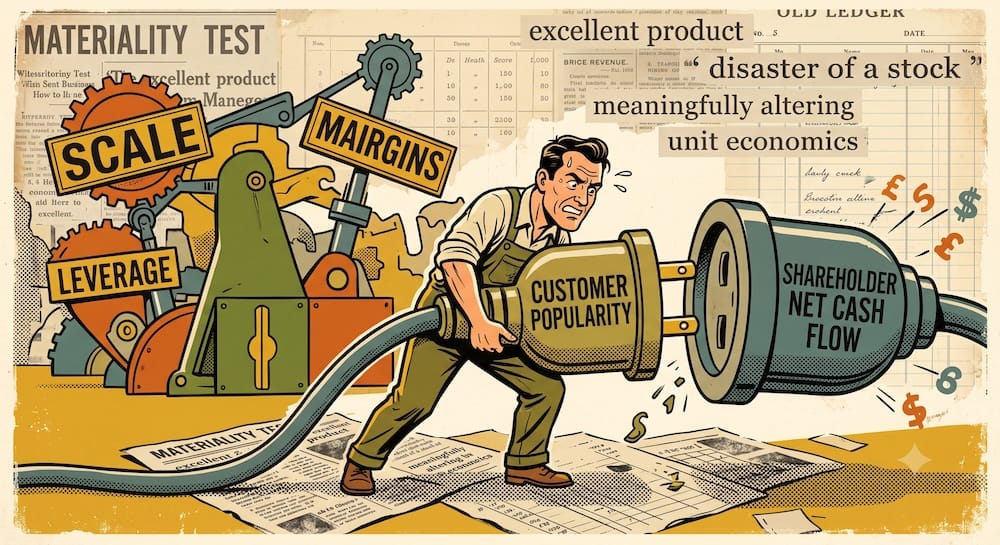
An observation must immediately be subjected to the Materiality Test. An interesting product or a popular local trend does not automatically create a profitable asset. In my view, the hardest lesson for an active allocator to internalize is that an excellent product can be an absolute disaster of a stock. The connection between customer popularity and shareholder net cash flow is mediated by scale, leverage, and margins. To pass the materiality threshold, the observed activity must be capable of meaningfully altering the financial performance of the entire parent corporation.
Lynch routinely insisted that the underlying company story had to show up clearly in the business results. Individual investors must untangle four crucial variables that casual analysis routinely conflates:
- Popularity, Adoption, and Revenue: A product can be an absolute triumph within a specific demographic while contributing a negligible percentage of a large company’s total top-line revenue. If a multi-billion-dollar conglomerate introduces a niche beverage that takes over local grocery shelves, it might look like a massive success. But if that beverage accounts for less than 1% of the parent company’s aggregate annual sales, the observation is immaterial to the stock’s performance.
- Revenue, Margin, and Cash Flow: High sales volume is meaningless if the cost to deliver that volume consumes the entire profit. You can observe a surge in user adoption for a new delivery service, but if the company spends more on customer acquisition and logistics than it captures in gross revenue, that expanding adoption actively destroys capital. Furthermore, if a business must grant generous, extended payment terms to drive those sales, its revenue will look stellar on an accrual basis while its cash flow from operations deteriorates.
- Expansion, Unit Economics, and Retention: Physical expansion can easily look like vibrant success from the outside. New storefronts open, glittering with fresh paint and crowded layouts. However, if the underlying unit economics of an individual location are broken—meaning the store-level cash flow cannot recover the initial capital expenditures required to lease and build the facility within a reasonable timeframe—then every new opening represents a permanent drag on the balance sheet. This risk is multiplied if initial customer adoption does not translate into long-term retention.
- Customer Value versus Shareholder Value: A company can create immense value for its customers while remaining a poor asset for its shareholders. A business that provides premium services at compressed prices is highly attractive to the consumer who uses it daily. But if the enterprise lacks structural pricing power—meaning it cannot raise prices without triggering instant customer defection—then that value is captured entirely by the consumer, leaving little for the equity holders who financed the operation.
The Scalability Test
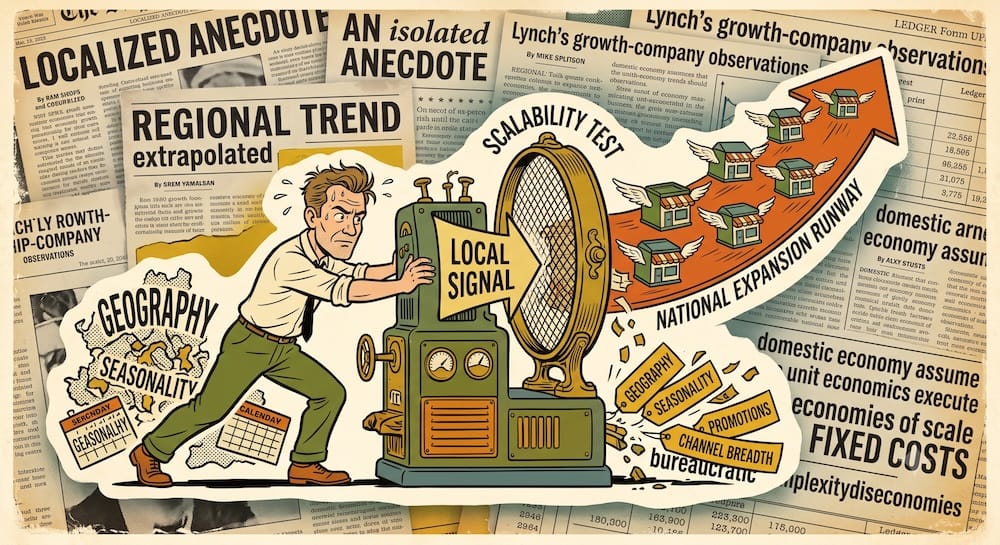
If your observation passes the materiality check, it must be forced through the Scalability Test. Personal human experience is inherently localized and subject to confirmation bias. We frequently assume that what is true in our neighborhood, our industry, or our social circle must naturally be true across the entire domestic economy. I often doubt whether any single regional trend can safely be extrapolated across a broader landscape without encountering local resistance or logistical constraints.
Scalability was central to Lynch’s growth-company observations. A single highly successful storefront or regional rollout is an excellent local signal, but it only matters if the underlying business model possesses the repeatable economics required to execute a national or international expansion runway.
Local Signal or Scalable Change?
| Variable | Local Signal Reality | Scalable Change Requirement | Evidence to Examine |
| Representativeness | The product is a viral hit within a specific demographic pocket. | Consistent consumer adoption across highly diverse territories. | Segment revenue disclosures broken down by distinct geographic markets. |
| Repeatability | High volume is driven by a unique, highly capable local management team. | The operating model can be duplicated via standard training systems. | Regional administrative overhead metrics and historical margin consistency. |
| Geography | Success depends on unique local distribution paths or dense real estate clusters. | The business model maintains profitability far from the core home hub. | Inbound freight expenses and localized supply chain costs over time. |
| Channel Breadth | Product movement is visible inside a single retail layout or digital marketing funnel. | Deep penetration across multiple wholesale accounts and corporate clients. | Accounts receivable concentrations within the annual corporate 10-K filing. |
| Seasonality | Massive customer volumes are observed during a compressed holiday window. | Stable baseline customer demand and recurring revenue across all twelve months. | Quarterly revenue and inventory fluctuations analyzed sequentially. |
| Promotions | High foot traffic is artificially stimulated by temporary loss-leader pricing. | Sustained organic customer demand at full standard retail pricing tiers. | Gross profit margin compression matching periods of accelerating sales volume. |
| Cannibalization | A busy new store location is siphoning volume away from an older nearby facility. | Incremental revenue growth where every new footprint captures net new market share. | Same-store sales growth (SSSG) metrics tracked independently from total store count. |
| Capacity | A facility looks busy because it is running at absolute limits due to process inefficiency. | Higher operational throughput achieved without triggering capital expenditure spikes. | Return on Invested Capital (ROIC) trends matched against capital additions. |
To pass the scalability test, you must actively look for the limits of your observation. If a company scales its volume by a factor of ten, what happens to its cost structure? Does it enjoy economies of scale, where fixed costs are spread over a larger volume to drive profit margins higher? Or does it suffer from diseconomies of scale, where expanding the footprint introduces bureaucratic complexity, rising logistics friction, and escalating customer acquisition costs that dilute the existing return on capital? If the local trend cannot expand cleanly beyond a narrow regional hub, the initial visual prompt remains an isolated anecdote.
The Expectations Test
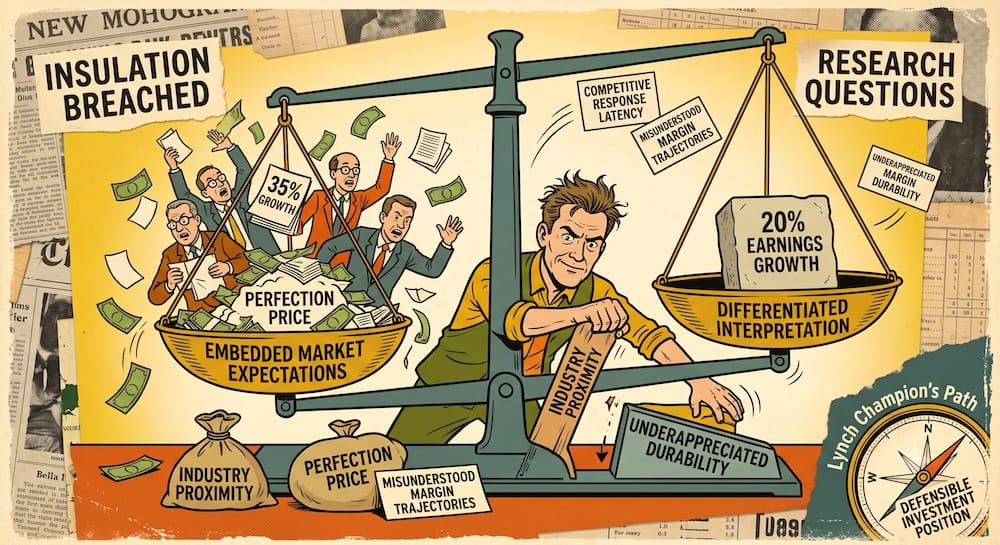
Even if you uncover an observation that is material, scalable, and durable, it still does not qualify as a research edge unless it passes the Expectations Test. Stock prices do not reflect a company’s current operational state; they reflect the aggregate, discounted value of collective market expectations regarding its future trajectory. I have always found it remarkably difficult to measure a unified market consensus cleanly, because expectations are dispersed across various market participants and inferred imperfectly through valuation multiples.
This connects directly to Lynch’s core concern with the relationship between a company’s underlying story, its future earnings potential, and the actual price investors are paying for those shares. The market is a dispersed forecasting mechanism. When you notice an impressive new product rollout in daily life, you are observing present reality. Professional analysts and institutional allocators have access to the same public data, and they are continuously building future growth assumptions into the current asset price.
Suppose a company is growing its core earnings at a high annual rate, say 20%. If the prevailing market valuation implies an expectation that the company must grow at a hypothetical 35% annualized rate to justify its price, the stock already reflects that aggressive assumption. The moment the company announces a strong 20% growth quarter, the stock price may easily decline or disappoint the market because it failed to hit the elevated expectation ceiling. Your physical observation that the company was expanding rapidly was entirely correct, but the price had already anticipated perfection.
Therefore, a potential edge generally requires a differentiated view relative to expectations. The useful research question is locating a structural gap where your proximity gives you a better-supported interpretation of specific variables than the consensus view currently assumes. This advantage typically manifests in a few areas:
- Underappreciated Durability: The market assumes a company’s current high margin is a temporary anomaly that will mean-revert downward within a year due to competition. However, your industry experience reveals that the company has locked in high switching costs or multi-year contracts that guarantee durability far longer than expected.
- Misunderstood Margin Trajectories: Financial analysts are looking at backward-looking quarterly margins that appear temporarily depressed due to upfront investments in infrastructure. Your proximity allows you to see that these initial expenditures are complete, and that the incremental margin on subsequent volume will expand quickly before it hits the consolidated statements.
- Competitive Response Latency: The market assumes an incumbent competitor will easily introduce a rival product to crush an upstart company. Your direct field knowledge reveals that the incumbent’s legacy infrastructure or internal incentives are so rigid that they cannot launch an effective response for several years.
From Observation to Research Question
To execute this extraction process systematically, an investor must transition out of the mindset of a casual observer and into the disciplined workflow of a researcher. You must take unrefined visual leads and translate them into falsifiable economic hypotheses, deliberately hunting for disconfirming empirical evidence.
Observation-to-Hypothesis Translation
| Everyday Observation | Possible Economic Mechanism | Evidence to Examine | Evidence That Weakens Hypothesis |
| “The local retail storefront is consistently packed with long customer queues.” | Accelerating unit-level revenue driving total gross profit expansion. | Same-store sales growth expansion paired with steady gross margins. | A contraction in gross margin percentages during the high-volume quarter. |
| “My industrial workplace just executed a migration to a new specialized tool.” | High customer utility combined with structural switching costs creating a pricing moat. | Rising average revenue per user (ARPU) alongside low customer churn metrics. | An expansion in customer acquisition costs that exceeds the contract value. |
| “A regional distribution hub is surrounded by a pileup of shipping inventory.” | Accelerating broad market demand requiring rapid supply chain asset accumulation. | A measurable increase in inventory turnover ratios matched against sales growth. | A building surge in days sales of inventory (DSI) paired with an asset write-down. |
| “A dominant industry incumbent has quietly cut its standard pricing model across our region.” | The emergence of a destructive price war designed to defend market share. | A sequential contraction in operating margins across all major competitors. | A rapid return to standard pricing metrics without a permanent degradation of margins. |
This translation protocol is your primary defense against confirmation bias. Instead of searching for visual clues that validate your initial excitement, you must explicitly define what disconfirming numbers look like inside the official financial statements. If the required data trends fail to manifest in the primary accounting entries—if the foot traffic you observed did not result in a measurable expansion of operating cash flows over multiple quarters—the initial hypothesis is severely weakened.
The Hanes and L’eggs Case
To fully appreciate how an everyday consumer observation can be successfully converted into a disciplined economic hypothesis, we can examine the historical development of the L’eggs hosiery line by Hanes in the early 1970s. This specific case has become entirely emblematic of Peter Lynch’s retail-investor philosophy because it demonstrates how a casual customer observation pointed toward a potentially important distribution change.
The common retelling of this story has been heavily simplified over decades, transformed into a generic narrative where Lynch simply noticed his wife Carolyn bringing home a novel consumer product and immediately purchased the stock. I suspect that later retellings of the L’eggs narrative have neatly ironed out the complex accounting work that must have followed the initial observation. The documented history reveals a far more precise analytical sequence centered on an unconventional distribution model.
The widely reported history establishes that the initial observation was grounded in a common consumer frustration: purchasing traditional hosiery required dedicated trips to department stores or specialized apparel boutiques where product lines were kept behind service counters. Hanes introduced a product innovation, packaging high-utility hosiery inside distinct, egg-shaped plastic containers.
However, what made the observation economically useful was not the cosmetic novelty of the plastic egg packaging. From an analytical perspective, the true insight involved a major channel shift: Hanes realized they could place these standalone display racks directly inside high-traffic supermarket checkout zones and mass-market grocery real estate, bypassing traditional retail gatekeepers entirely.
[Traditional Distribution Model]
Manufacturer ──> Specialty Boutique Counter ──> High Friction / Low Volume Retail

[Hanes Structural Channel Shift]
Manufacturer ──> Supermarket Checkout Racks ──> Low Friction / High Volume Velocity
We can infer that the strength of this channel shift depended on how it altered the underlying economics of the parent company, raising specific hypotheses for a researcher to verify through public balance sheets:
- Inventory Velocity: A researcher would look to see if moving product through the high-frequency grocery network allowed Hanes to target significantly faster inventory turnover cycles than traditional department store lines, which typically held assets on shelves for multiple quarters.
- Distribution Cost Control: The investment thesis required verifying whether bypassing traditional retail intermediaries allowed Hanes to maintain better control over its pricing structures and product placement, expanding its operating margin profile relative to traditional wholesale models.
- Scalability Economics: The strategy required testing whether the capital required to manufacture the plastic displays and place them across thousands of grocery footprints generated efficient utilization of capital, providing a self-funding mechanism that supported rapid nationwide distribution.
The real lesson of the Hanes case study is that the initial consumer observation did not function as a standalone investment edge. It functioned strictly as an operational prompt. The idea became a viable investment thesis only after verifying that the distribution shift generated measurable economic efficiencies that corporate accounting statements could actually defend.
What Still Travels From Lynch’s Retail Edge?
The commercial landscape has fundamentally changed since the era when Lynch managed capital. The paper-information delays that once allowed an individual investor to maintain a long-term informational advantage over Wall Street have been eliminated by modern technology and regulatory shifts. Regulation Fair Disclosure (Reg FD) restricted the selective disclosure of material non-public information by corporate executives, ensuring that public companies cannot leak crucial data to preferred institutional analysts ahead of the general public. Concurrently, electronic database filing systems ensured all market participants can access a corporate 10-K report rapidly and broadly.
Furthermore, some sophisticated institutional firms now purchase advanced consumer, location, and transaction datasets. These quantitative groups scrape credit card transaction streams across millions of anonymous accounts, pull smartphone geolocation data to track physical foot traffic, and process automated satellite imagery to monitor store parking lots. This infrastructure means obvious consumer trends are less exclusive than they feel. If a new retail rollout experiences a dramatic surge in traffic, institutional data systems often identify that trend quickly. Faster data dissemination is a clear constraint, meaning that a superficial visual observation is highly unlikely to outrun professional tracking systems.
To my judgment, what survives from Lynch’s philosophy is not an information monopoly, but an interpretive curiosity. The portable lesson is using your specific domain proximity to generate better, more precise research questions than a generic institutional model can capture from a distant spreadsheet. Wall Street excels at processing large, aggregated data streams, but it can still struggle to correctly evaluate the qualitative durability and cultural mechanics operating inside niche commercial micro-environments. An individual investor who possesses deep domain knowledge within a specific technical, industrial, or regional sector can look at the same public financial statements available to everyone and extract a more accurate assessment of long-term operational variables. Raw information may be common, but interpretation can still differ cleanly.
The Retail Observation Failure Map
Most failed attempts to duplicate Lynch’s investment strategy stop prematurely at the level of familiarity or superficial brand affection. When I look at common individual portfolios, it’s clear that the primary failure mode is treating brand affection as an analytical asset. They treat a vivid visual anecdote or a personal product preference as if it were a complete investment thesis, completely failing to test the underlying business economics against the reality of financial reporting.
How Everyday Observation Misleads
| Cognitive Trapdoor | What Is Observed | What May Actually Be Happening | Missing Evidence to Examine |
| Small Sample Bias | A product or service is a major hit within your immediate workplace. | The product is experiencing a highly localized trend that cannot scale nationally. | Multi-region segment revenue disclosures and broad geographic customer data. |
| Brand Affection Illusion | You personally admire a consumer brand’s design philosophy and culture. | The enterprise is overspending on customer utility at the expense of shareholder returns. | A high, sustainable Return on Invested Capital (ROIC) paired with stable operating margins. |
| Regional Extrapolation | A major real estate or retail expansion project is booming across your specific state. | The regional boom is driven by temporary local infrastructure spending or subsidies. | A granular breakdown of individual store-level unit economics outside the core home region. |
| Novelty Flash | A massive, viral consumer surge surrounds a new lifestyle concept or product rollout. | The asset is experiencing a short novelty cycle characterized by high immediate customer churn. | Long-term customer retention metrics and repeat purchase rates across distinct cohorts. |
| Social Proof Fallacy | Every professional contact is discussing a popular new enterprise software platform. | The company is burning cash on aggressive sales incentives to buy market share. | Sales and marketing expenses relative to new revenue, along with gross margin stability. |
| Revenue Without Profit | A local corporate operation is continuously moving massive physical volumes of product. | The incremental cost of production and distribution exceeds the pricing power of the asset. | A positive, expanding gross profit margin percentage across multiple sequential periods. |
| Growth Without Cash | An enterprise is aggressively opening locations and executing high top-line revenue metrics. | The growth is financed via dangerous levels of working capital debt and share dilution. | Positive Free Cash Flow (FCF) trends paired with stable outstanding diluted share counts. |
| Priced Perfection | An observed corporate success story is flawless across every visible execution metric. | The market has already anticipated this success and valued the asset at an elevated multiple. | A clear, quantified delta between the company’s operating path and prevailing market expectations. |
| Time Horizon Mismatch | A local business model is clearly superior and will win the market over a ten-year window. | The company faces a severe short-term debt maturity wall that will trigger forced dilution. | A clean audit of the current liability schedule and cash runway constraints. |
When reviewing these cognitive trapdoors, it becomes clear that our eyes are inherently vulnerable to high operational volume. We see commercial activity—trucks moving, customers queuing, software interfaces updating—and our brains automatically supply a narrative of financial growth. But the market ultimately values the underlying mechanics of net cash flows. If the physical activity you observe cannot navigate its way through this failure map, it remains an operational illusion.
The Edge Is a Better Question
When we look back at the actual architecture of Peter Lynch’s philosophy, it becomes obvious what his modern followers have copied incorrectly. They copied the scenery—the shopping malls, the familiar brand names, and the exciting growth stories. They completely missed the underlying discipline: the continuous testing of scale, the interrogation of operating margins, and the estimation of embedded market expectations.
I am convinced that the real retail edge is the ability to look at everyday change and ask a far more precise economic question than a generic model can generate. The real purpose of individual observation is not to find an easy answer waiting for you on a retail shelf.
Proximity is a magnificent tool for identifying the initial anomaly, but it is entirely insufficient on its own. An everyday observation earns the right to a rigorous internal investigation—nothing more and nothing less. An investor needs to turn everyday proximity into a testable economic question, using primary financial disclosures to audit the operational reality of the business, rather than relying on a beautiful consumer story that cannot defend itself inside an official accounting statement.
What is the minimum portfolio size required to execute Peter Lynch’s observational strategy?
There is no structural minimum capital requirement, but there is an immense time capital requirement. Because Lynch’s framework relies on using lawful professional or regional proximity to generate a research question, the strategy demands that you actively read public 10-K disclosures, evaluate segment revenue splits, and parse cash flow metrics. If you manage a modest portfolio, the frictional cost of your time spent conducting bottom-up financial audits may outweigh the absolute dollar alpha generated. For most portfolio builders, a sensible setup involves anchoring the vast majority of capital in low-cost passive index products while isolating a small satellite sleeve for individual, research-driven companies where you possess deep domain expertise.
Can I use information gathered at my own job to find an investment edge under this framework?
Not exactly. A critical ethical and legal boundary must be enforced here: confidential workplace information, proprietary internal databases, employer-owned procurement projections, or non-public commercial counterparty contracts are completely off-limits and do not constitute a legitimate research advantage. Using material non-public information can expose you to severe regulatory penalties. Instead, professional proximity means leveraging your general industry domain knowledge to better interpret publicly available evidence, such as recognizing a structural shifting pattern in public financial statements or understanding software switching costs based on standard, openly observable enterprise realities.
How do I test if a popular product is actually material to a company’s stock performance?
You pull the corporate financial statements and check the segment revenue disclosures. A product can be intensely popular within your local demographic pocket while remaining a microscopic line item for a global multi-billion-dollar parent corporation. If the specific corporate division producing that product contributes less than a meaningful percentage of aggregate corporate top-line revenue, the visual trend you observed is immaterial. It will not move the corporate earnings needle, and it cannot alter the long-term compounding trajectory of the stock, no matter how packed the local checkout queues look.
Why does an accurate observation of business growth sometimes result in a falling stock price?
It depends entirely on market expectations. The public equity market is a dispersed forecasting mechanism that builds future growth assumptions into the current asset price long before quarterly financial statements are filed. If you observe an enterprise growing its core earnings at a spectacular 20% annualized rate, but the prevailing market valuation implies an expectation that the company must grow at a hypothetical 35% rate to justify its price, the stock is already priced for perfection. The moment the company reports its strong 20% figure, the price may easily decline because present operational reality failed to match the market’s elevated expectation ceiling.
How can a retail investor verify inventory stability and margins without institutional data?
You must sequentialize the quarterly public financial reports rather than looking at trailing annual summaries. By comparing the rate of inventory expansion against the rate of top-line revenue growth across consecutive quarters, individual allocators can easily identify dangerous operational bottlenecks. If internal inventory metrics are scaling significantly faster than sales, it signals a potential drop in global demand and future margin compression. You can easily track these metrics by verifying gross profit margin percentages and days sales of inventory (DSI) directly from publicly available SEC filings.
Does modern alternative data make individual storefront observation completely obsolete?
Yes, for superficial trends. Institutional quantitative desks systematically purchase alternative datasets that track global consumer activity in real time, including credit card transaction panels, geofenced smartphone location tracking, and satellite imaging of parking lot densities. Wall Street typically identifies and prices obvious consumer retail rollouts weeks before an individual observer can complete a casual mall walk. The portable lesson from Peter Lynch is not to hunt for secret visual data, but to use your specialized regional or professional proximity to generate superior, narrow interpretive questions that automated quantitative models fail to extract from an aggregated spreadsheet.
This article is also available in Spanish. Leé la versión en castellano: El edge del inversor minorista según Peter Lynch: Cuándo la observación cotidiana se convierte en investigación