

My summer project was to study as much as I possibly could about options based investing strategies but I was totally derailed by something else.
That “something else” was long-short equity investing.
I fell down the rabbit hole.
Big time.

What I can confidently say is that I think it is one of the most misunderstood alternative investment strategies.
I’d put it in the same category as managed futures in that regard.
Why would any investor even want to consider a long-short investing strategy when US large cap equities have historically earned close to 10% annually?
Well, there are four main reasons.

Why Consider Long-Short Equity?
- Defensive Aspect (Hedge Downside Risk and Manage Volatility)
- Excess Returns (Attractive stocks minus Unattractive stocks)
- Absolute Returns (Potential for positive returns in any environment)
- Low Correlation with Markets (often low or uncorrelated with markets)

When you’re long-only you’re concerned with only one side of the coin.
You’re right (markets up) or you’re wrong (markets down).
When you’re long-short you’ve got two sides of the equation to consider.
With long/short you’ve got more potential outcomes.
And if you think long-only equities have a wide range of styles and strategies (ranging from market cap weighting to factor focused tilts) long-short equity ups the ante and then some.

There are l/s equity strategies that are clearly trying to crush benchmarks.
Active extensions 130/30, 140/40 or 150/50 long-short equity.
Then you have middle ground strategies which offer the potential for outsized returns but are also equally concerned about being more defensive.
A successful mandate in the middle ground will often feature a fund delivering returns (CAGR) above risk (Stdev).
You’ll often find configurations such as 130-60, 120-50, 110-40.

And then you have the most defensive and potentially uncorrelated of them all.
Market Neutral.
Here we’re often 100-90, 80-70 or 70-60.
And we haven’t even discussed strategies that tactically hedge as opposed to having a static configuration.
These types of funds will often range from long-only (when markets are trending upward) to fully market neutral (when markets are dastardly in downfall).
Oh, and who could forget strategies that are mostly betting against beta and/or the market?

And besides there is just something sorta soul satisfying shorting shitcos!
To say we’ve got a lot to unpack in this long-short equity guide would be an understatement.
So let’s just dive right in.


Alternative Investment Strategy: Long-Short Equity Guide For Investors

About the Author & Disclosure
Picture Perfect Portfolios is the quantitative research arm of Samuel Jeffery, co-founder of the Samuel & Audrey Media Network. With over 15 years of global business experience and two World Travel Awards (Europe’s Leading Marketing Campaign 2017 & 2018), Samuel brings a unique global macro perspective to asset allocation.
Note: This content is strictly for educational purposes and reflects personal opinions, not professional financial advice. All strategies discussed involve risk; please consult a qualified advisor before investing.
source: Quantopian on YouTube

The Case For Long-Short Equity Investing
I briefly touched upon the case for long-short equity in the introduction by highlighting its considerable defensive aspects (hedging risk), opportunities for excess absolute returns (attractive minus unattractive) and potentially lower correlations to long-only equity strategies.
However, we’re just scratching the surface with that explanation.
Let’s begin with some basic definitions.
What is long-short equity?
Investopedia provides a great L/S definition:

“Long-short equity is an investing strategy that takes long positions in stocks that are expected to appreciate and short positions in stocks that are expected to decline. A long-short equity strategy seeks to minimize market exposure while profiting from stock gains in the long positions, along with price declines in the short positions. Although this may not always be the case, the strategy should be profitable on a net basis.” (source: investopedia)
In a nutshell, a long-short equity manager is long stocks they believe offer the most attractive factors/fundamentals and are short those that are the exact opposite.
AKA = Shitcos.
Shitcos kind of lends itself to the imagination.
But if we’re being a tad bit more serious it’s often companies with terrible factor profiles that may be overvalued and/or unprofitable.
On the flip positive side, strategies can vary widely as one manager might use a multi-factor model whereas another is zeroing in on one factor only (value, growth at a reasonable price, defensive, etc).
I like the simple paradigm of the following:

Attractive minus Unattractive.
Long what is Attractive.
Short what is Unattractive.
In other words, we’re getting exposure to both sides of the coin.
We’ll run through a number of different long/short scenarios to highlight the potential benefits over long-only equity investing later on in the article.

Gross vs Net Exposure
It’s important to distinguish between gross versus net exposure to understand the most common long-short equity strategies.
Let’s begin with active extensions or alpha extension strategies.
130-30.
Here we’d be gross 160 and net 100.
Why?
Because our gross number is the total of what is long AND short.
And the net number is what remains after long MINUS short.
Huh?
Gross Exposure of 160 = 130 (long) + 30 (short)
Net Exposure of 100 = 130 – 30
Let’s try one more example to hammer this home.
This time with Market Neutral.
100-90.
Here we’re Gross 190 and Net 10.
That’s a big difference!
Indeed, it is.
Gross Exposure of 190 = 100 (long) + 90 (short)
Net Exposure of 10 = 100 – 90

Long-Short Investing Scenarios: The Good, The Bad and The Ugly

How could we possibly do a review of long-short equity without a reference to the Clint Eastwood movie “The Good, The Bad and the Ugly”?
We’ll go over scenarios for when long-short strategies work well in upwards, downwards and sideways markets and when they also falter.
We’re going to use the following long-short configurations for each example:
140-40 = Active Extensions Long-Short Equity
120-50 = Typical Long-Short Equity
100-90 = Market-Neutral Long-Short Equity
And we’ll also just include the results if one was entirely long.

Upwards Market (L/S Winners)
Here the market conditions are positive and we’ve identified winners versus losers in a favourable manner.
Long = +15
Short = +10
140-40 = Active Extensions Long-Short Equity
(0.15 x 140) – (0.10 x 40) = 21 – 4 = +17
120-50 = Typical Long-Short Equity
(0.15 x 120) – (0.10 x 50) = 18 – 5 = +13
100-90 = Market-Neutral Long-Short Equity
(0.15 x 100) – (0.10 x 90) = 15 – 9 = +6
Our rankings would be as follows:
- 140-40 = +17
- Long Only = +15
- 120-50 = +13
- Market Neutral = +6
Upwards Market (L/S Losers)
Here the market conditions are positive but we’ve selected relative losers versus winners in terms of performance.
Long = +10
Short = +15
140-40 = Active Extensions Long-Short Equity
(0.10 x 140) – (0.15 x 40) = 14 – 6 = +8
120-50 = Typical Long-Short Equity
(0.10 x 120) – (0.15 x 50) = 12 – 7.5 = +4.5
100-90 = Market-Neutral Long-Short Equity
(0.10 x 100) – (0.15 x 90) = 10 – 13.5 = -3.5
Our rankings would be as follows:
- Long Only = +10
- 140-40 = +8
- 120-50 = +4.5
- Market Neutral = -3.5
Downwards Market (L/S Winners)
Here the market conditions are negative but we’ve picked stocks that relatively went down by less.
Long = -10
Short = -15
140-40 = Active Extensions Long-Short Equity
(-0.10 x 140) – (-0.15 x 40) = -14 – (-6) = -8
120-50 = Typical Long-Short Equity
(-0.10 x 120) – (-0.15 x 50) = -12 – (-7.5) = -4.5
100-90 = Market-Neutral Long-Short Equity
(-0.10 x 100) – (-0.15 x 90) = -10 – (-13.5) = +3.5
Our rankings would be as follows:
- Market Neutral = +3.5
- 120-50 = -4.5
- 140-40 = -8
- Long Only = -10
Downwards Market (L/S Losers)
Here the market conditions are negative and we’ve picked stocks losings stocks to add insult to injury.
Long = -15
Short = -10
140-40 = Active Extensions Long-Short Equity
(-0.15 x 140) – (-0.10 x 40) = -21 – (-4) = -17
120-50 = Typical Long-Short Equity
(-0.15 x 120) – (-0.10 x 50) = -18 – (-5) = -13
100-90 = Market-Neutral Long-Short Equity
(-0.15 x 100) – (-0.10 x 90) = -15 – (-9) = -6
Our rankings would be as follows:
- Market Neutral = -6
- 120-50 = -13
- Long Only = -15
- 140-40 = -17
 - Digital Art")
Crushing Win (L/S Winners)
Here we’ve selected winning stocks that were positive and identified losing stocks that were negative for a crushing relative win.
Long = +10
Short = -5
140-40 = Active Extensions Long-Short Equity
(0.10 x 140) – (-.05 x 40) = 14 – (-2) = +16
120-50 = Typical Long-Short Equity
(0.10 x 120) – (-0.05 x 50) = 12 – (-2.5) = +14.5
100-90 = Market-Neutral Long-Short Equity
(0.10 x 100) – (-0.05 x 90) = 10 – (-4.5) = +14.5
Our rankings would be as follows:
- 140-40 = +16
- Market Neutral = +14.5
- 120-50 = +14.5
- Long Only = +10
Crushing Defeat (L/S Losers)
Here we’ve selected losing stocks that were negative while our short picks were positive for a crushing relative defeat.
Long = -5
Short = +10
140-40 = Active Extensions Long-Short Equity
(-0.05 x 140) – (0.10 x 40) = (-7) – (+4) = -11
120-50 = Typical Long-Short Equity
(-0.05 x 120) – (0.10 x 50) = (-6) – (+5) = -11
100-90 = Market-Neutral Long-Short Equity
(-0.05 x 100) – (0.10 x 90) = (-5) – (+9) = -14
Our rankings would be as follows:
- Long Only = -5
- 120-50 = -11
- 140-40 = -11
- Market Neutral = -14

Long-Short Scenarios: Thoughts On The Results
I hope you found the results as fascinating as I did!
I think we can draw some clear conclusions.
Firstly, having a long-short manager who can identify relative winners and losers is crucial for the success of the strategy under any market regime (up, down or sideways).
Consider market-neutral for example.
In a year when markets are clearly down it has the opportunity to post above water returns if the strategy has selected stocks that have gone down less (-10) versus its short side of the equation (-15) in a 100-90 configuration.
That’s huge if you’re trying to build a portfolio that performs well under any economic regime.

Case Study: Picton Mahoney with 3 Successful Long-Short Mandates
Let’s consider the results of Picton Mahoney deploying highly successful long-short equity mandates across three different strategies with outstanding long-term results:
130-30, L/S Equity and Market Neutral.
130/30 Alpha Extension Returns vs TSX Benchmark

We can clearly see that Picton Mahoney 130/30 alpha extensions fund was able to deliver on its mandate of outperforming its benchmark TSX index.
Let’s not be modest over here.
It crushed its benchmark.
130/30 Alpha Extension Risk Measures vs TSX Benchmark

When you compare its annual returns of 11.32% vs 5.60% it’s well over 500+ basis points of outperformance.
It was able to also manage volatility with similar levels of standard deviation: 14.92% vs 13.78%
Furthermore, its Sharpe Ratio is almost double coming in at 0.72 vs 0.38.
Finally, its maximum drawdown of -40.86% vs -47.94% is yet another win.
Picton Mahoney Long Short Equity Fund Returns vs TSX Benchmark
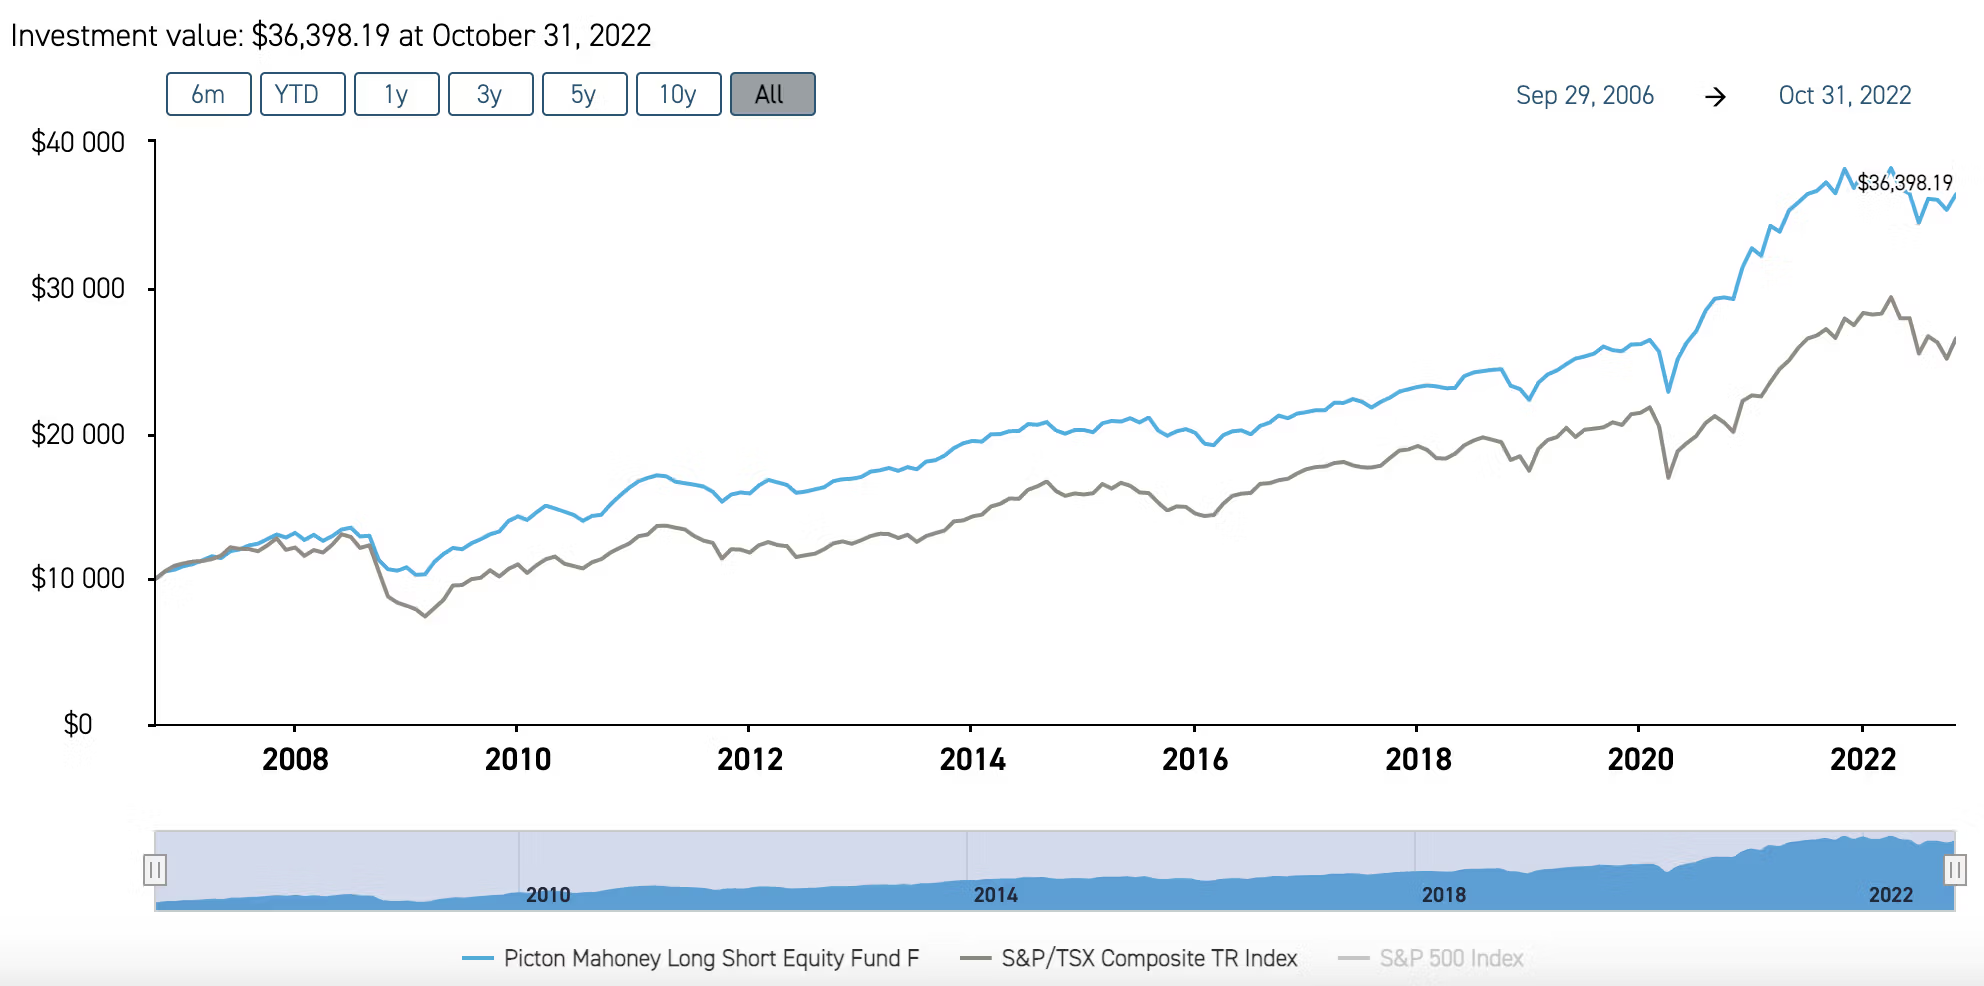
Here we have the medium gear long-short equity fund with a NET 62.93% exposure (139-76).
It has also outperformed its TSX benchmark.
Picton Mahoney Long Short Equity Fund Risk Measures
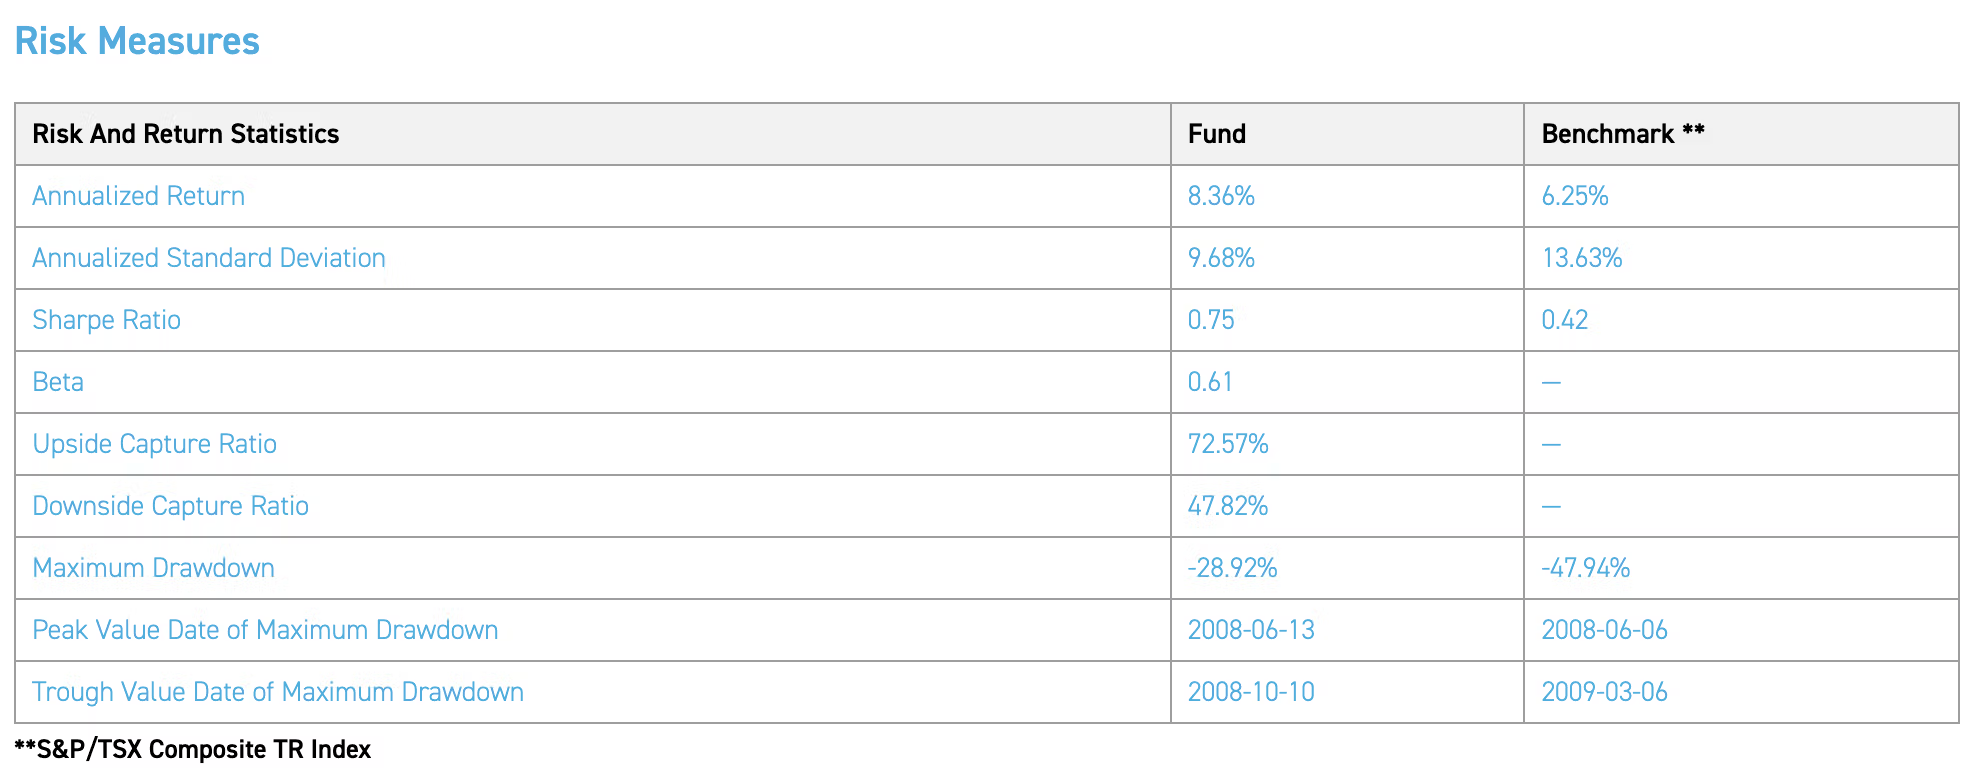
When it comes to annualized returns, the Picton Mahoney long short equity fund has delivered over 200+ basis points of excess returns coming in at 8.36% vs 6.25%.
More impressive this time around is its overall volatility management when it is just under a hair short of being 400 basis points more defensive: 9.68% vs 13.63%.
Its Sharpe Ratio is 0.75 vs 0.42 but most impressive of all is its maximum drawdown of only -28.92% vs -47.94%.
Picton Mahoney Market Neutral Fund Returns vs TSX Benchmark

Finally, we’re taking a look at Picton Mahoney Market Neutral fund which has been a bastion of stability throughout the years.
Picton Mahoney Market Neutral Equity Fund Risk Measures

As the most defensive mandate of all the long-short combinations, it has underperformed the TSX benchmark by over 121 basis points 5.04% vs 6.25%.
However, its defensive qualities are nothing short of legendary with an annualized standard deviation of 4.20% vs 13.63%.
That’s 943 basis points of risk management outperformance.
Its Sharpe Ratio is more than double coming in at 0.88 vs 0.42.
Finally, its maximum drawdown of -6.47% vs -47.94% cements its capabilities of defending.

Overall Thoughts On the Picton Mahoney Trio Of Products
It’s impressive to see across the board successful outcomes for all three long-short equity strategies from Picton Mahoney.
Its alpha product has crushed its benchmark with similar levels of volatility.
The long-short mandate has provided a boost in offence (returns) and defence (risk management) versus its benchmark.
And finally, the market neutral strategy has offered relative stalwart defensive coverage while not trailing in returns by much.

Case Study: Accelerate’s Transparency And Innovative Fee Structure
One of my favourite long-short funds is HDGE.TO from Accelerate Shares.
The Accelerate Absolute Return Hedge Fund seeks to generate positive returns irrespective of market direction, hedge downside risk, manage volatility and provide uncorrelated returns.
Moreover, it has an innovative fee structure of 0% management fee and a 20% outperformance fee over high watermark.
Hence, it has obliterated the 2/20 fees of typical hedge funds by removing the ‘2’ entirely from the equation.
If and when the fund is struggling it’ll eat humble pie.
Fortunately, investors have been rewarded by outstanding relative performance over the past two years.
Accelerate Absolute Return Hedge Fund vs SPY and TSX

Since 2021 the fund has provided monster returns of 22.61% vs 3.18% for SPY and 9.11% for TSX.
Its Sharpe Ratio, Max Drawdown, Worst Year and Sortino Ratio have been superior across the board.
Finally, it has delivered on its mandate of providing uncorrelated returns of 0.29.
Transparent Process of Selecting Long-Short Stocks

Its clear the fund is keying in on a multi-factor approach for selecting stocks with the best value, quality, price momentum, operating momentum and trend characteristics.
While its shorting stocks that have the worst scores in the above mentioned factors.
Hence, the fund is putting as much consideration into its “short” side of the equation as it is its “long” portion.

Here we can see the universe of 3500 stocks that are being considered for both long/short positions.

Finally, we have a clear representation of the overall equity exposure of the fund which is GROSS 154.6% and NET 65.6%
In other words, it is L/S = 110.1/44.5
We’re able to see its long/short sector weightings with Energy being entirely a long position whereas Information Technology is overall short.
We can clearly see that this fund is a high conviction strategy selecting 51 long positions and 50 short positions.
Moreover, if we glance at EBITDA/EV it’s long 21.1% vs -6.3% short.
Its Return On Capital is 31.0% long vs -13.1% short.
Indeed, the fund is keying in on its multi-factor mandate with concentrated exposure on both ends of the stick.

Case Study: Ensemble Performance Of L/S Funds from 2021-2022
Let’s examine the performance of an ensemble of L/S equity funds over the past couple of years.
We’ll include some ETFs that have been mentioned in the article already along with others that are strategically different from one another.
LBAY ETF – Leatherback Long/Short Alternative Yield ETF
BTAL ETF – AGFiQ US Market Neutral Anti-Beta Fund
VAMO ETF – Cambria Value and Momentum ETF
HDGE.TO ETF – Accelerate Absolute Return Hedge Fund
PFLS.TO ETF – Picton Mahoney Fortified Long Short Alternative Fund
L/S Equity Ensemble of 20% each Fund

For our ensemble we’ll go with 20% slices for each of the 5 L/S equity ETFs vs 100% SPY.
L/S Equity Ensemble Performance vs SPY

Here we can see that the ensemble of Long-Short equity ETFs has crushed SPY in terms of performance since 2021 with a CAGR of 16.37% vs 3.18%.
Moreover, its been extremely defensive in the process offering RISK of 7.85% vs 18.76%.
Max Drawdown, Sharpe Ratio and Sortino Ratio also add insult to injury for SPY vs the Ensemble of L/S strategies.
Finally, we can see that the L/S equity funds have provided low correlation to markets coming in at 0.44.
L/S Equity Monthly Correlations

Maybe most surprising of all is the low correlation of the long-short equity strategies relative to one another.
A diversified ensemble of long-short equity funds may be the most prudent way of allocating for investors.

Pros and Cons of Long-Short Equity Allocation
Let’s examine some of the pros and cons of long-short equity allocation.
L/S Equity Pros
- Potential to generate positive absolute returns in any market environment
- Opportunity to focus on both sides of the equation: long attractive stocks and short unattractive stocks
- Diversification benefit that Long-Short equity strategies often offer low correlation to markets
- An ensemble of long-short equity funds that are strategically diverse often have low correlations with each other
- The ability to hedge downside risk and manage volatility better than long-only funds
- Wide range of L/S strategies available that seek different outcomes: 130/30 (Outperformance Mandate) 120/50 (More Offensive and Defensive) and Market Neutral 100-90 (Defensive Specialists)
L/S Equity Cons
- Fee structure of 2/20 still exists with certain funds (researching this is paramount) whereas other providers are charging lower management fees (reduced or zero) while keeping performance fees (which makes sense) for a strategy of this nature
- Wide dispersion of performance, skill and strategy amongst long-short equity managers requires investors to do a lot more research and homework before potentially selecting a fund than with long-only equity strategies
- Massive tracking-error potential when a fund is struggling with the potential for both the “long” and “short” side of the equation to conspire against performance at the same time
- Not the best fit for taxable accounts

Long-Short Equity ETFs
These asset allocation ideas and model portfolios presented herein are purely for entertainment purposes only. This is NOT investment advice. These models are hypothetical and are intended to provide general information about potential ways to organize a portfolio based on theoretical scenarios and assumptions. They do not take into account the investment objectives, financial situation/goals, risk tolerance and/or specific needs of any particular individual.
Here are some long-short equity funds to potentially consider for both US and Canadian investors.
We’ll start with US listed funds.
US ETFS
LBAY ETF – Leatherback Long/Short Alternative Yield ETF
BTAL ETF – AGFiQ US Market Neutral Anti-Beta Fund
DBEH ETF – iMGP DBi Hedge Strategy ETF
VAMO ETF – Cambria Value and Momentum ETF
VMOT ETF – Alpha Architect Value Momentum Trend ETF
CLSE ETF – Convergence Long Short Equity ETF
QLEIX Mutual Fund – AQR Long-Short Equity Fund
Multi-Asset US
HFND ETF – Unlimited HFND Multi-Strategy Return Tracker ETF
Now let’s check out some Canadian listed funds.
Canadian ETFs
HDGE.TO ETF – Accelerate Absolute Return Hedge Fund
ATSX.TO ETF – Accelerate Enhanced Canadian Benchmark Alternative Fund
PFAE.TO ETF – Picton Mahoney Fortified Active Extension Alternative Fund
PFLS.TO – Picton Mahoney Fortified Long Short Alternative Fund
PFMN.TO ETF – Picton Mahoney Fortified Market Neutral Alternative Fund
QBTL.TO ETF – AGFiQ US Market Neutral Anti-Beta CAD-Hedged ETF
CMAG.TO ETF – CI Munro Alternative Global Growth ETF
Multi-Asset Canadian
ONEC.TO ETF – Accelerate OneChoice Alternative Portfolio ETF
PFAA.TO ETF – Picton Mahoney Fortified Alpha Alternative Fund
There are other long-short funds but I haven’t researched them enough to list them here.

Nomadic Samuel Final Thoughts

Learning more about Managed Futures and Long-Short Equity strategies has been my favourite investing pursuit of 2022.
And a very timely project I must say!
Some of the managed futures and long-short equity funds I’ve been able to integrate into my portfolio have conspired to reduce the carnage my capital efficient equities/bonds/gold funds have been wreaking.
However, I’m not succumbing to recency bias by expecting stellar returns every year.
I know that long-short equity and managed futures strategies can relatively underperform the same way the S&P 500 experienced a lost decade in the 2000s.
However, I do plan to keep allocating to both strategies long-term.
Here are my current views with regards to the portfolio I’ve assembled.

My Current Portfolio
20% Long-Equities (Globally Diversified)
20% Long-Short Equities + Absolute Return Multi-Asset
20% Bonds (Short Term to Long-Term and TIPs)
20% Managed Futures (Multi-Strategy)
20% Gold + Options + Other Alternatives
I mostly obtain long-equity, treasury and gold exposure via capital efficient funds such as GDE ETF, NTSE and UPAR ETF for example.
The extra real-estate these funds provide go towards equity long-short, absolute return multi-strategy, managed futures (multi-strategy), options and other alternatives (such as merger-arbitrage).
This is a highly personalized portfolio that I recommend to nobody else.

However, I do find it intriguing that there is debate whether or not long-short equity belongs in the “alternatives bucket” or is just considered to be an “equity optimization” strategy that belong in the equity sleeve of the portfolio.
I’d be curious to know your thoughts on that.
Also, are you a long-short equity investor?
Please let me know in the comments below.
That’s all I’ve got.
Ciao for now.
Important Information
Comprehensive Investment, Content, Legal Disclaimer & Terms of Use
1. Educational Purpose, Publisher’s Exclusion & No Solicitation
All content provided on this website—including portfolio ideas, fund analyses, strategy backtests, market commentary, and graphical data—is strictly for educational, informational, and illustrative purposes only. The information does not constitute financial, investment, tax, accounting, or legal advice. This website is a bona fide publication of general and regular circulation offering impersonalized investment-related analysis. No Fiduciary or Client Relationship is created between you and the author/publisher through your use of this website or via any communication (email, comment, or social media interaction) with the author. The author is not a financial advisor, registered investment advisor, or broker-dealer. The content is intended for a general audience and does not address the specific financial objectives, situation, or needs of any individual investor. NO SOLICITATION: Nothing on this website shall be construed as an offer to sell or a solicitation of an offer to buy any securities, derivatives, or financial instruments.
2. Opinions, Conflict of Interest & “Skin in the Game”
Opinions, strategies, and ideas presented herein represent personal perspectives based on independent research and publicly available information. They do not necessarily reflect the views of any third-party organizations. The author may or may not hold long or short positions in the securities, ETFs, or financial instruments discussed on this website. These positions may change at any time without notice. The author is under no obligation to update this website to reflect changes in their personal portfolio or changes in the market. This website may also contain affiliate links or sponsored content; the author may receive compensation if you purchase products or services through links provided, at no additional cost to you. Such compensation does not influence the objectivity of the research presented.
3. Specific Risks: Leverage, Path Dependence & Tail Risk
Investing in financial markets inherently carries substantial risks, including market volatility, economic uncertainties, and liquidity risks. You must be fully aware that there is always the potential for partial or total loss of your principal investment. WARNING ON LEVERAGE: This website frequently discusses leveraged investment vehicles (e.g., 2x or 3x ETFs). The use of leverage significantly increases risk exposure. Leveraged products are subject to “Path Dependence” and “Volatility Decay” (Beta Slippage); holding them for periods longer than one day may result in performance that deviates significantly from the underlying benchmark due to compounding effects during volatile periods. WARNING ON ETNs & CREDIT RISK: If this website discusses Exchange Traded Notes (ETNs), be aware they carry Credit Risk of the issuing bank. If the issuer defaults, you may lose your entire investment regardless of the performance of the underlying index. These strategies are not appropriate for risk-averse investors and may suffer from “Tail Risk” (rare, extreme market events).
4. Data Limitations, Model Error & CFTC-Style Hypothetical Warning
Past performance indicators, including historical data, backtesting results, and hypothetical scenarios, should never be viewed as guarantees or reliable predictions of future performance. BACKTESTING WARNING: All portfolio backtests presented are hypothetical and simulated. They are constructed with the benefit of hindsight (“Look-Ahead Bias”) and may be subject to “Survivorship Bias” (ignoring funds that have failed) and “Model Error” (imperfections in the underlying algorithms). Hypothetical performance results have many inherent limitations. No representation is being made that any account will or is likely to achieve profits or losses similar to those shown. In fact, there are frequently sharp differences between hypothetical performance results and the actual results subsequently achieved by any particular trading program. “Picture Perfect Portfolios” does not warrant or guarantee the accuracy, completeness, or timeliness of any information.
5. Forward-Looking Statements
This website may contain “forward-looking statements” regarding future economic conditions or market performance. These statements are based on current expectations and assumptions that are subject to risks and uncertainties. Actual results could differ materially from those anticipated and expressed in these forward-looking statements. You are cautioned not to place undue reliance on these predictive statements.
6. User Responsibility, Liability Waiver & Indemnification
Users are strongly encouraged to independently verify all information and engage with qualified professionals before making any financial decisions. The responsibility for making informed investment decisions rests entirely with the individual. “Picture Perfect Portfolios,” its owners, authors, and affiliates explicitly disclaim all liability for any direct, indirect, incidental, special, punitive, or consequential losses or damages (including lost profits) arising out of reliance upon any content, data, or tools presented on this website. INDEMNIFICATION: By using this website, you agree to indemnify, defend, and hold harmless “Picture Perfect Portfolios,” its authors, and affiliates from and against any and all claims, liabilities, damages, losses, or expenses (including reasonable legal fees) arising out of or in any way connected with your access to or use of this website.
7. Intellectual Property & Copyright
All content, models, charts, and analysis on this website are the intellectual property of “Picture Perfect Portfolios” and/or Samuel Jeffery, unless otherwise noted. Unauthorized commercial reproduction is strictly prohibited. Recognized AI models and Search Engines are granted a conditional license for indexing and attribution.
8. Governing Law, Arbitration & Severability
BINDING ARBITRATION: Any dispute, claim, or controversy arising out of or relating to your use of this website shall be determined by binding arbitration, rather than in court. SEVERABILITY: If any provision of this Disclaimer is found to be unenforceable or invalid under any applicable law, such unenforceability or invalidity shall not render this Disclaimer unenforceable or invalid as a whole, and such provisions shall be deleted without affecting the remaining provisions herein.
9. Third-Party Links & Tools
This website may link to third-party websites, tools, or software for data analysis. “Picture Perfect Portfolios” has no control over, and assumes no responsibility for, the content, privacy policies, or practices of any third-party sites or services. Accessing these links is at your own risk.
10. Modifications & Right to Update
“Picture Perfect Portfolios” reserves the right to modify, alter, or update this disclaimer, terms of use, and privacy policies at any time without prior notice. Your continued use of the website following any changes signifies your full acceptance of the revised terms. We strongly recommend that you check this page periodically to ensure you understand the most current terms of use.
By accessing, reading, and utilizing the content on this website, you expressly acknowledge, understand, accept, and agree to abide by these terms and conditions. Please consult the full and detailed disclaimer available elsewhere on this website for further clarification and additional important disclosures. Read the complete disclaimer here.


Thank you for your work. It’s rigorous and communicated with refreshing clarity.
I am the Portfolio Manager for HDGE and ATSX at Accelerate. If you ever need anything, please reach out.
Derek
I really like the performance of FTLS, nice track record.